
What's new from Grafana Labs
Grafana Labs products, projects, and features can go through multiple release stages before becoming generally available. These stages in the release life cycle can present varying degrees of stability and support. For more information, refer to release life cycle for Grafana Labs.


Loading...
Area of interest:
Cloud availability:
Cloud editions:
Self-managed availability:
Self-managed editions:
No results found. Please adjust your filters or search criteria.
There was an error with your request.
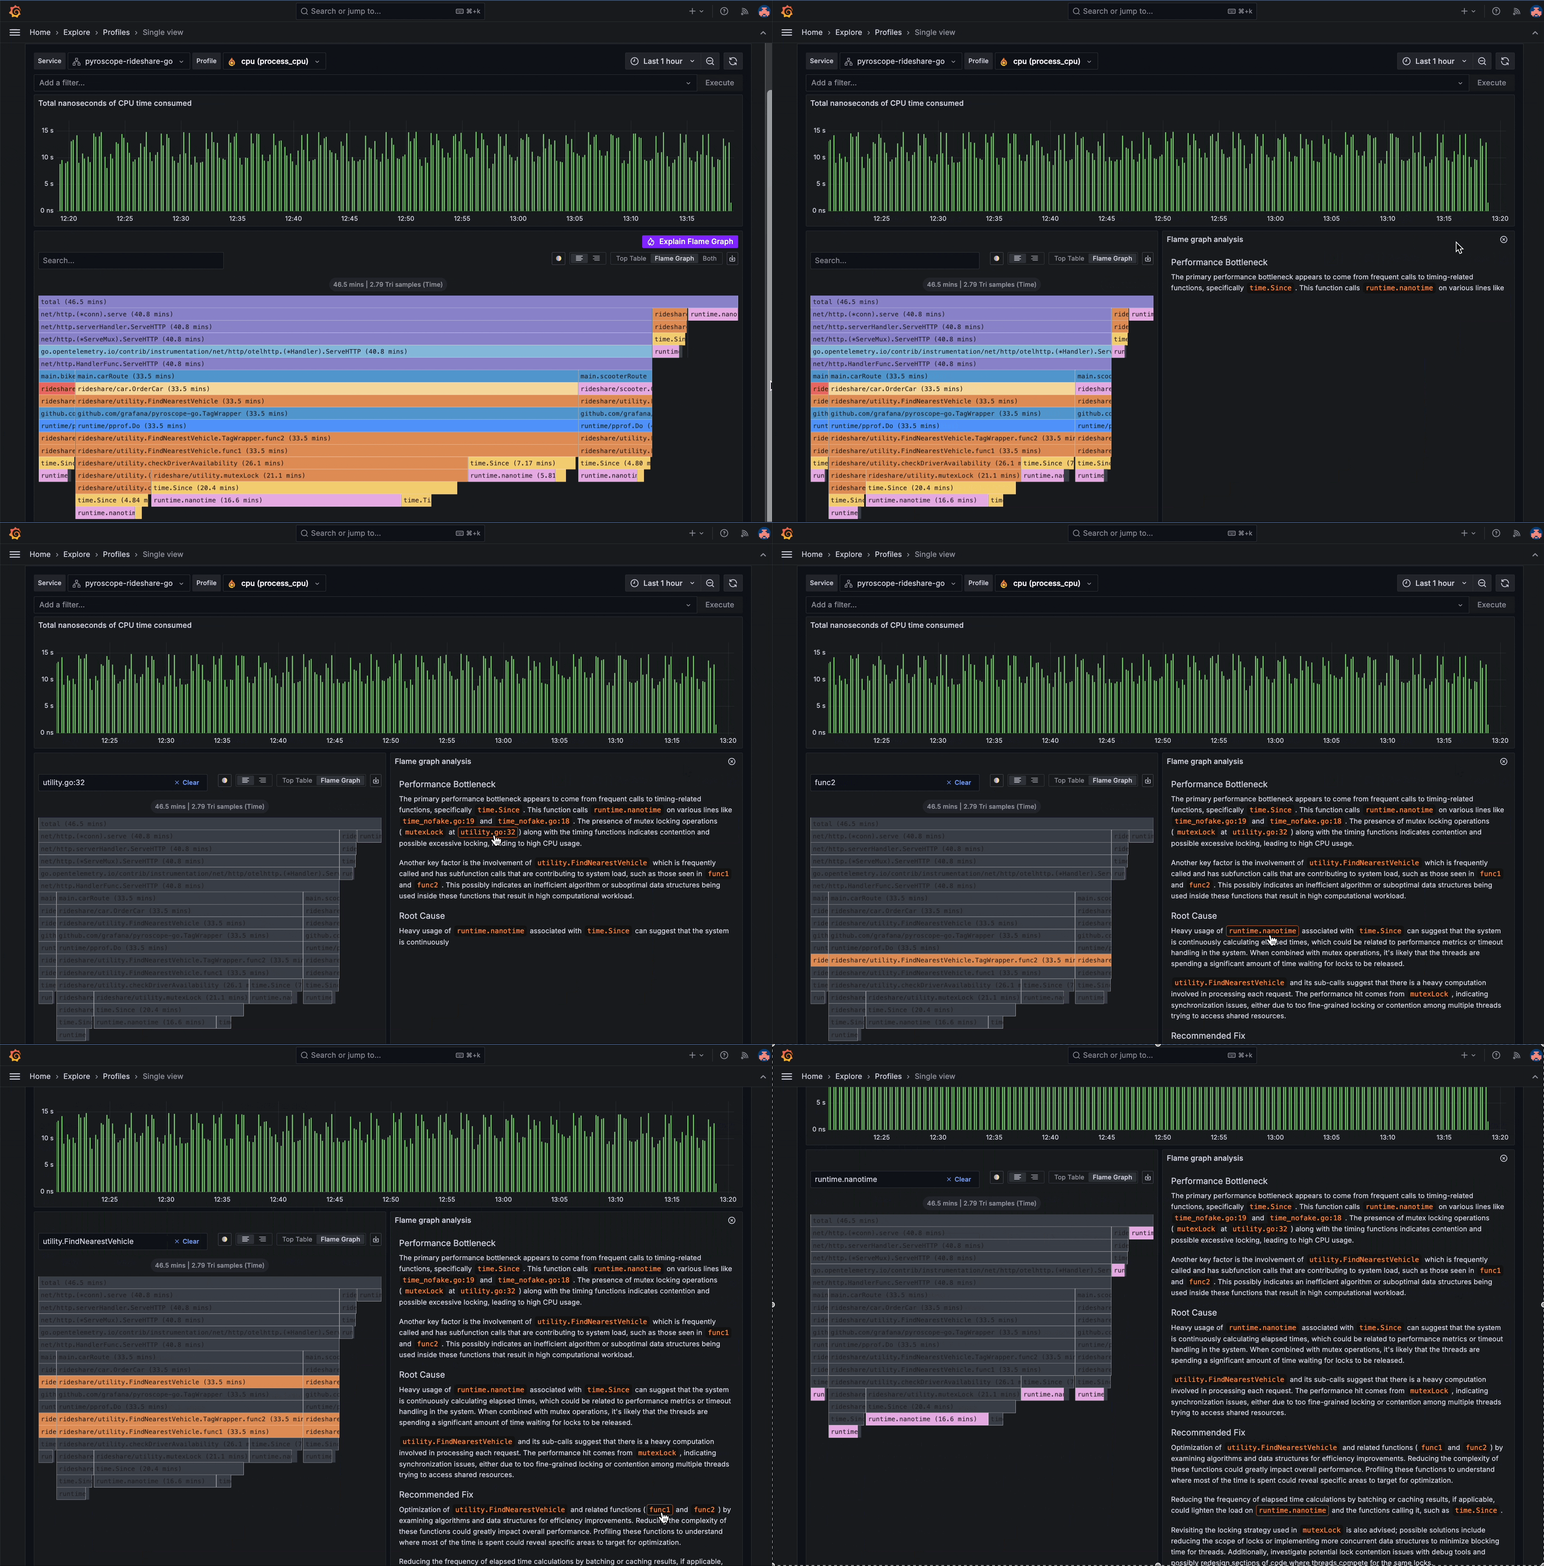
The LLM plugin is Grafana’s access point for GenAI features within Grafana. With the LLM plugin, you can do the following things:
- AI-powered flame graph interpretation
- Incident auto-summary
- Dashboard panel title and description generation
- Explanations of error log lines in Sift
We now support the usage of Anthropic’s API alongside already existing support for OpenAI’s API, OpenAI-compatible APIs and custom APIs.
The Infinity data source plugin now supports gzip compression for outgoing requests by default, improving data transfer efficiency and dashboard performance. This enhancement reduces payload size, helping users working with large datasets or real-time dashboards experience faster load times and lower network strain.
The Infinity data source plugin now defaults to the backend parser when creating new queries in dashboards or Explore. Previously, the frontend parser was the default, limiting access to backend features like alerts, recorded queries, and public dashboards.
The Infinity data source plugin now allows passing Grafana metadata—such as user ID and data source UID—to underlying APIs as headers or query parameters. This gives data source admins more control over how metadata is shared with external APIs.
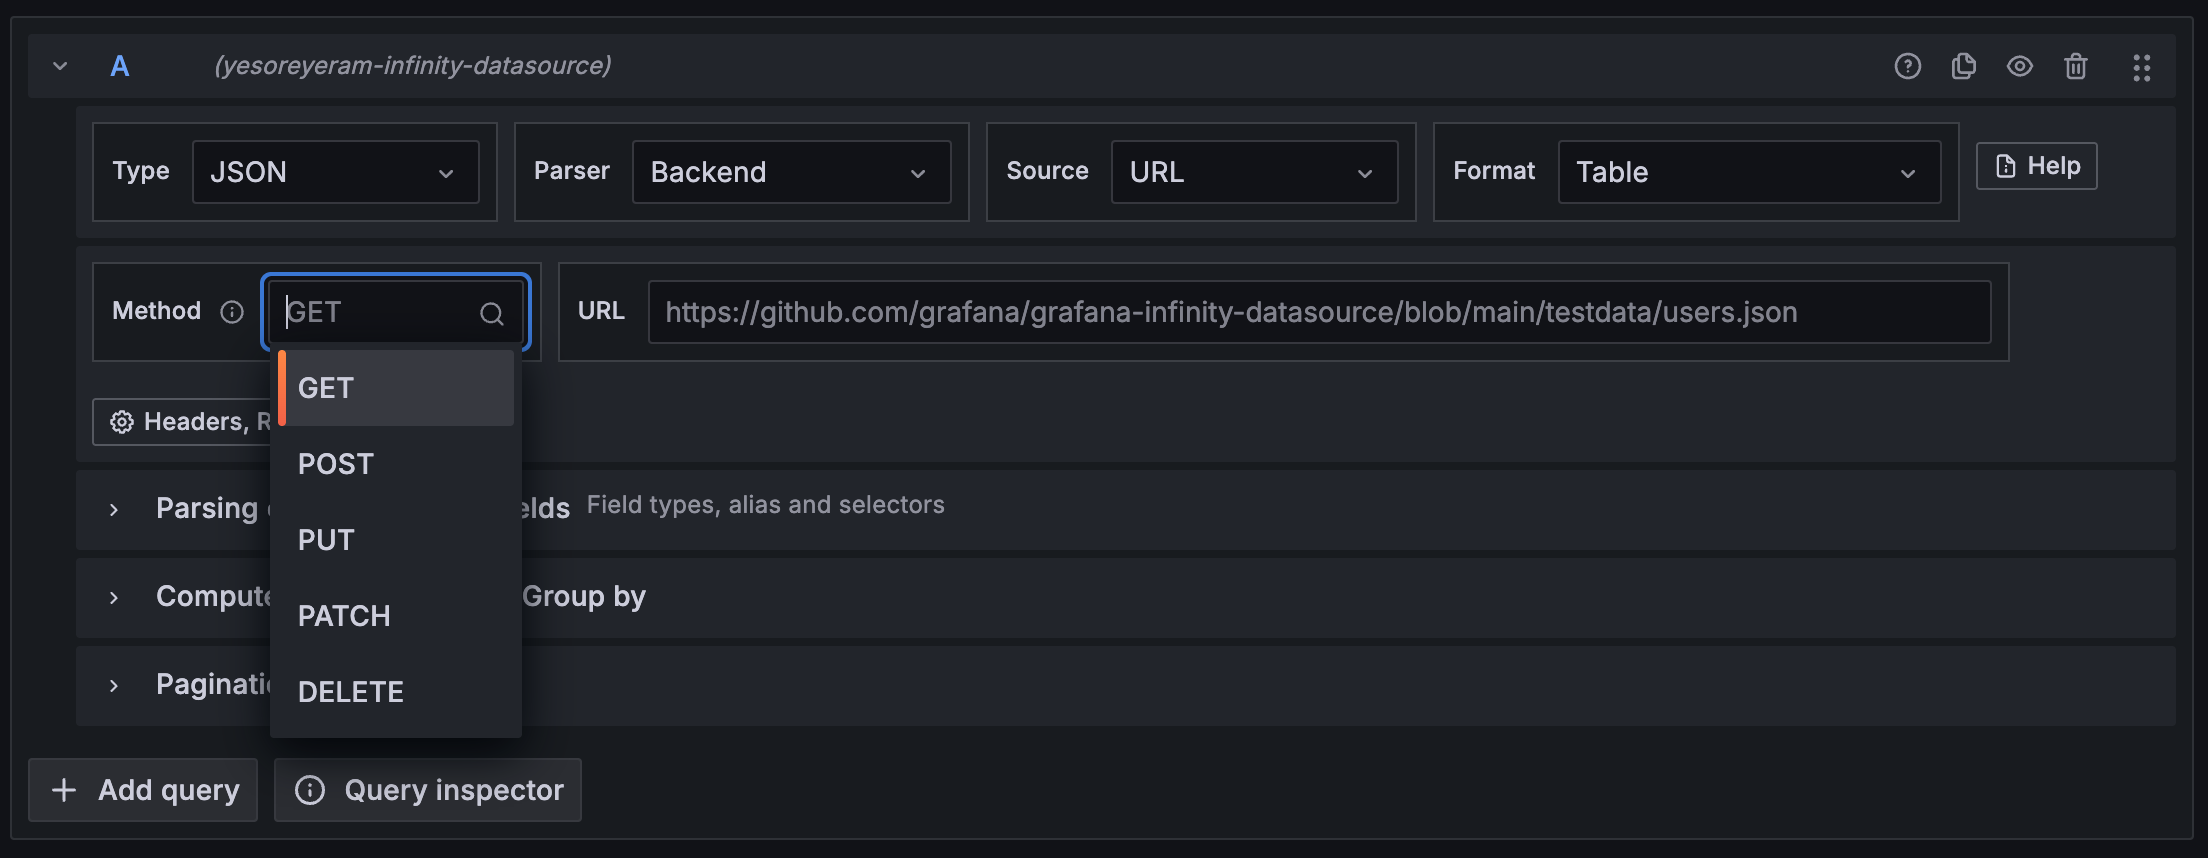
The Infinity data source plugin now supports additional HTTP methods—PATCH, PUT, and DELETE—through the allowDangerousHTTPMethods configuration. This improvement gives you greater flexibility when interacting with APIs that require these methods, making it easier to work with a wider range of use cases.
It’s easier than ever to stay on top of token rotation with these latest updates:
📩 Automated email reminders – Receive email notifications before a token expires, ensuring a seamless transition.
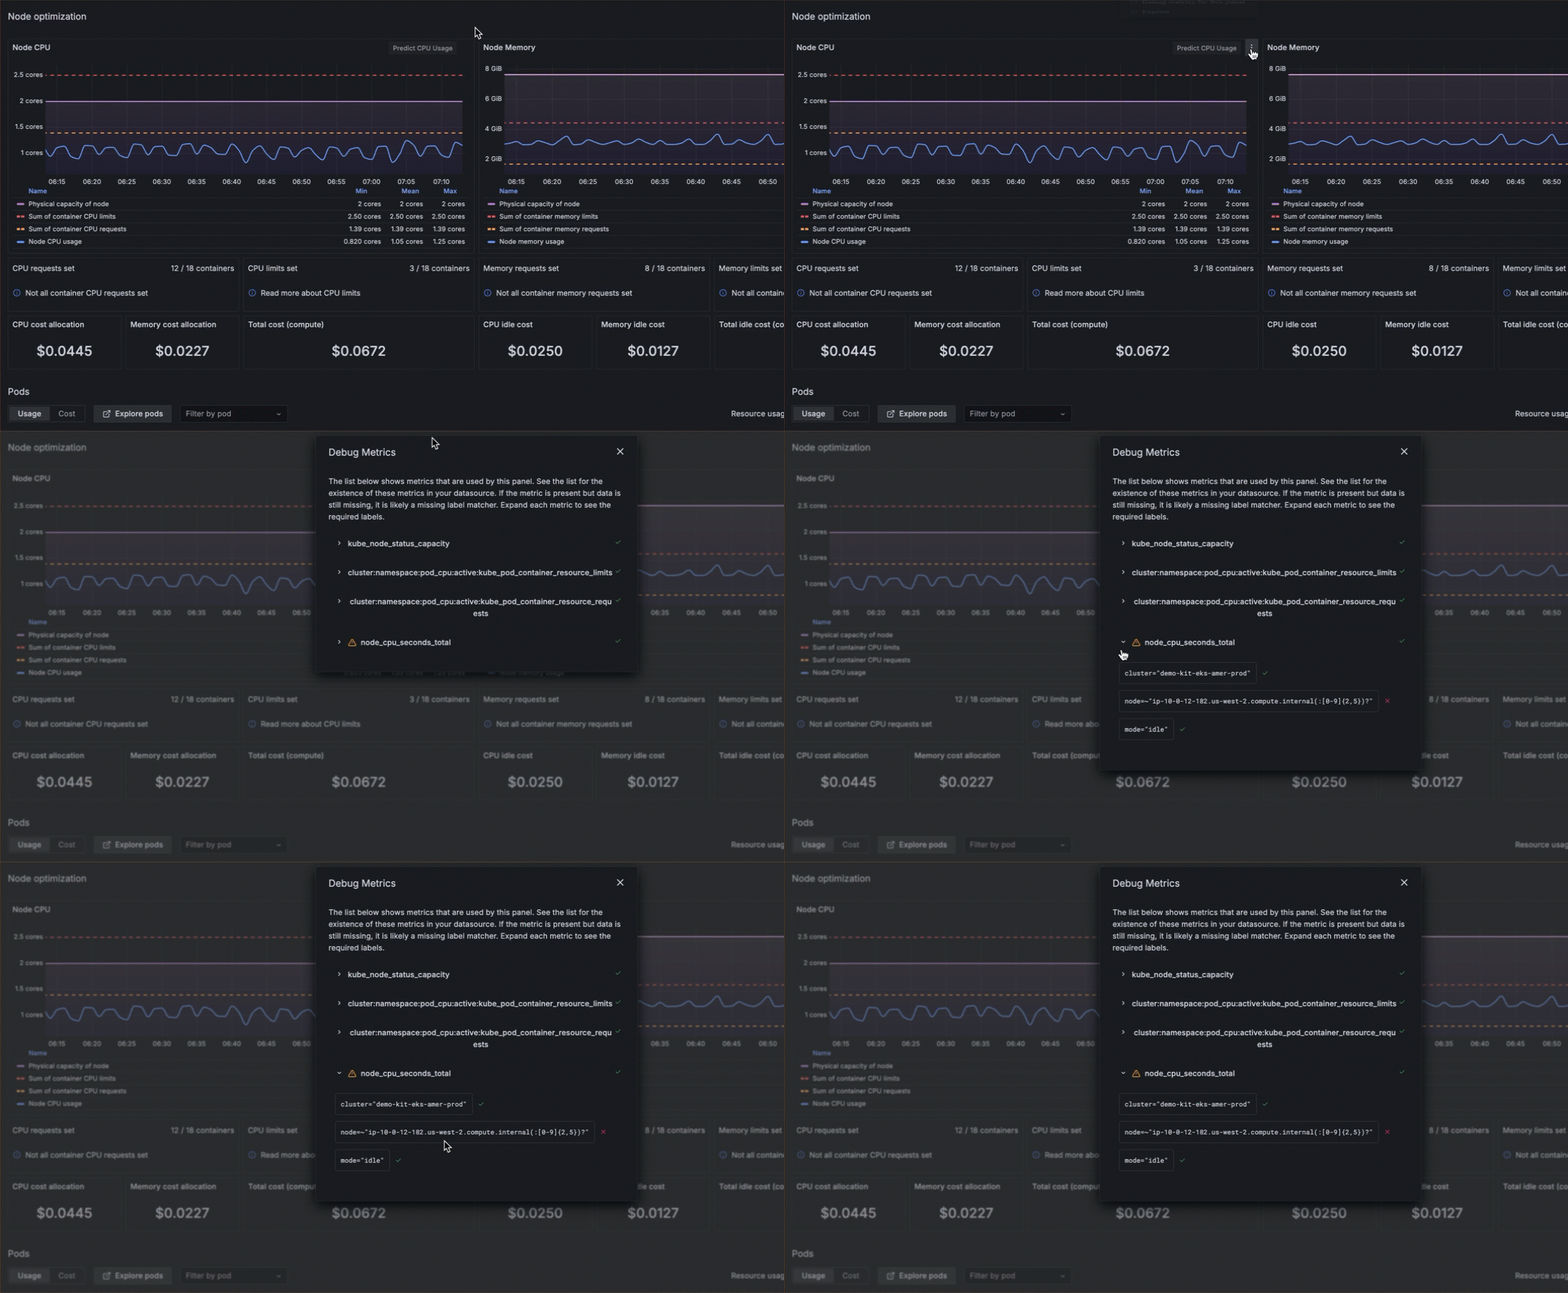
Get instant clarity when a panel isn’t showing any data or inaccurate data. Use Debug Metrics to learn if all the required metrics that power your panel are available and properly labeled.
Grafana Cloud now supports native cross-region connectivity using AWS PrivateLink.
Previously, AWS PrivateLink only supported connectivity to VPC endpoint services in the same region. Connecting to services in a different region required setting VPC Peering between both regions, and this was complicated in some environments.
Grafana OnCall and Grafana Incident are now unified into a single application: Grafana IRM. This update simplifies workflows, consolidates configurations, and provides a more integrated experience for managing on-call schedules, alert escalations, and incident response. Changes include:
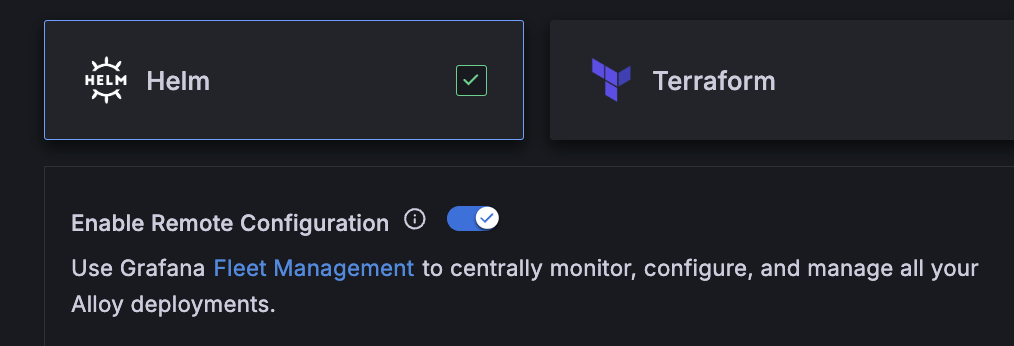
When you configure Kubernetes Monitoring, you can select Fleet Management for monitoring, configuring, and managing your Alloy deployments.
Additional buttons are available on any Cluster detail page for you to immediately access the namespaces and workloads on the Cluster.
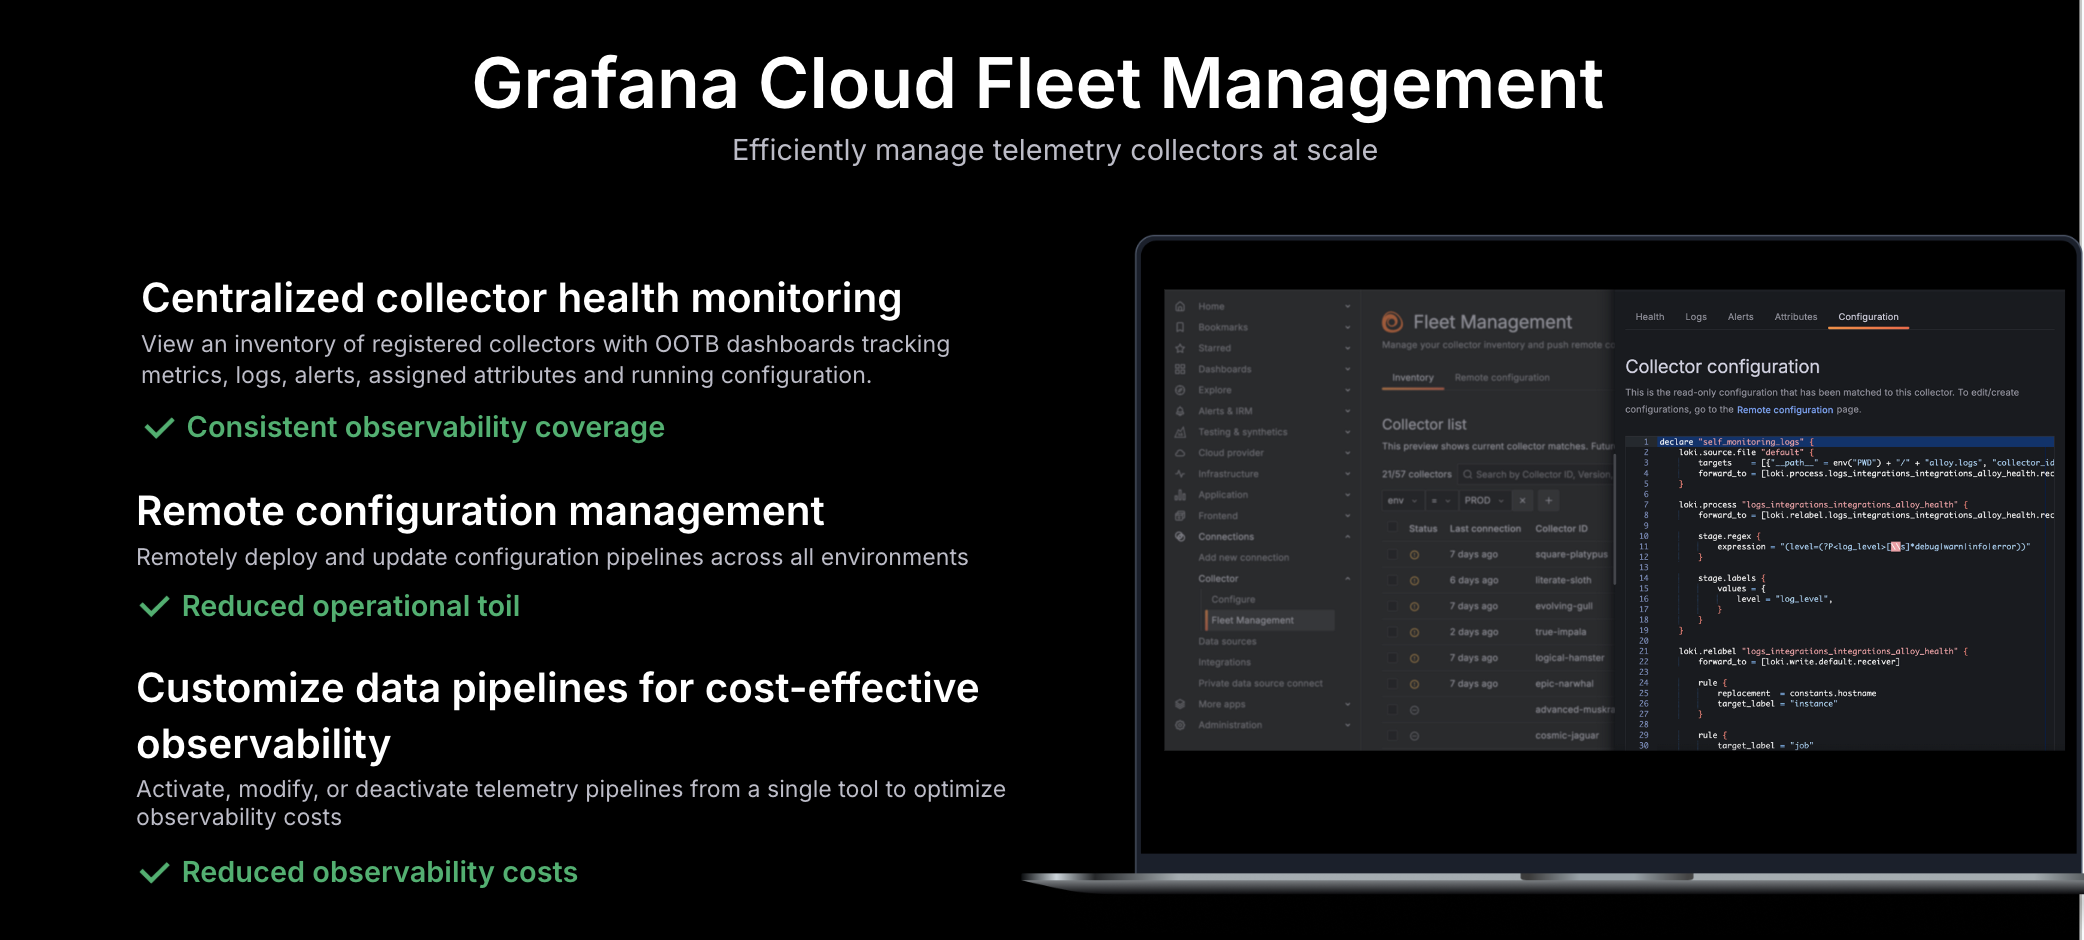
We’re excited to announce that Grafana Fleet Management is generally available! Since launching Fleet Management in public preview last November, we’ve been working to add more features to help you monitor and manage your collector fleets at scale. Here are some of these enhancements:
Standardized links for plugins to simplify user-developer interactions
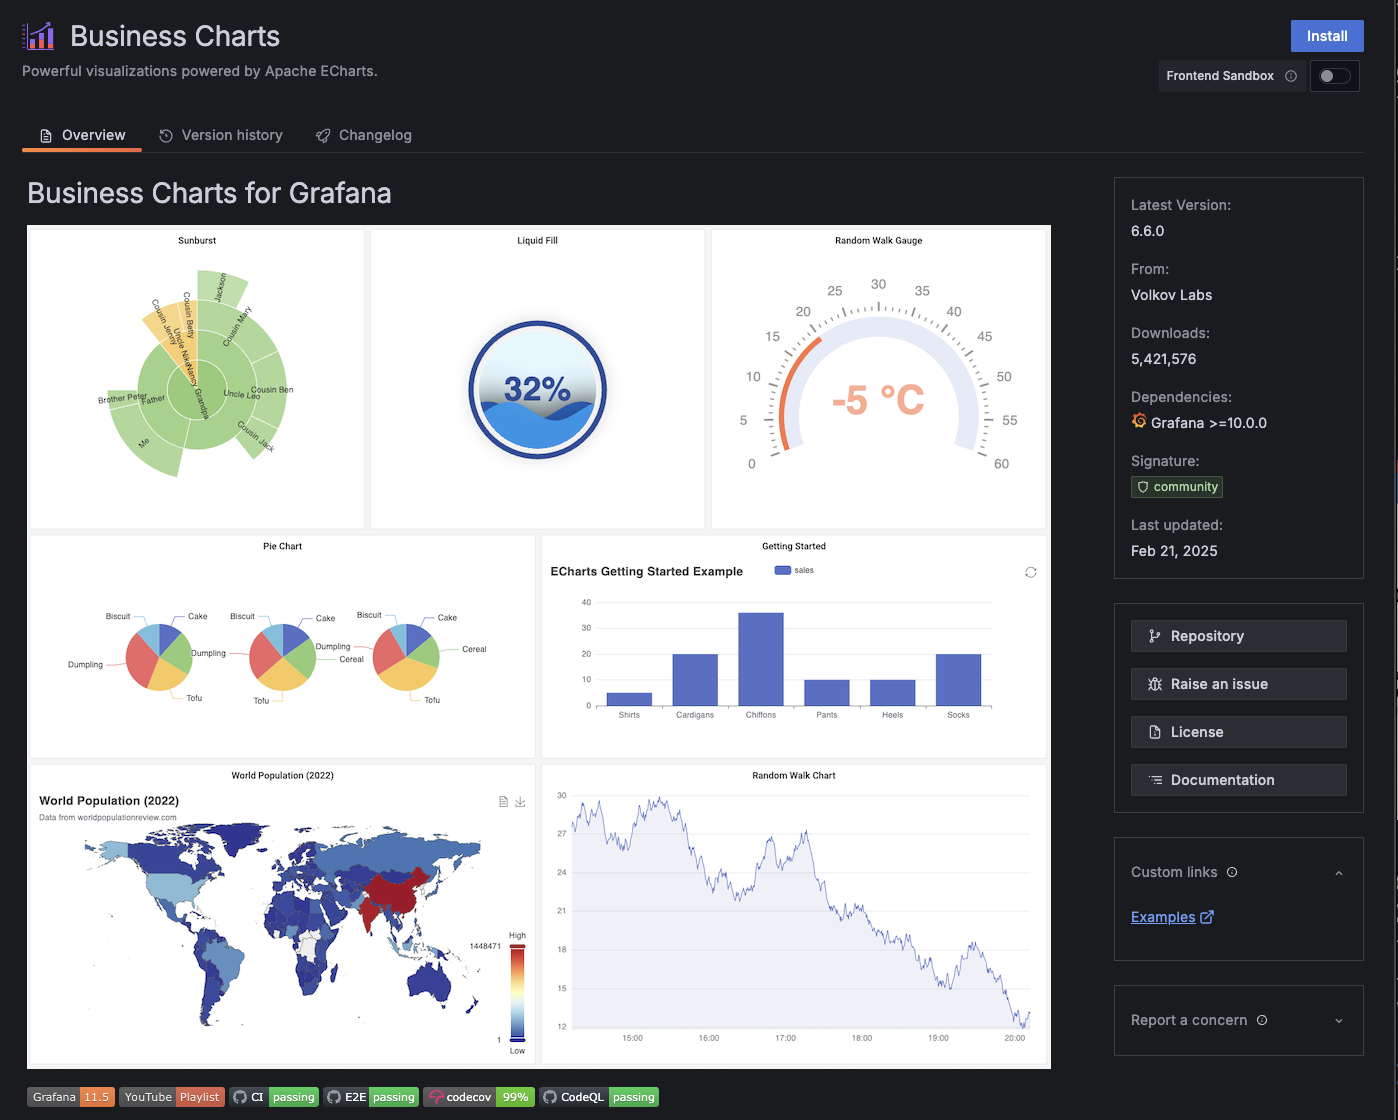
We’re pleased to announce an improvement to the Grafana plugin catalog that benefits both Grafana users and plugin developers. By introducing standardized links on plugin details pages, we’re making it easier for users to engage with developers, and find the essential information they need to get the most out of a plugin. Developers, in turn, will gain valuable feedback and support from their audience.
On March 10, 2025, we started rolling out a default list of resource attributes as labels on Grafana Cloud Metrics. The goal is to simplify data exploration and correlation for customers sending OpenTelemetry metrics. We expect the total rollout time to be a few weeks.
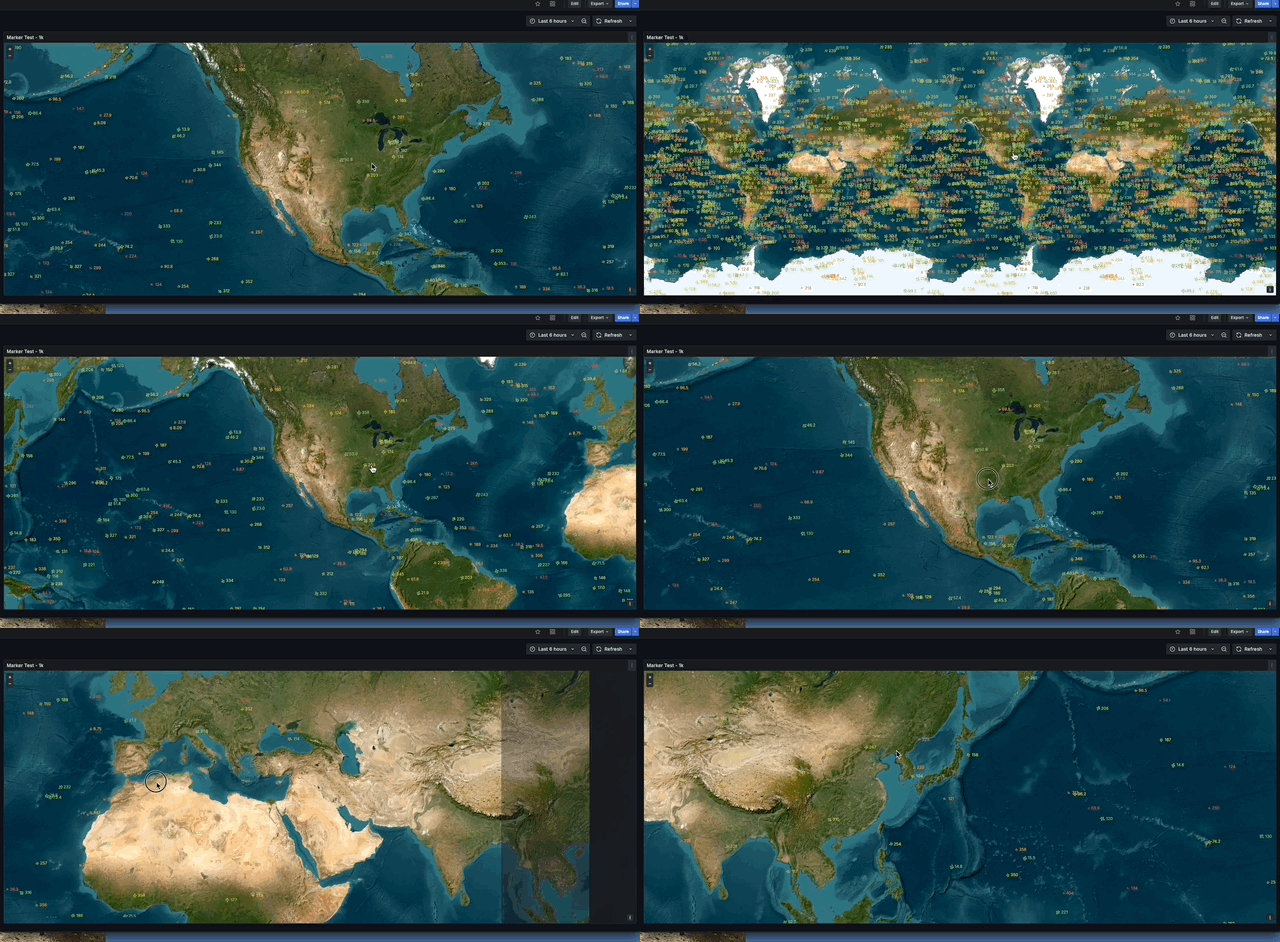
We’ve moved over to WebGL for geomap marker layers. You can expect a significant increase in performance and stability, which is especially noticeable for larger datasets.
The alert rule history
Alerting has added a new feature that allows you to review, compare, and restore previous alert rules.
You now can restore old rule versions from the versions tab in the detail view.