What's new from Grafana Labs
Grafana Labs products, projects, and features can go through multiple release stages before becoming generally available. These stages in the release life cycle can present varying degrees of stability and support. For more information, refer to release life cycle for Grafana Labs.
Loading...
Area of interest:
Cloud availability:
Cloud editions:
Self-managed availability:
Self-managed editions:
No results found. Please adjust your filters or search criteria.
There was an error with your request.
Save money and apply an extra layer of network security by using GCP Private Service Connect to send telemetry data to Grafana Cloud.
Normally when you send telemetry from your GCP network to Grafana Cloud, you incur in network egress fees and your data, though encrypted, traverses the public internet.
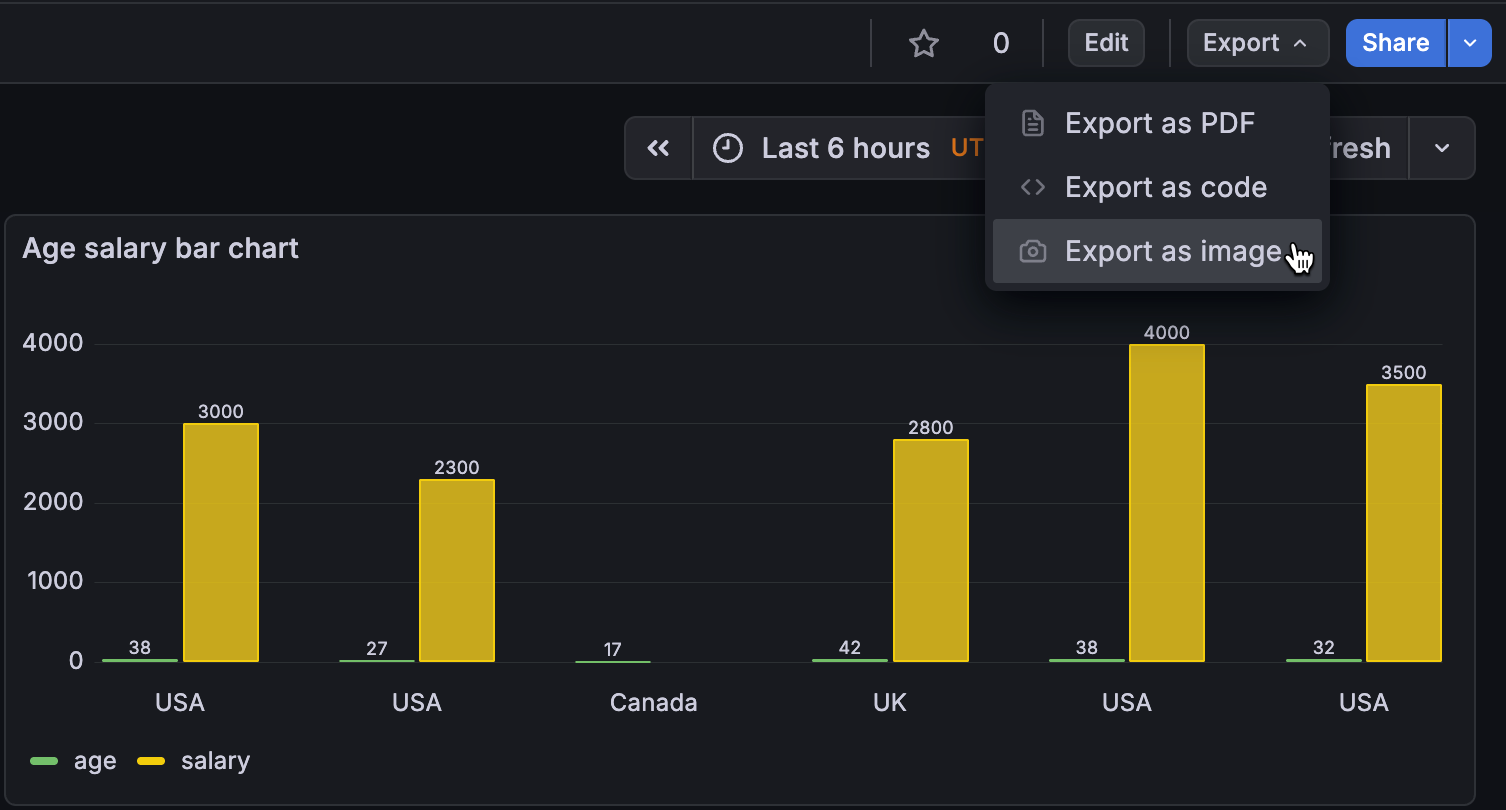
Sharing your Grafana dashboards just got easier. You can now export any dashboard as a PNG image.
Use the Export as image option to generate an image:
Grafana Team LBAC: Performance Considerations
What We’ve Improved
Storage Capacity
We previously had a limitation of about 500 LBAC rules per data source, which was challenging for some customers who needed more rules to meet their requirements. We’ve resolved this by expanding our storage capacity, allowing for significantly more rules to be stored.
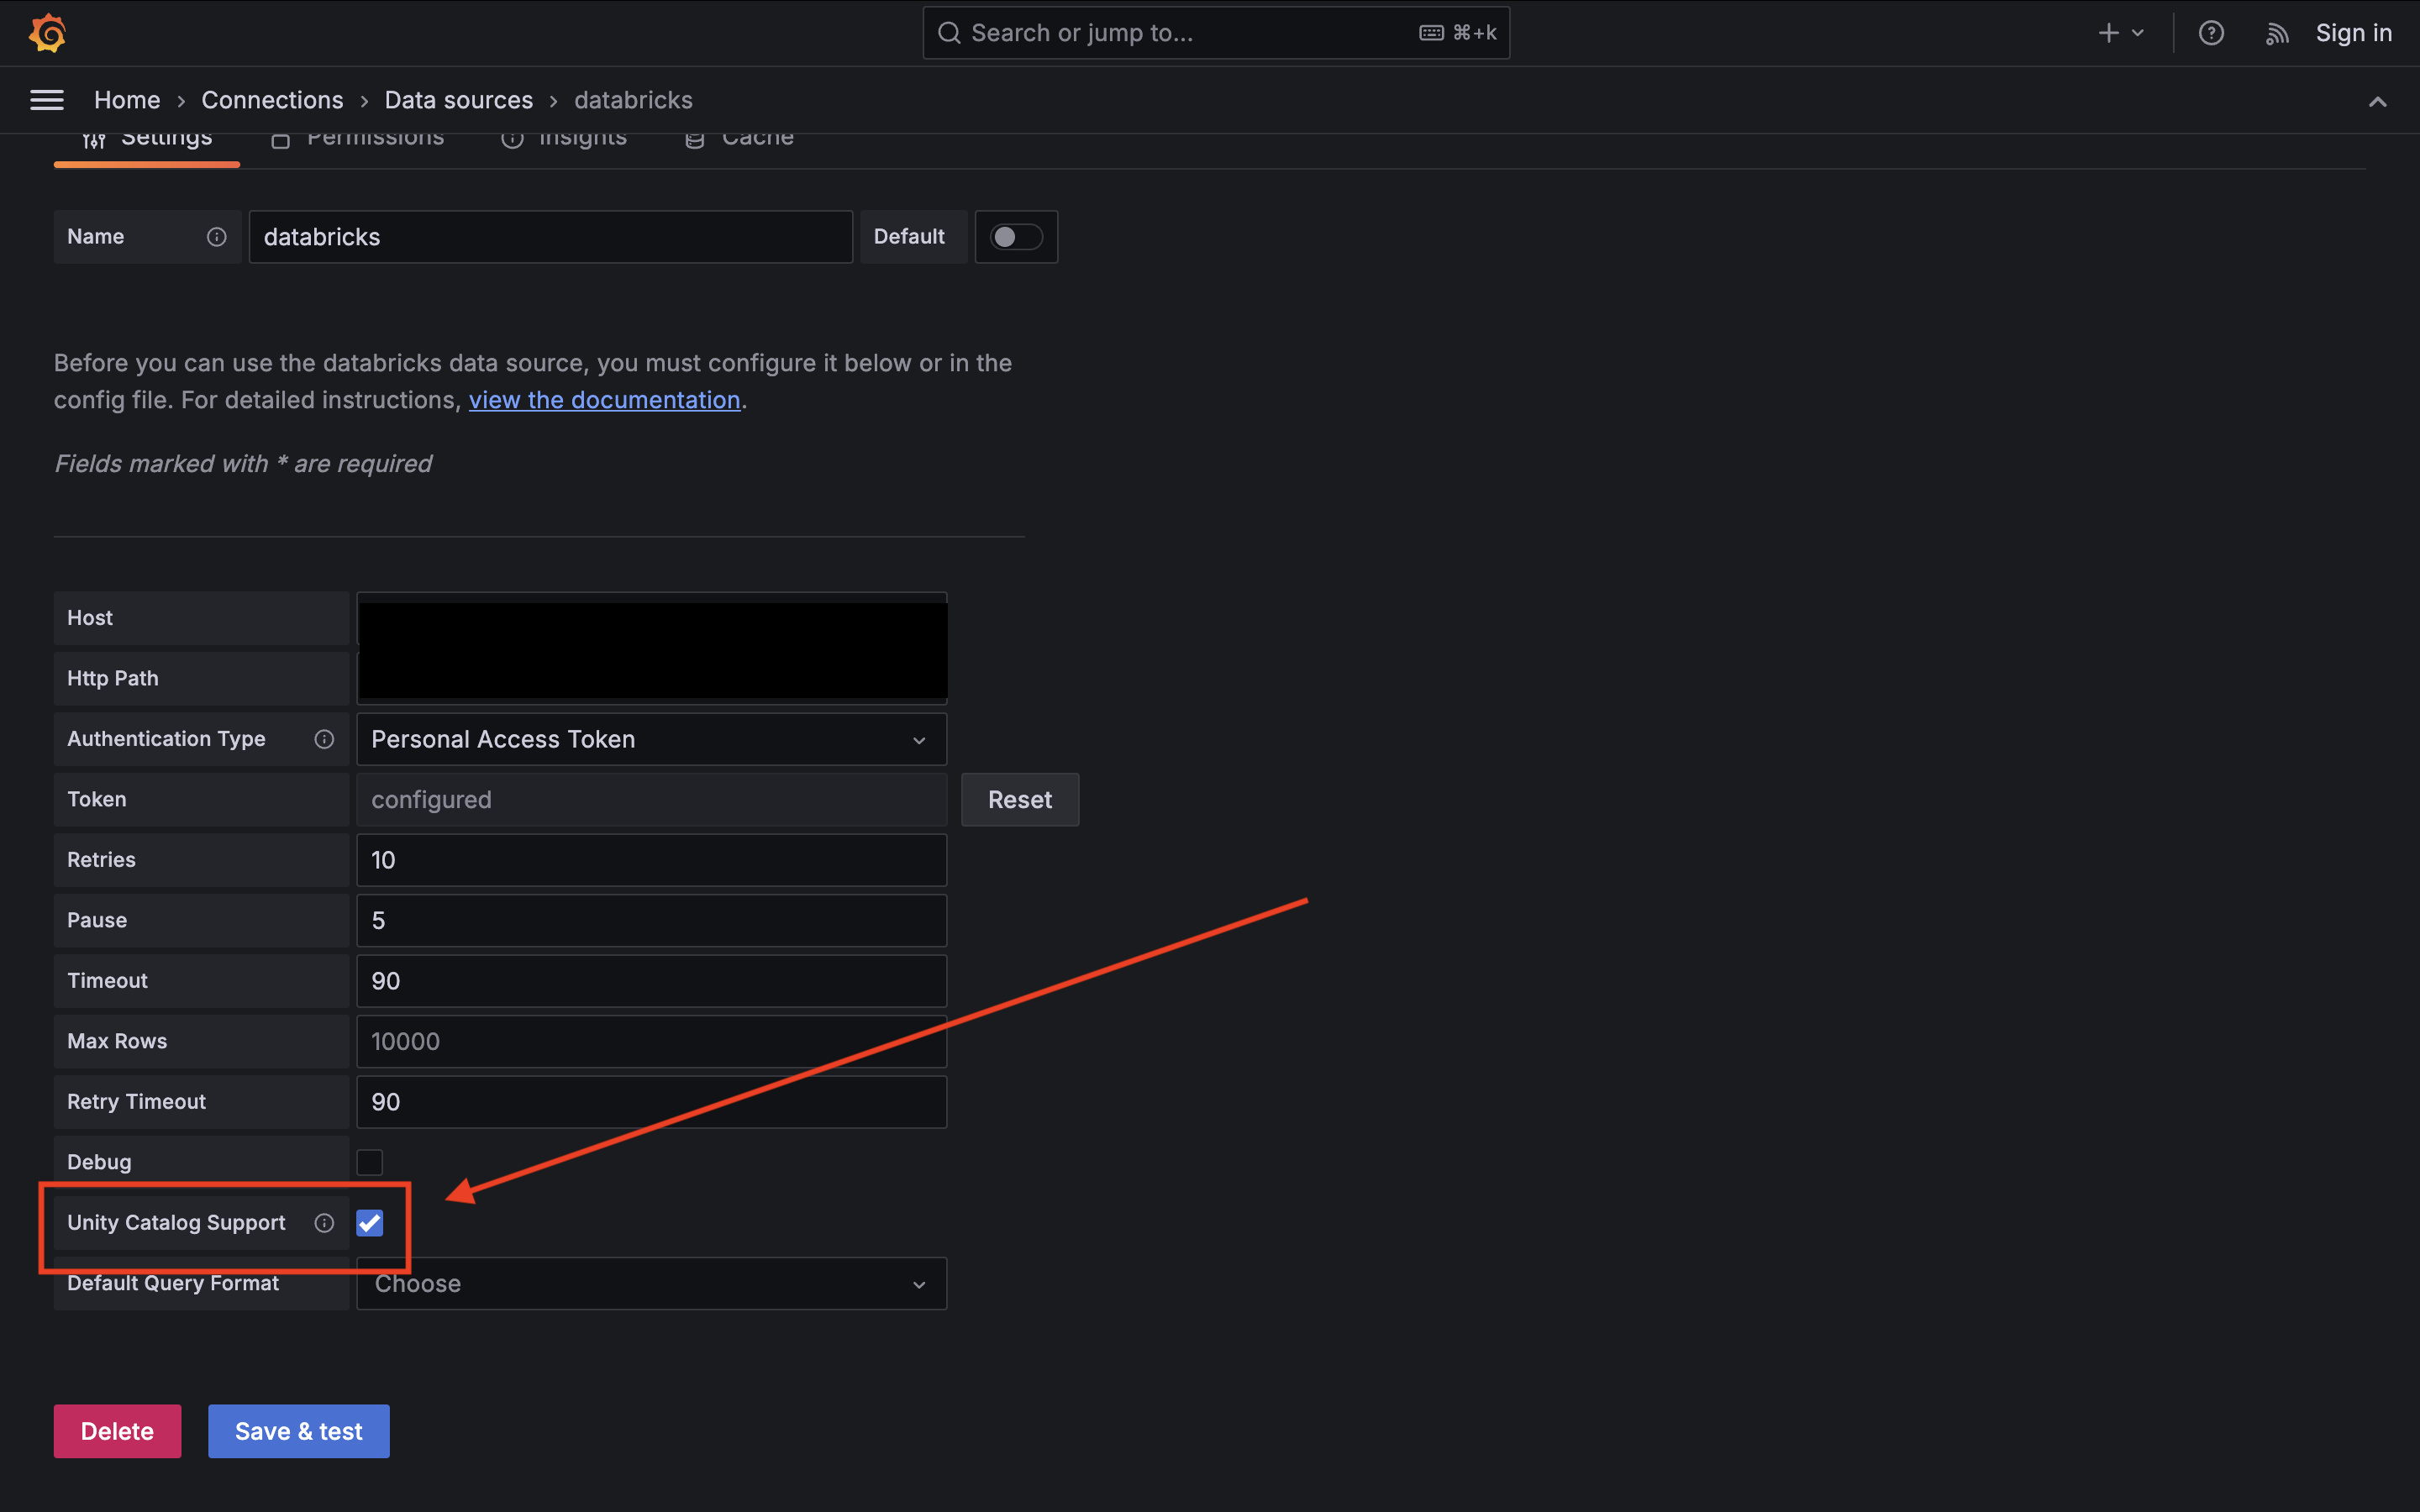
We’ve added support for Databricks Unity Catalog, enabling secure and consistent access to governed data directly within Grafana.
This enhancement allows users to easily query and visualize datasets registered in Unity Catalog while maintaining the same fine-grained permissions and lineage tracking defined in Databricks. With this integration, teams can build dashboards confidently knowing their data follows centralized governance, access control, and compliance standards across all workspaces.
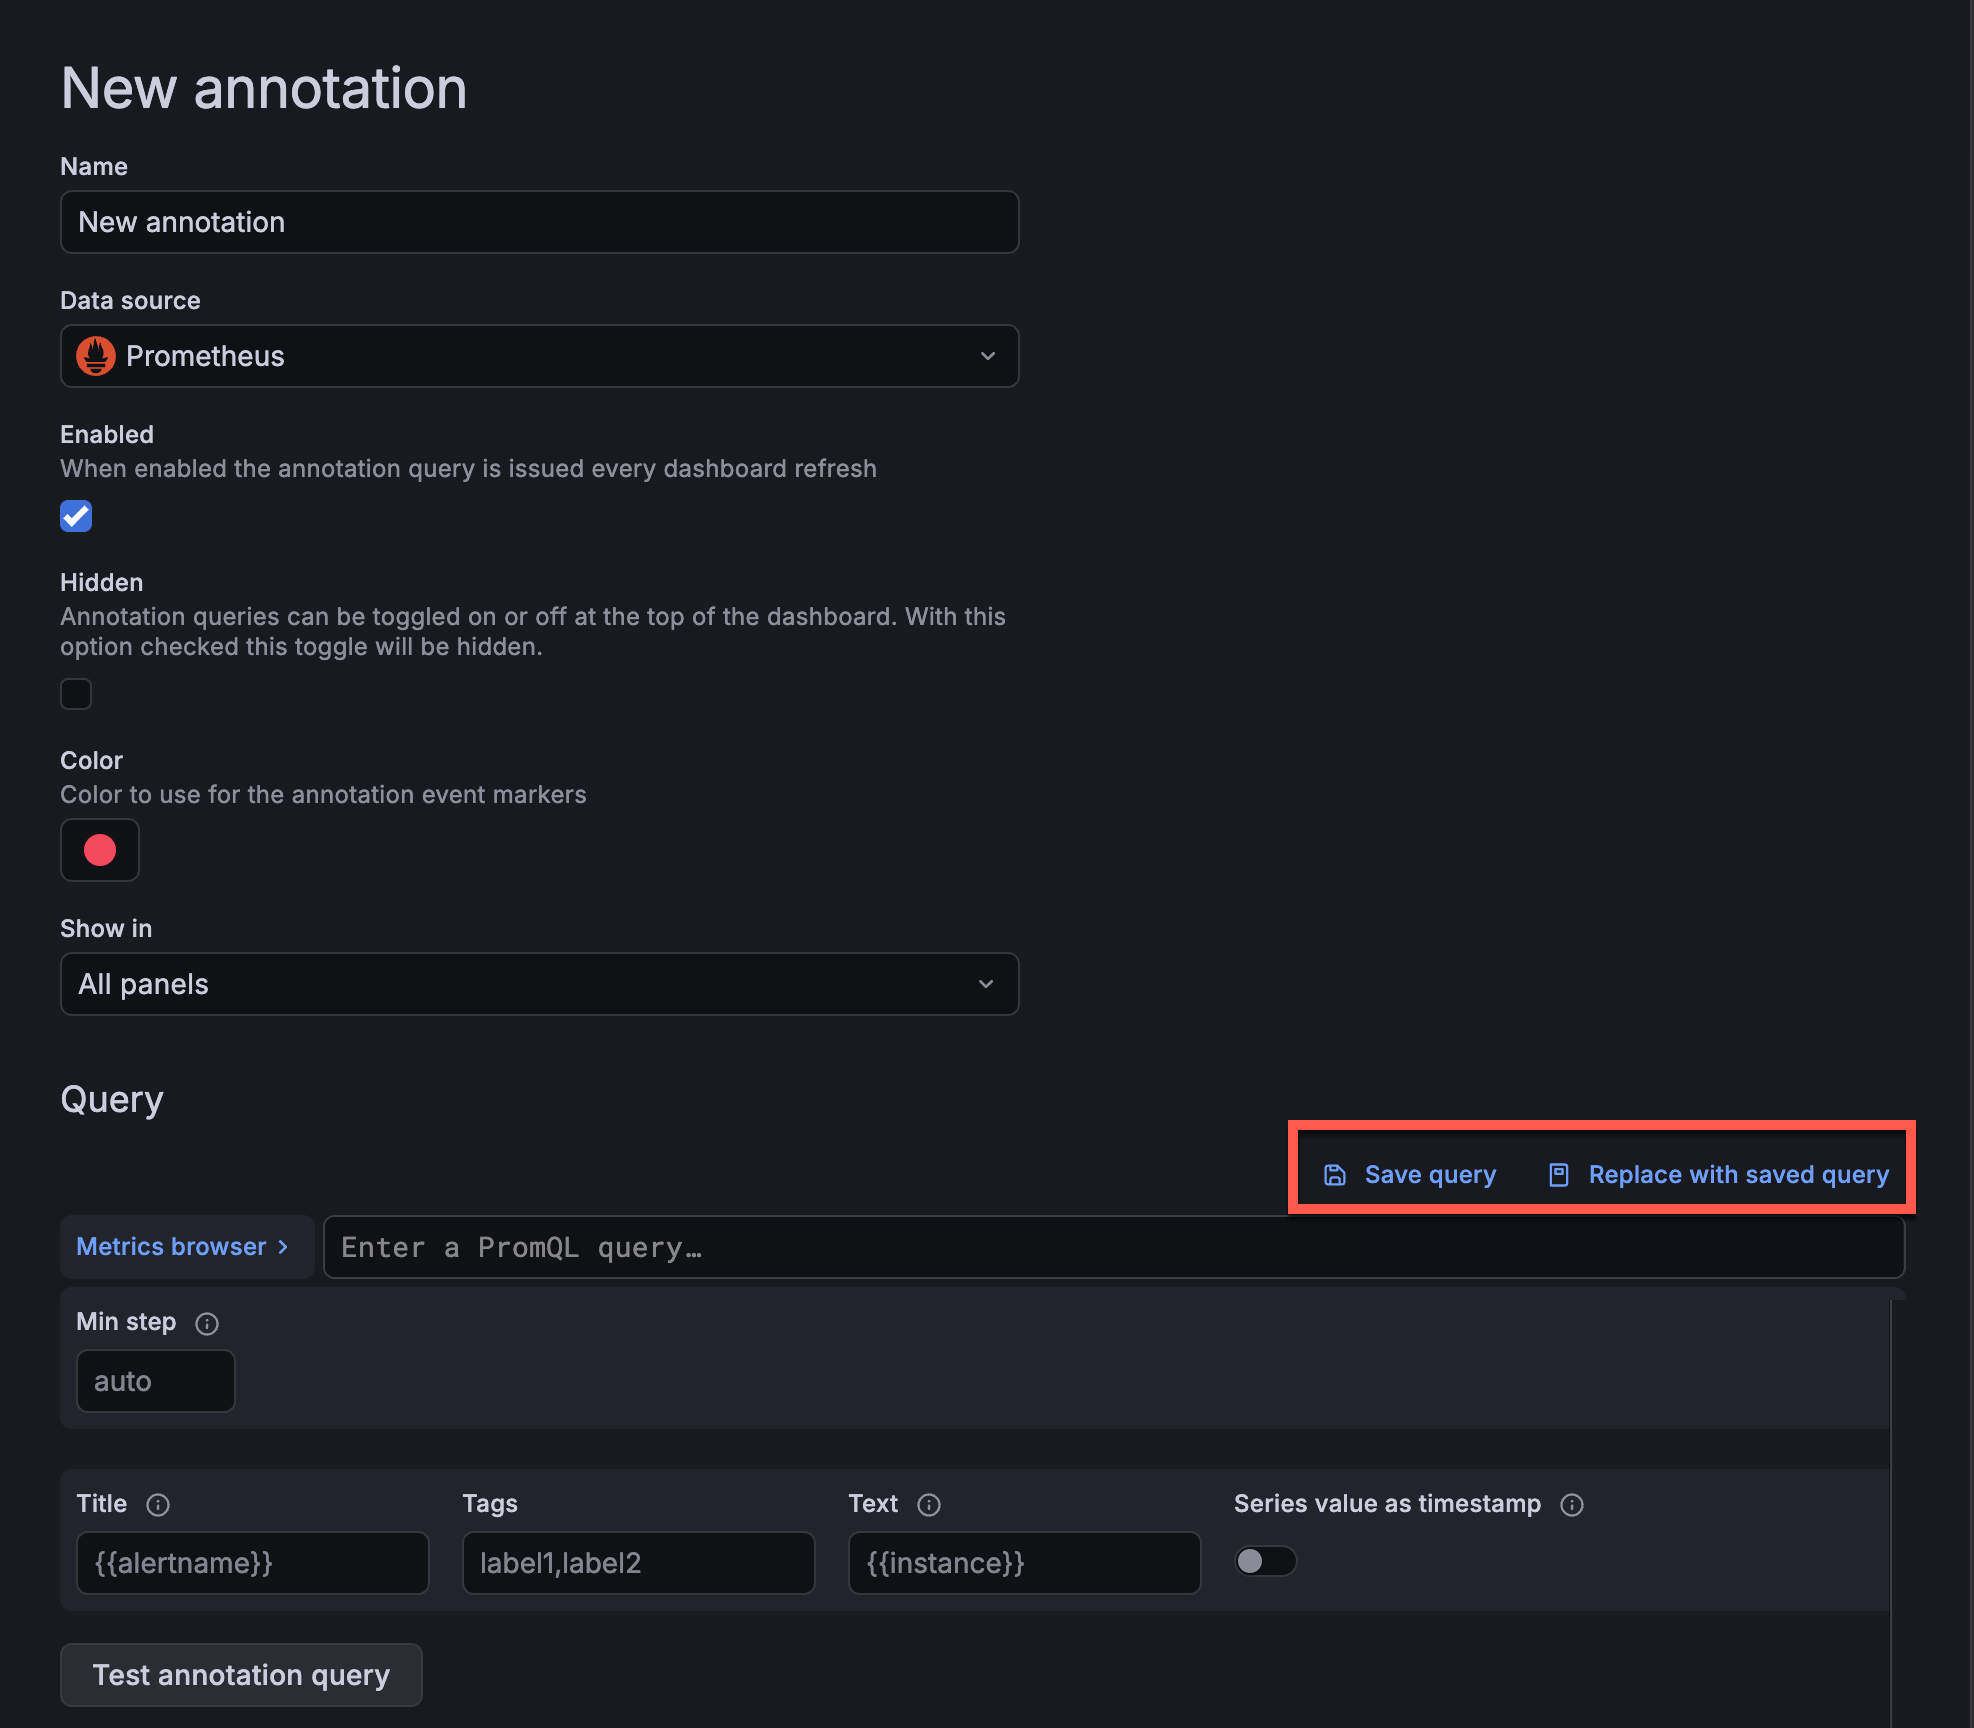
We recently introduced the ability to save queries in Dashboards and Explore—now we’ve extended this functionality to dashboard annotations. With this addition, you can save, reuse, and share annotation queries with others in your organization.
Introducing SolarWinds data source plugin.
SolarWinds is a network and infrastructure monitoring platform that provides tools to monitor, manage network performance, server health, and application availability.
This dedicated feature set found under the All jobs menu solves the long-standing challenge of monitoring distributed Kubernetes Jobs and CronJobs, transforming the process from reactive firefighting to proactive management.
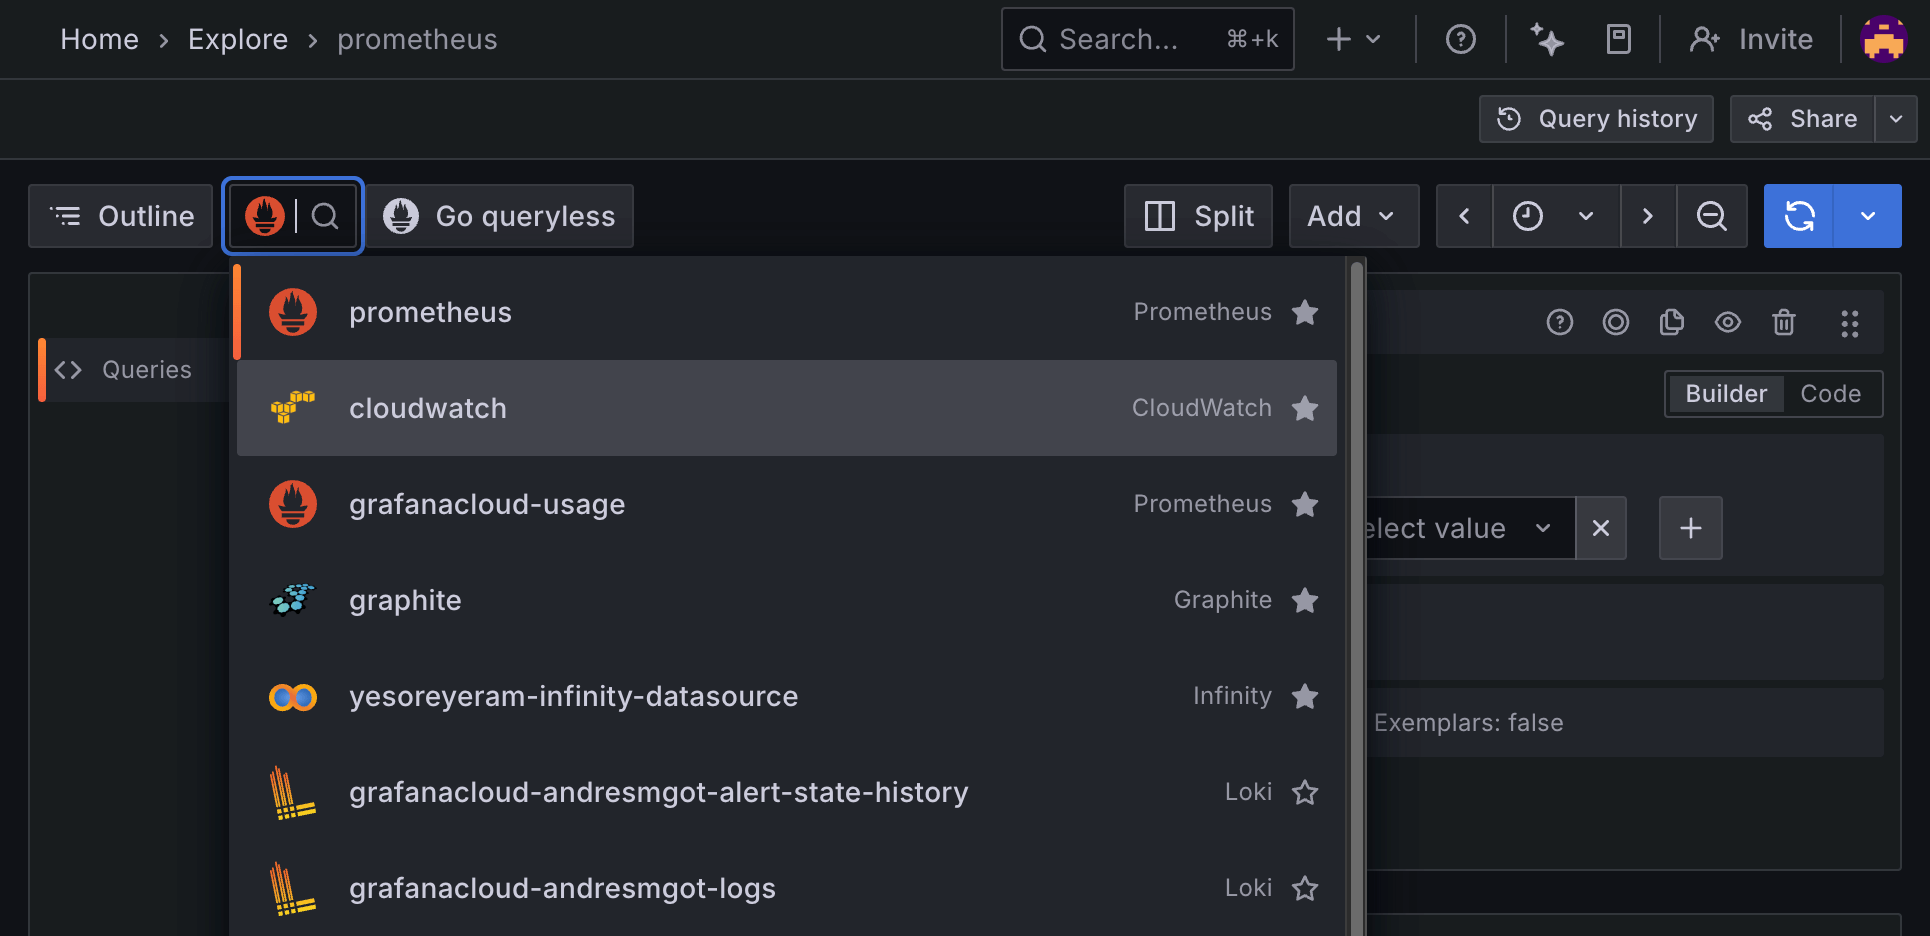
Finding the right data source among dozens of similar options wastes precious time and disrupts your workflow. As Grafana instances grow, data source discovery becomes increasingly frustrating. Favorite data sources solves this with a simple star icon ⭐️ which is available in the data source picker and when editing a data source.
Following up the completely redesigned logs panel, we’ve rebuilt log context around it, improving existing features and enabling new capabilities.
Log context is a feature that displays additional lines of logs surrounding a log entry that matches a specific search query. This helps in understanding the context of the log entry, analog to the -C parameter in the grep command.
Provisioning now enforces a full-replace model for resource permissions.
When a permission is applied through provisioning, all previously configured permissions on that resource are removed, except for the default role: Admin (admin).
Grafana now only gives users automatic Admin access when they create a dashboard or folder at the root level.
If a user creates a dashboard or folder inside another folder, Grafana will not add a direct Admin permission for that user on the new resource. Instead, access should come from the permissions on the containing folder.
You can now easily configure SAML authentication for Grafana using our newly approved Okta Integration Network (OIN) application. This integration streamlines setup for Okta admins, removing the need for manual configuration or custom metadata uploads.
Adaptive Metrics now supports Mimir native histograms. You can now receive aggregation recommendations and create aggregation rules for native histograms, allowing you to bring the familiar benefits of Adaptive Telemetry to native histograms in Grafana Cloud.
We’ve enhanced the Fleet Management Pipeline API with a SyncPipelinesRequest endpoint. You can now make a call that edits multiple pipelines from a common source in a single atomic operation.
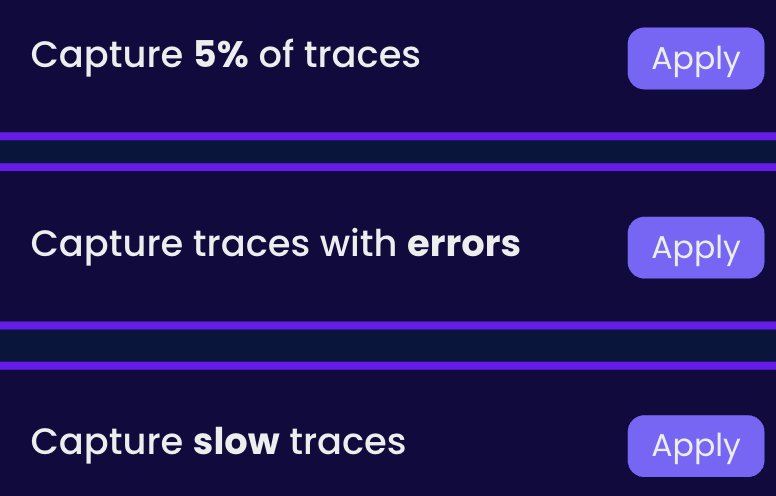
Adaptive Traces helps make sure you only store your valuable traces. With managed tail sampling, you can easily retain only the traces that matter to you without needing to run sampling infrastructure yourself. Our intelligent sampling capabilities identify anomalies in your services, then ingest and surface the relevant traces to help you troubleshoot faster.