What's new from Grafana Labs
Grafana Labs products, projects, and features can go through multiple release stages before becoming generally available. These stages in the release life cycle can present varying degrees of stability and support. For more information, refer to release life cycle for Grafana Labs.


Loading...
Area of interest:
Cloud availability:
Cloud editions:
Self-managed availability:
Self-managed editions:
No results found. Please adjust your filters or search criteria.
There was an error with your request.
Diagnose slow queries faster with the new Grafana Assistant integration for Database Observability. Instead of manually correlating metrics, wait events, and execution plans, click a button to get a diagnosis grounded in your live Prometheus and Loki data — including specific fix recommendations like index changes or query rewrites tailored to your actual schema and database engine.
New Grafana Cloud stacks now use Grafana-Managed Alerting (GMA) by default — Datasource-Managed Alerting (DMA) is no longer provisioned in new stacks.
Scope: New stacks only. Existing stacks and existing DMA rules are unaffected. This is a provisioning-time change, not a migration.
You can now explore usage and cost data at both the organization and individual stack levels directly within the Cost Management and Billing app!
Key features include:
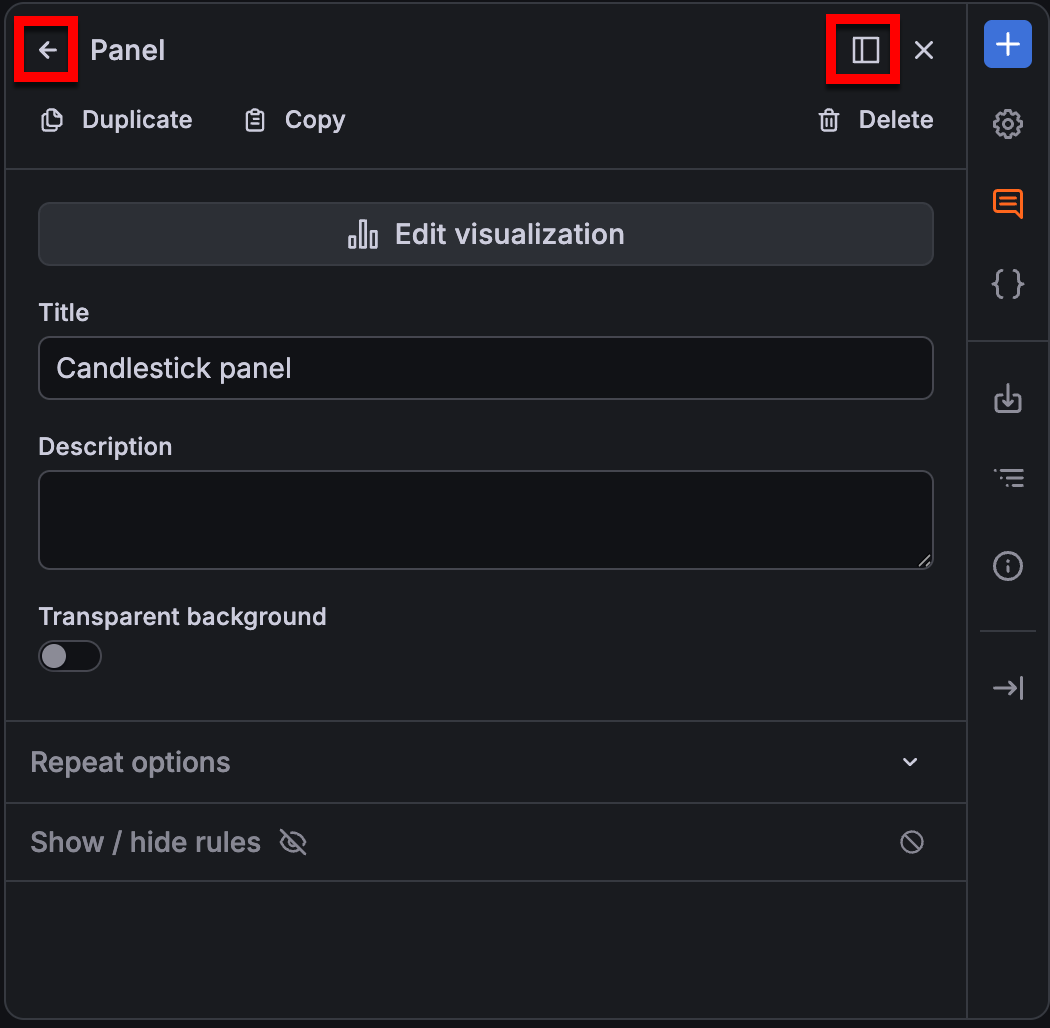
With the new dashboarding experience now generally available, we’ve introduced a series of UI enhancements that make dashboard creation and editing more discoverable, consistent, and easier to navigate.
Grafana 13 tightens RBAC enforcement for custom roles, Terraform-managed roles, and role provisioning. Most users aren’t affected. If you maintain custom RBAC roles, especially roles with data source permissions scoped to specific UIDs, or roles using legacy annotation scopes, review your role definitions now to prevent errors.
The Time series to table transformation is now generally available. Convert time series query results into table rows containing a trend field, then display them as sparklines with the sparkline cell type—useful for building compact at-a-glance overviews across many series.
Adaptive Traces can now normalize span names to follow OpenTelemetry semantic conventions during ingestion, collapsing high-cardinality names like /api/users/7f3a into stable forms like GET /api/users/{id}. Span metrics aggregate under stable route names, dashboards show meaningful operations, and TraceQL queries match consistently across services regardless of how each team labeled its spans. The original name is preserved as grafana.original_span_name so you can still drill down to a specific request.
The Grafana Cloud app for Slack now supports a more complete incident response workflow, making it easier to declare, manage, and resolve incidents directly in Slack.
Watch the following demo video to see the improved experience in action:
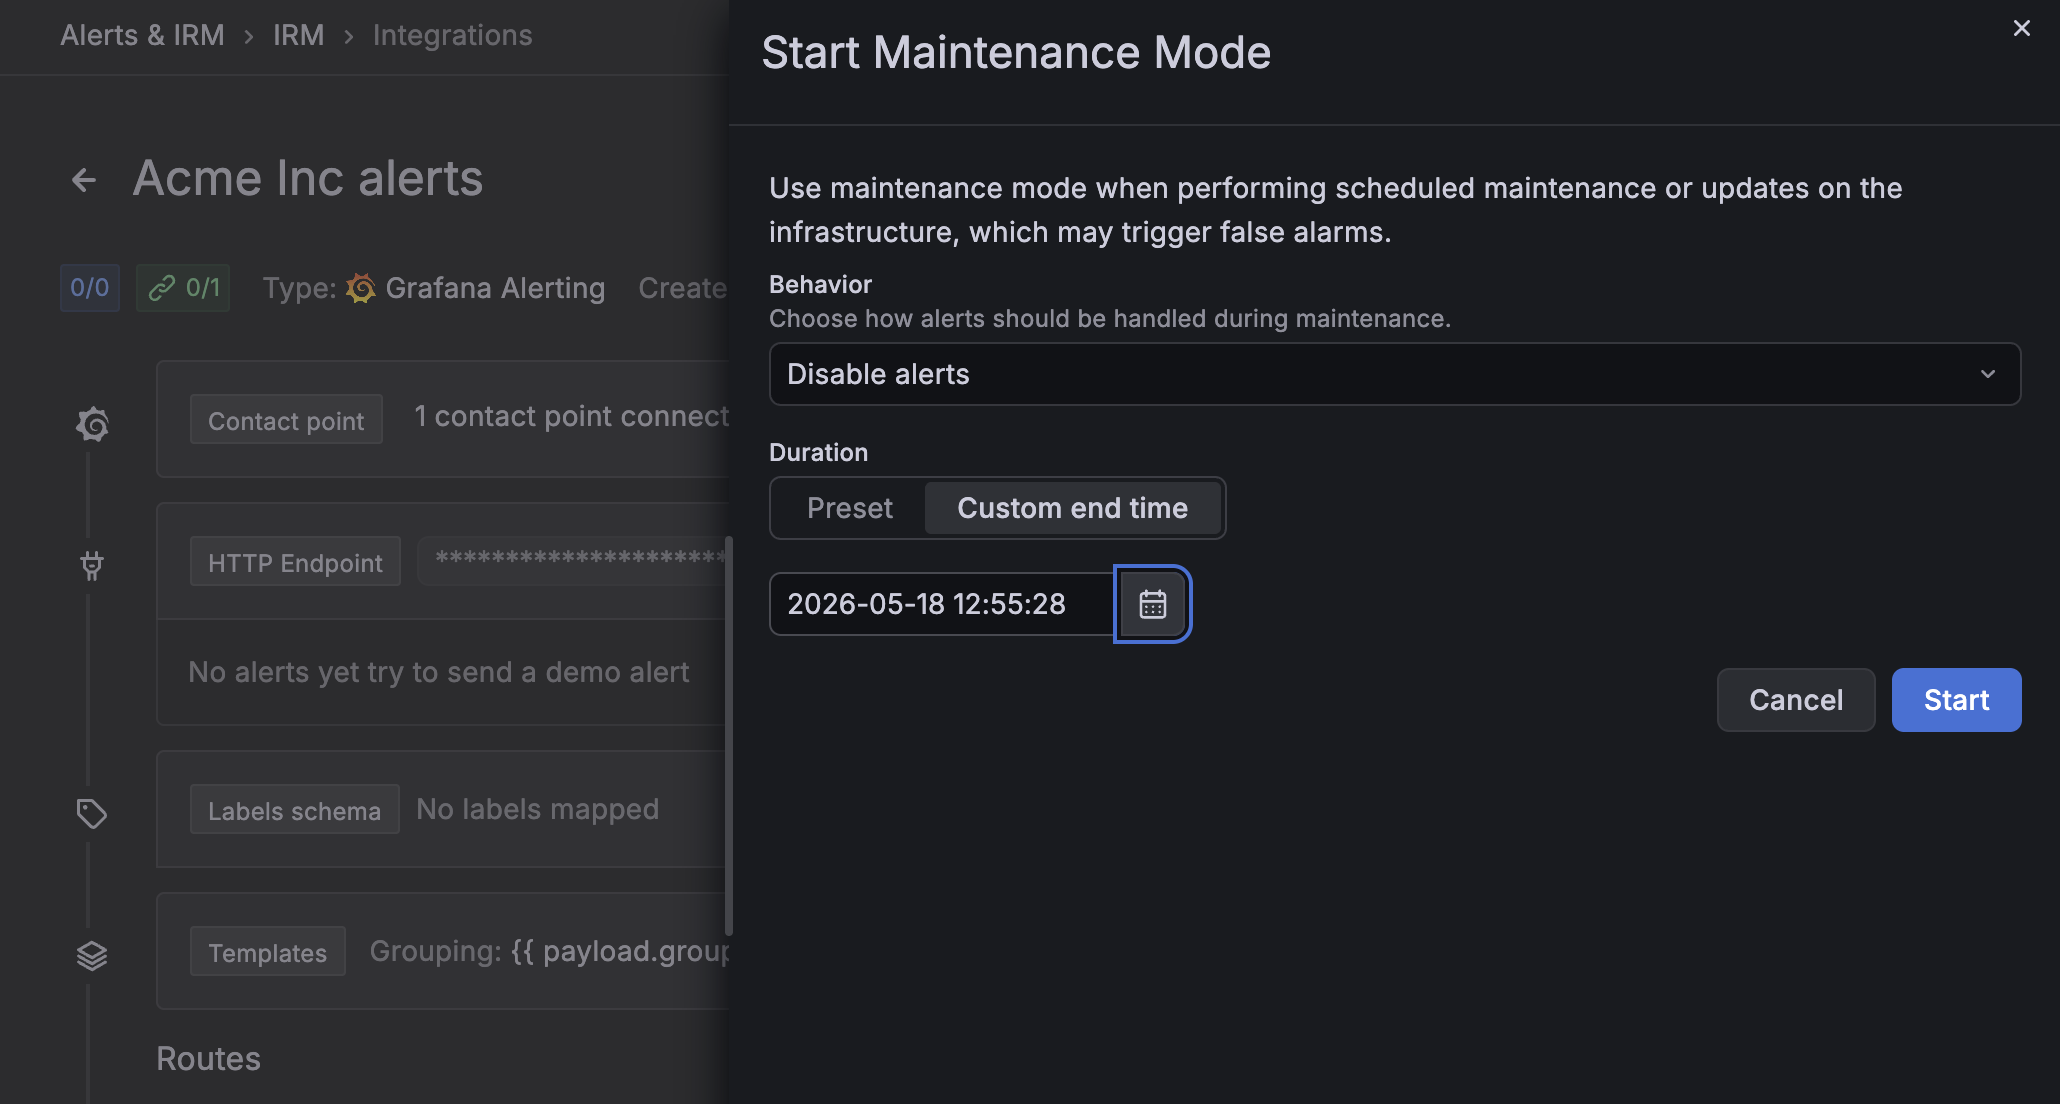
Maintenance mode in Grafana IRM now gives you finer control during planned work, with three alert behaviors and any custom end time you need.
When you enable Maintenance mode on an integration, choose how IRM handles incoming alerts:
- Silence escalations. Alerts stay visible in IRM, but escalation chains pause. Useful when you’re testing templates or troubleshooting an integration.
- Group alerts. IRM collects every incoming alert into a single maintenance alert group instead of paging individually. Useful for planned windows when you expect a burst of alerts from the same root cause.
- Disable alerts (new). IRM drops incoming alerts at ingestion. Useful for major infrastructure changes where the noise isn’t actionable.
Alongside the existing presets (1, 3, 6, 12, or 24 hours), you can now set any custom end time, so you can cover multi-day migrations and deploy-aligned windows.
Keep every service represented in your traces, even when a few noisy ones produce most of your traffic. Volumetric sampling automatically distributes your sampling budget across services and request types, so low-volume services aren’t crowded out — and you can often lower sampling_percentage while keeping coverage intact. Learn more in the docs →
We’ve added a Grafana Alloy component editor to Grafana Fleet Management! Now you can build and update Alloy configuration pipelines without writing a single line of Alloy syntax.
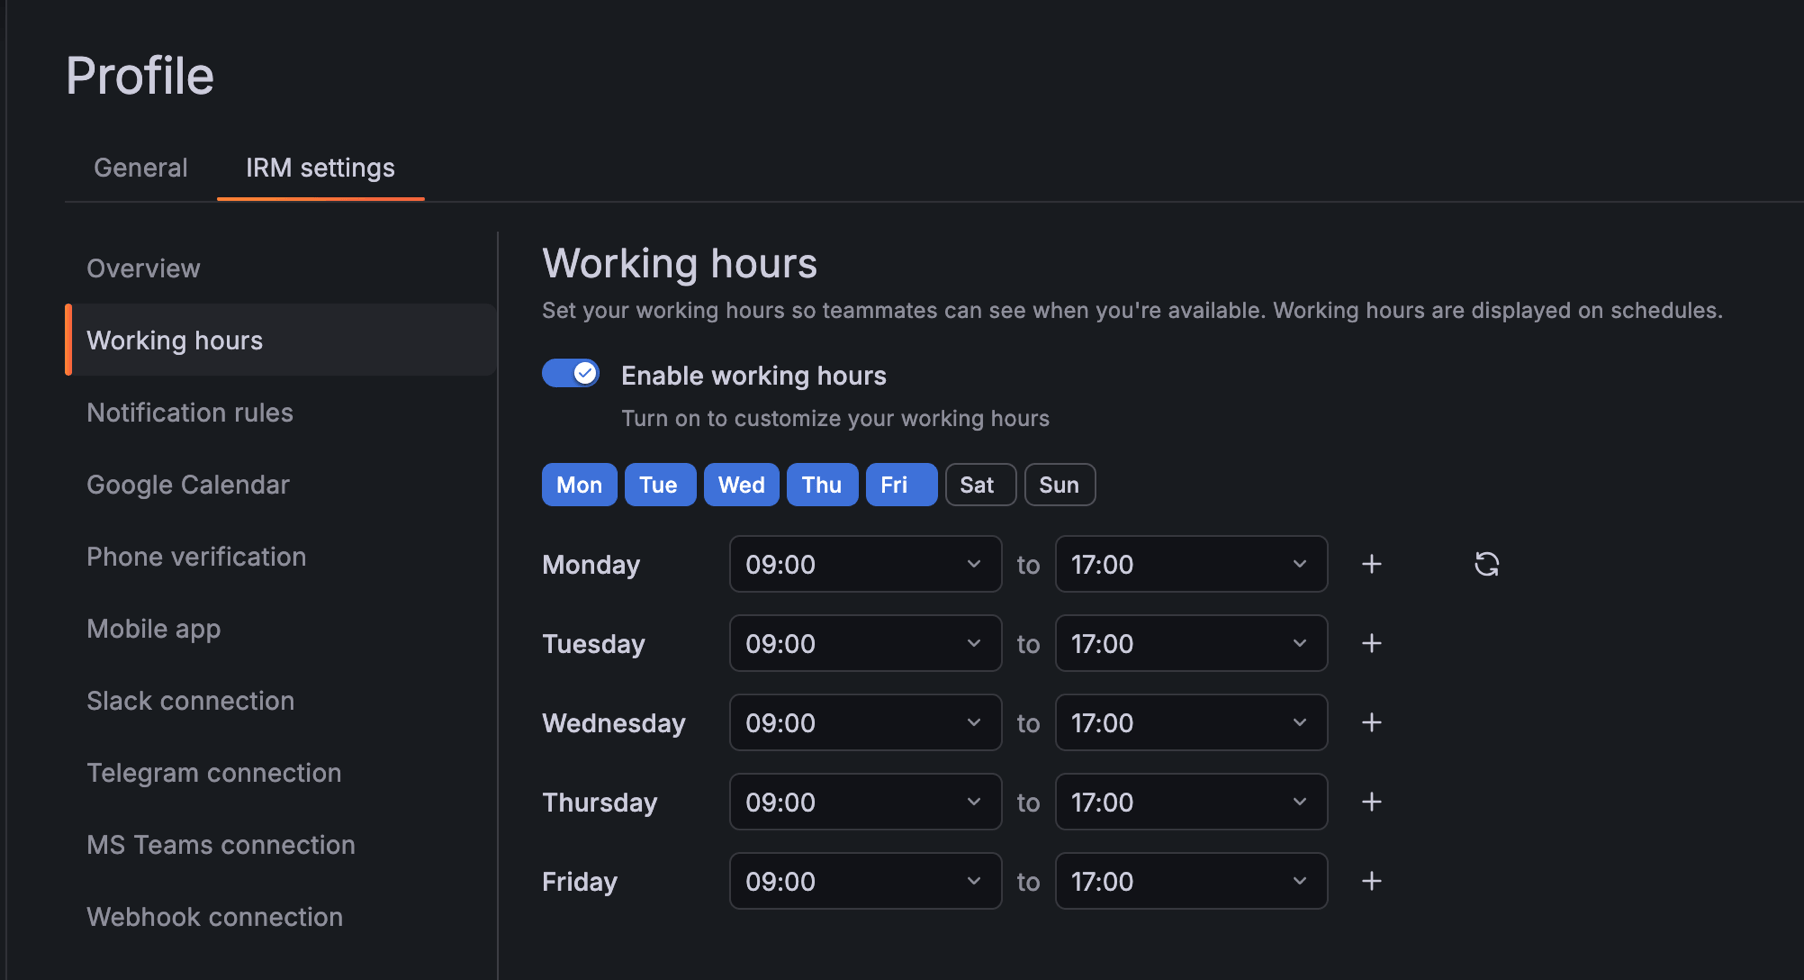
You can now define custom working hours so teammates can see when you’re available directly from on-call schedules.
We’ve added a Working hours tab to your IRM user settings, so you can customize each day to match your actual schedule. Toggle individual days on or off, set up to three time ranges per day, and copy one day’s configuration to all other active days in one click.
Once enabled, schedule hover cards show whether you’re currently inside or outside your working hours based on your configured availability.
Access and analyze Grafana Cloud cost and usage data using the open FOCUS standard
We’re excited to announce the general availability of FOCUS support in the Cost Management and Billing app!
Detect unexpected spikes and drops in usage with intelligent anomaly detection
We’re excited to announce the general availability of Anomaly Alerts in the Cost Management and Billing app!
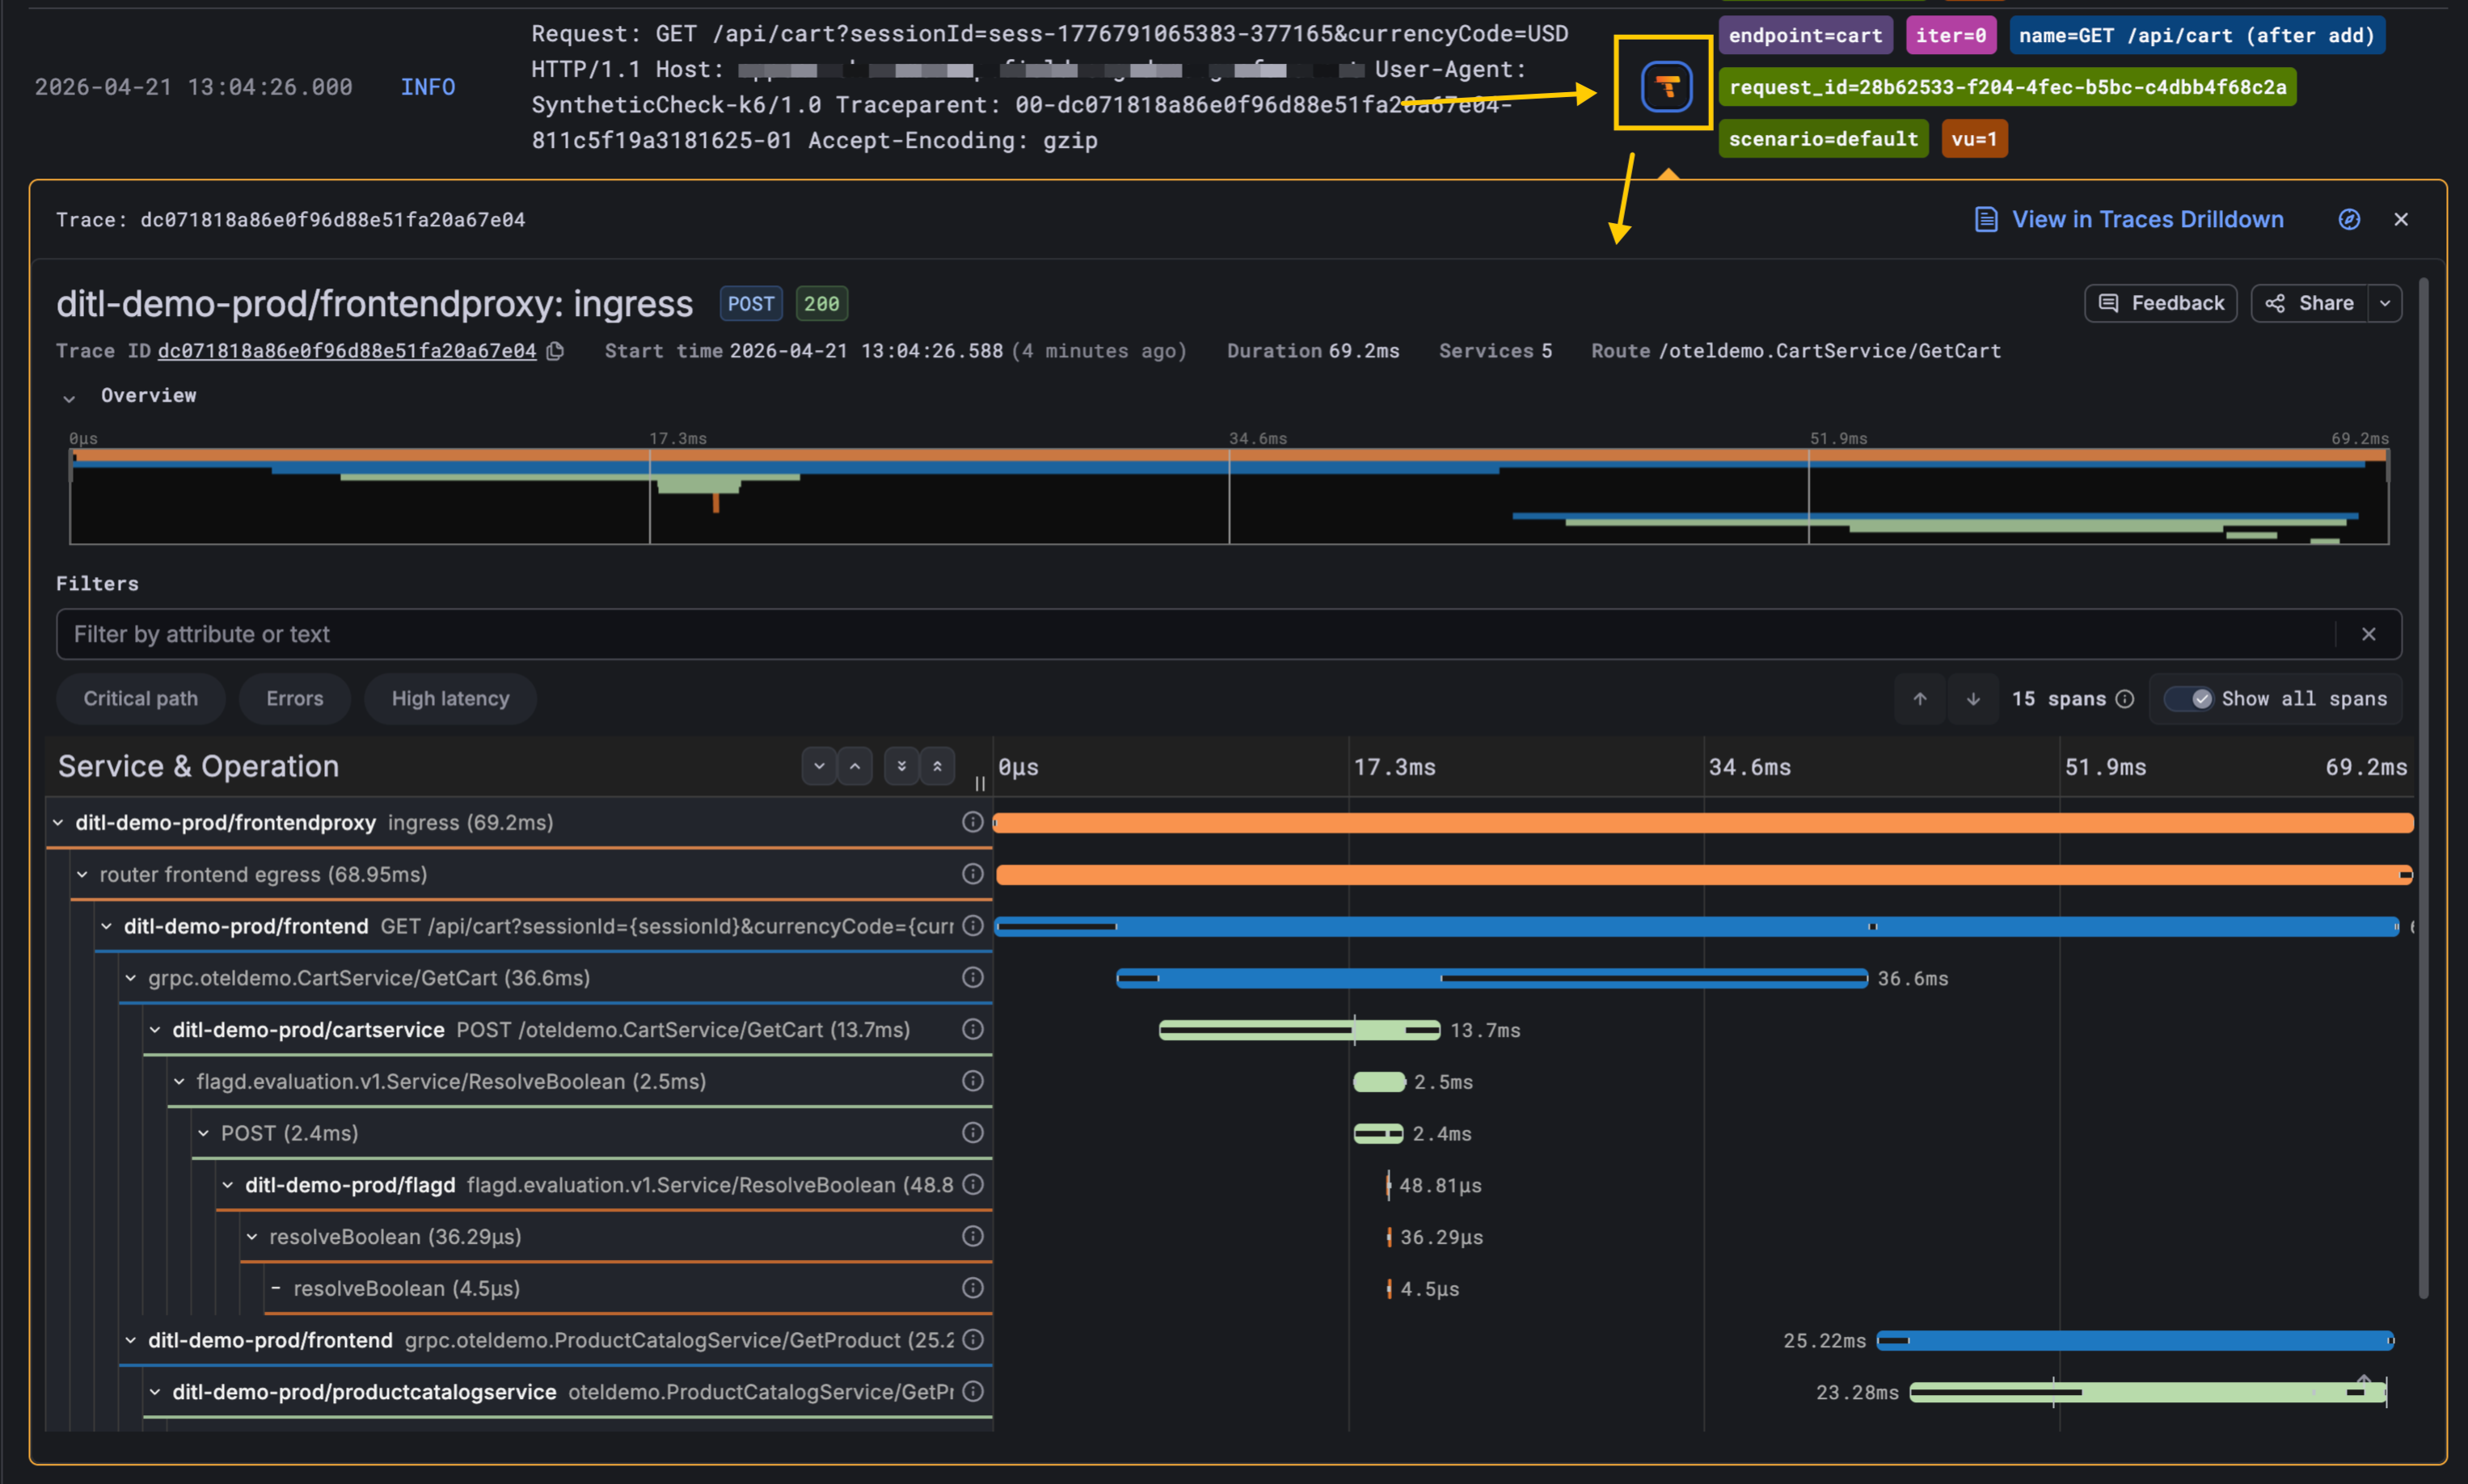
Synthetic Monitoring checks are now linked to distributed traces they generate in Grafana Cloud Traces! When a Scripted check fails or looks slow, you can open the underlying trace with a single click from the check’s logs and see exactly which service, span, and downstream call caused the problem.
This helps to shrink the gap between a poor user experience and the underlying root cause.