What's new from Grafana Labs
Grafana Labs products, projects, and features can go through multiple release stages before becoming generally available. These stages in the release life cycle can present varying degrees of stability and support. For more information, refer to release life cycle for Grafana Labs.


Loading...
Area of interest:
Cloud availability:
Cloud editions:
Self-managed availability:
Self-managed editions:
No results found. Please adjust your filters or search criteria.
There was an error with your request.
You can now send OpenTelemetry traces straight to Agent Observability, without the SDK. If your agents already emit OpenTelemetry generative AI spans, from your framework, an instrumentation library, or spans you write yourself, keep your existing route through Grafana Alloy or an OpenTelemetry Collector and opt in your AI spans with a single attribute. Your agents then show up like any other service, next to the traces, metrics, and logs you already send to Grafana Cloud.
Grafana IRM brings Grafana Assistant into the places where you respond to alerts and incidents. Start an investigation and review what it found without switching tools.
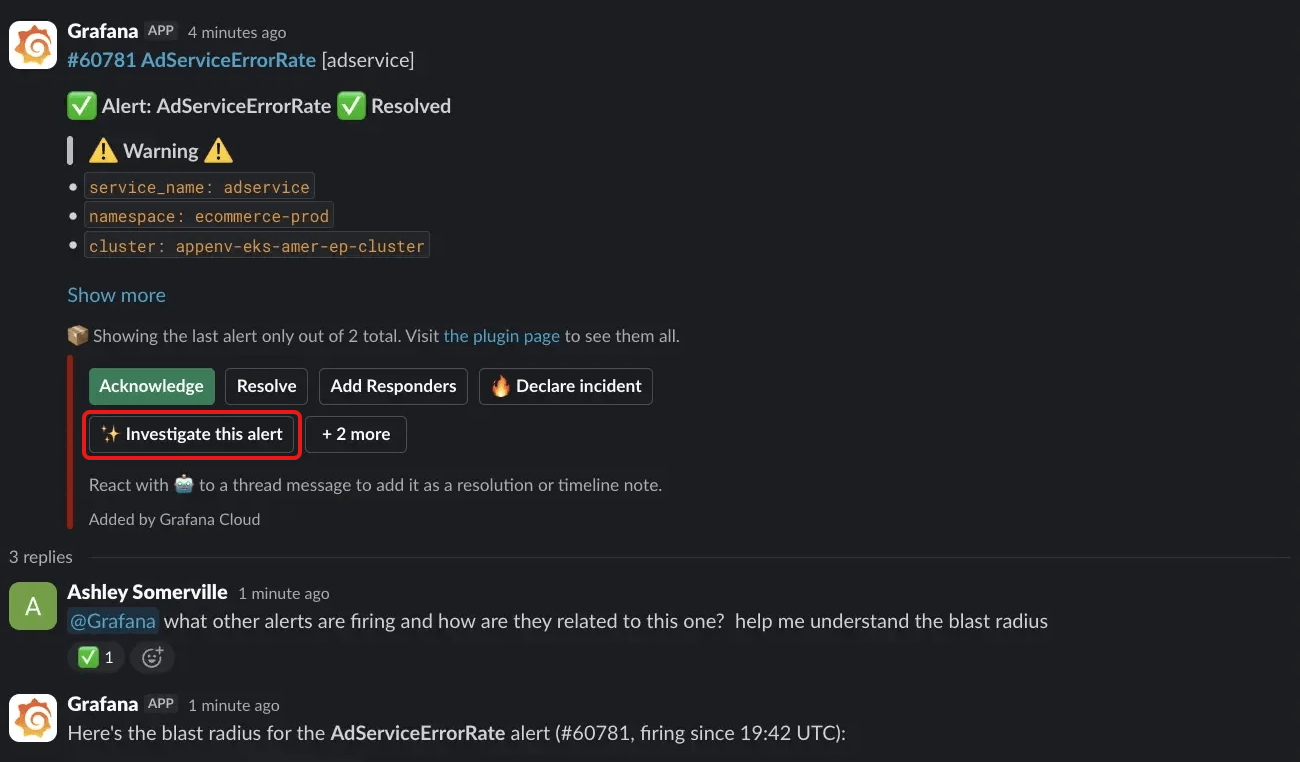
Investigate an alert from Slack
Click Investigate this alert on an IRM alert group message in Slack. Grafana Assistant then does the following:
- Summarizes what’s firing and its current status.
- Checks for related incidents and other firing alerts.
- Assesses the blast radius and impact.
- Suggests next steps for triage.
Assistant replies in the alert group’s thread so the whole team can see it.
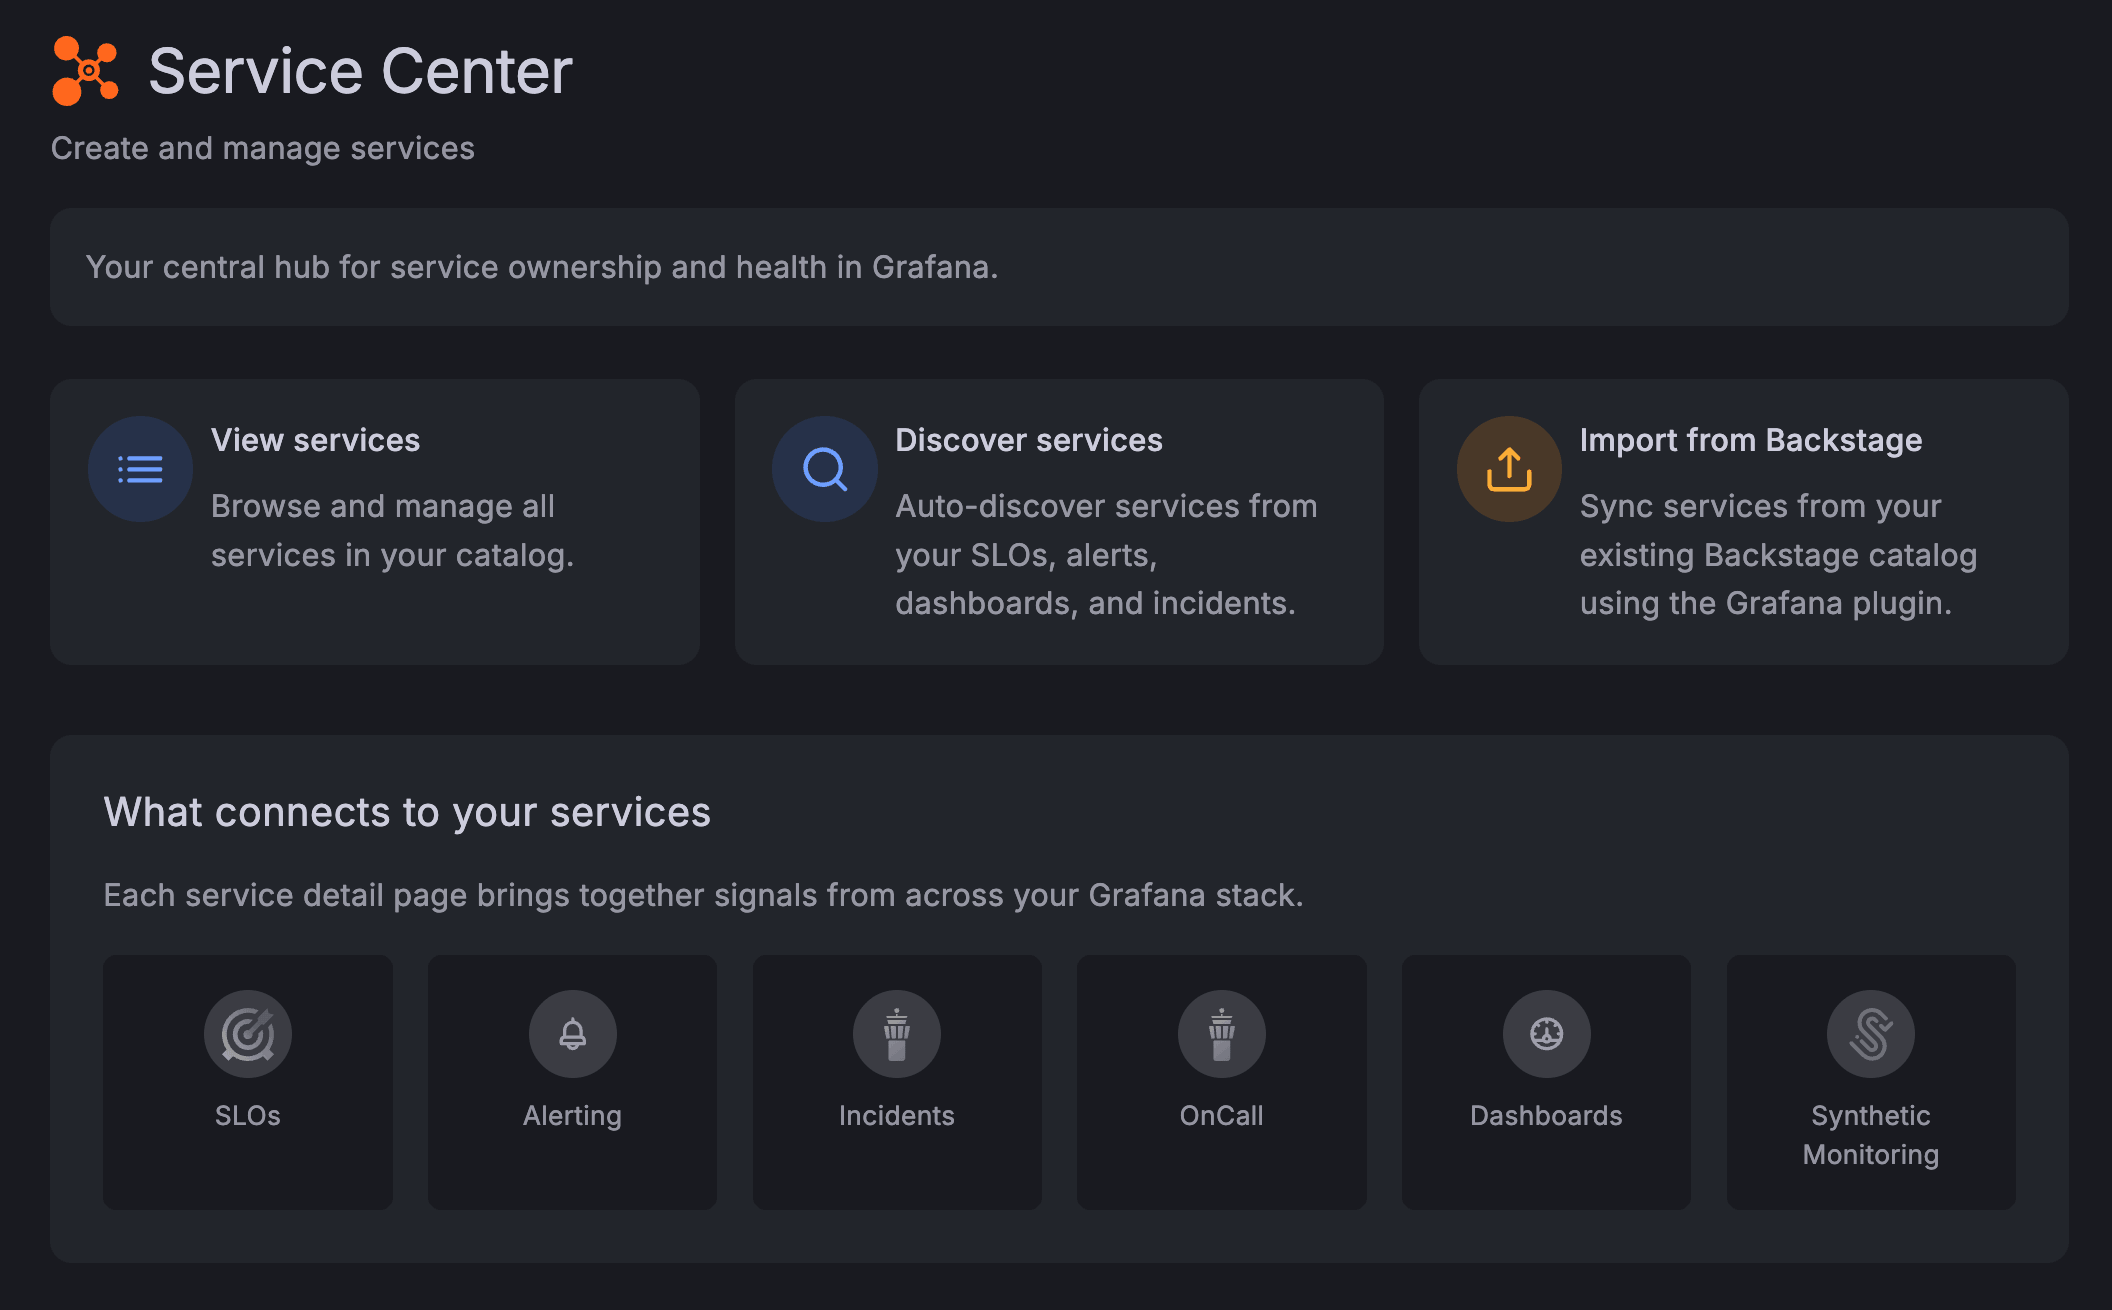
Service Center in Grafana Cloud brings a service’s SLOs, alerts, incidents, on-call activity, dashboards, and synthetic checks into one view. You now have more ways to get your services into Service Center and keep them organized.
Find your services faster
A new Service Center home page links to the main actions: view services, discover services, or import from Backstage.
In the service list, star your favorite services and filter by name, team, identifier, starred services, or My teams. Recently viewed services are one click away. Filters are saved in the URL, so you can bookmark or share a filtered view.
Discover services automatically
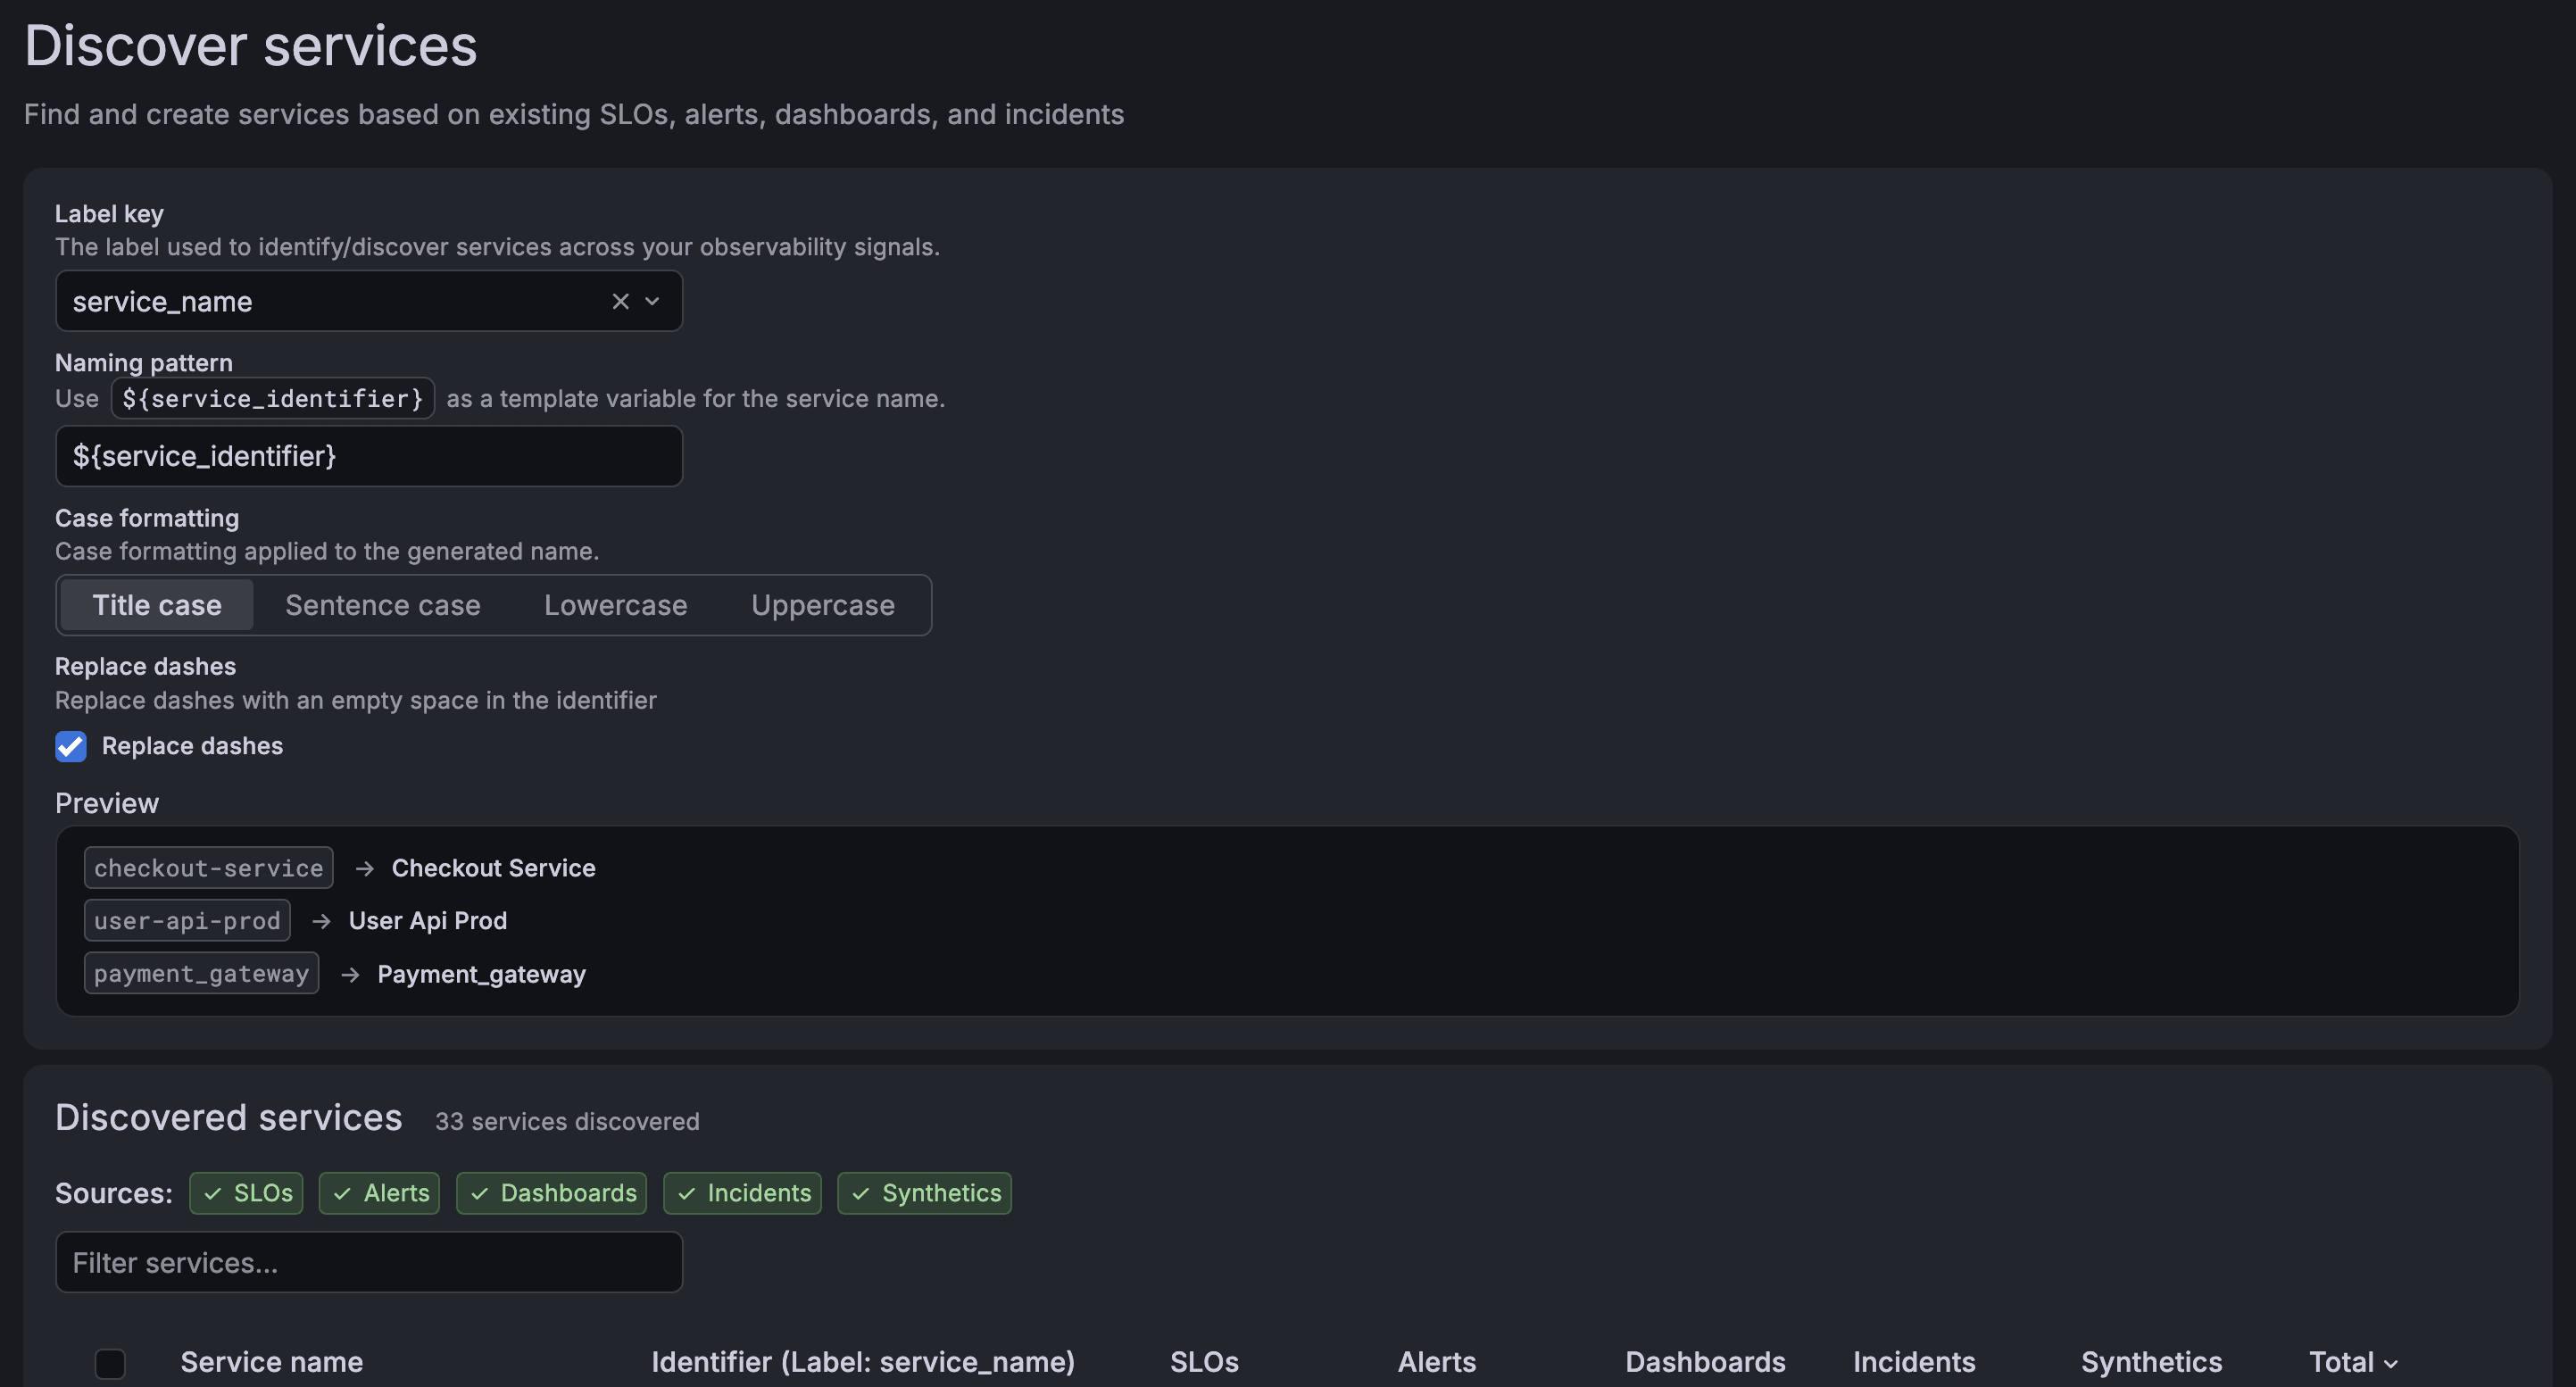
The Discover services page scans your SLOs, alerts, dashboards, incidents, and synthetic checks for services you haven’t added yet. Choose the label that ties them together, such as service_name, service, job, namespace, app, team, or a custom key. Set a naming pattern with a live preview, and create the services you want in bulk.
To learn more, refer to Discover services.
When multiple dashboards use the same variable, creating and maintaining it separately in each dashboard can lead to duplicated work and inconsistent configuration. Cross-dashboard variables let you define a variable once and reuse it across multiple dashboards in your Grafana organization.
Create and manage cross-dashboard variables from Dashboards > Variables. You can scope a variable in either of two ways:
- Global: Available to all dashboards in the organization.
- Folder: Available only to dashboards in the same folder.
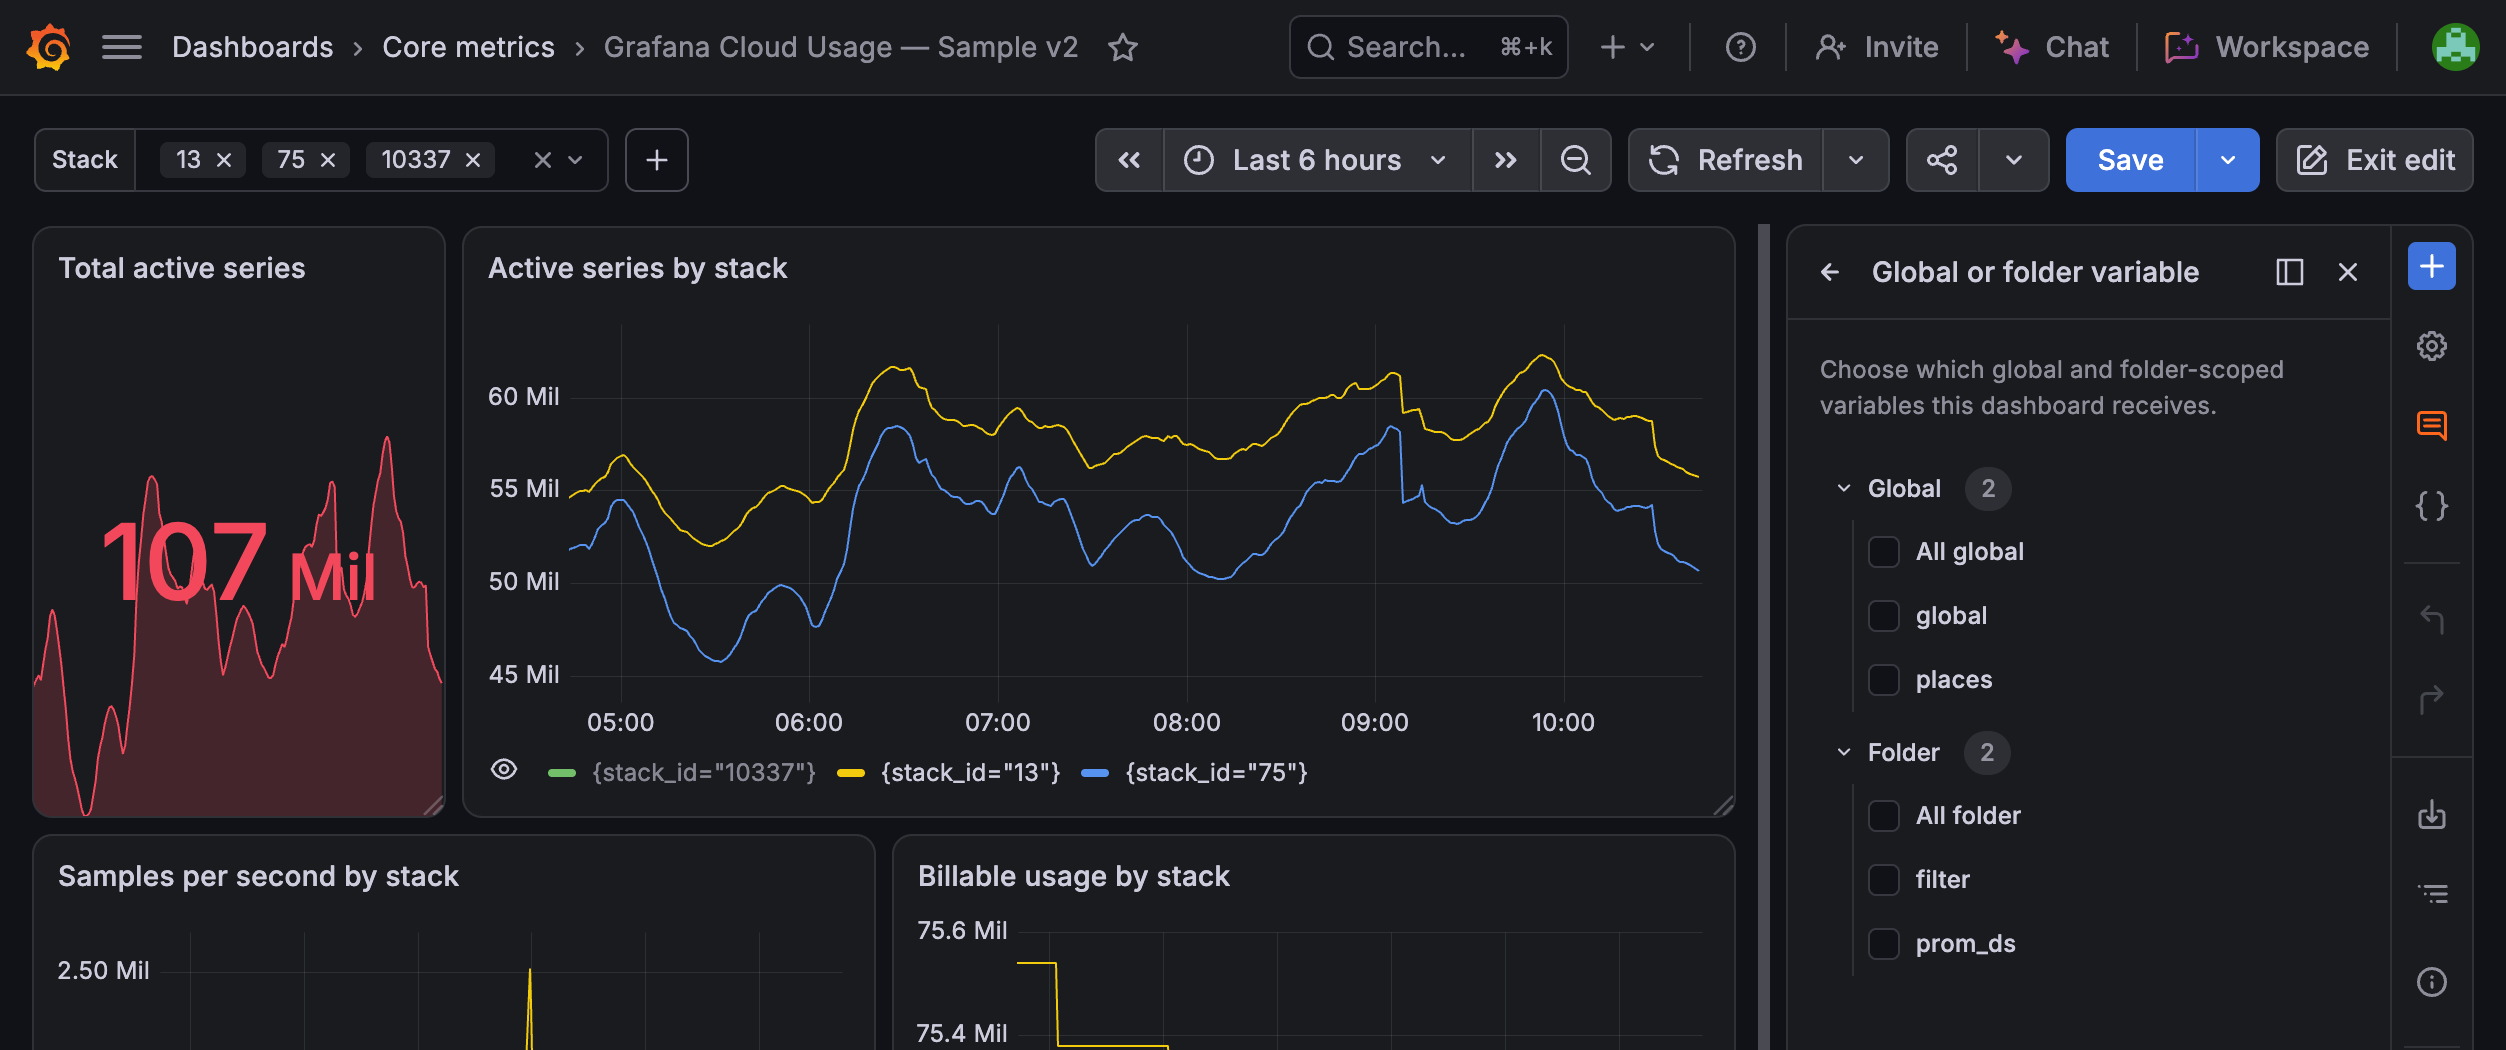
When you use the Grafana mobile app on more than one device, you might want alerts on the phone you carry while your other devices stay quiet. For each mobile push notification step, you can now choose which paired device receives alerts, or keep sending them to all your active devices. You can manage this in the Grafana mobile app or on the Mobile app tab of your Grafana user profile.
You can now improve your alert rule quality with the Alert Advisor. Alert rules are easier to act on when they carry the right context, like a runbook URL to guide investigation or a team label to route notifications. With the Alert Advisor in Grafana, you can:
- Define which labels and annotations are required for Grafana-managed alert rules.
- Find rules with missing required labels or annotations and update them.
- Optionally enforce selected requirements on supported provisioning writes.
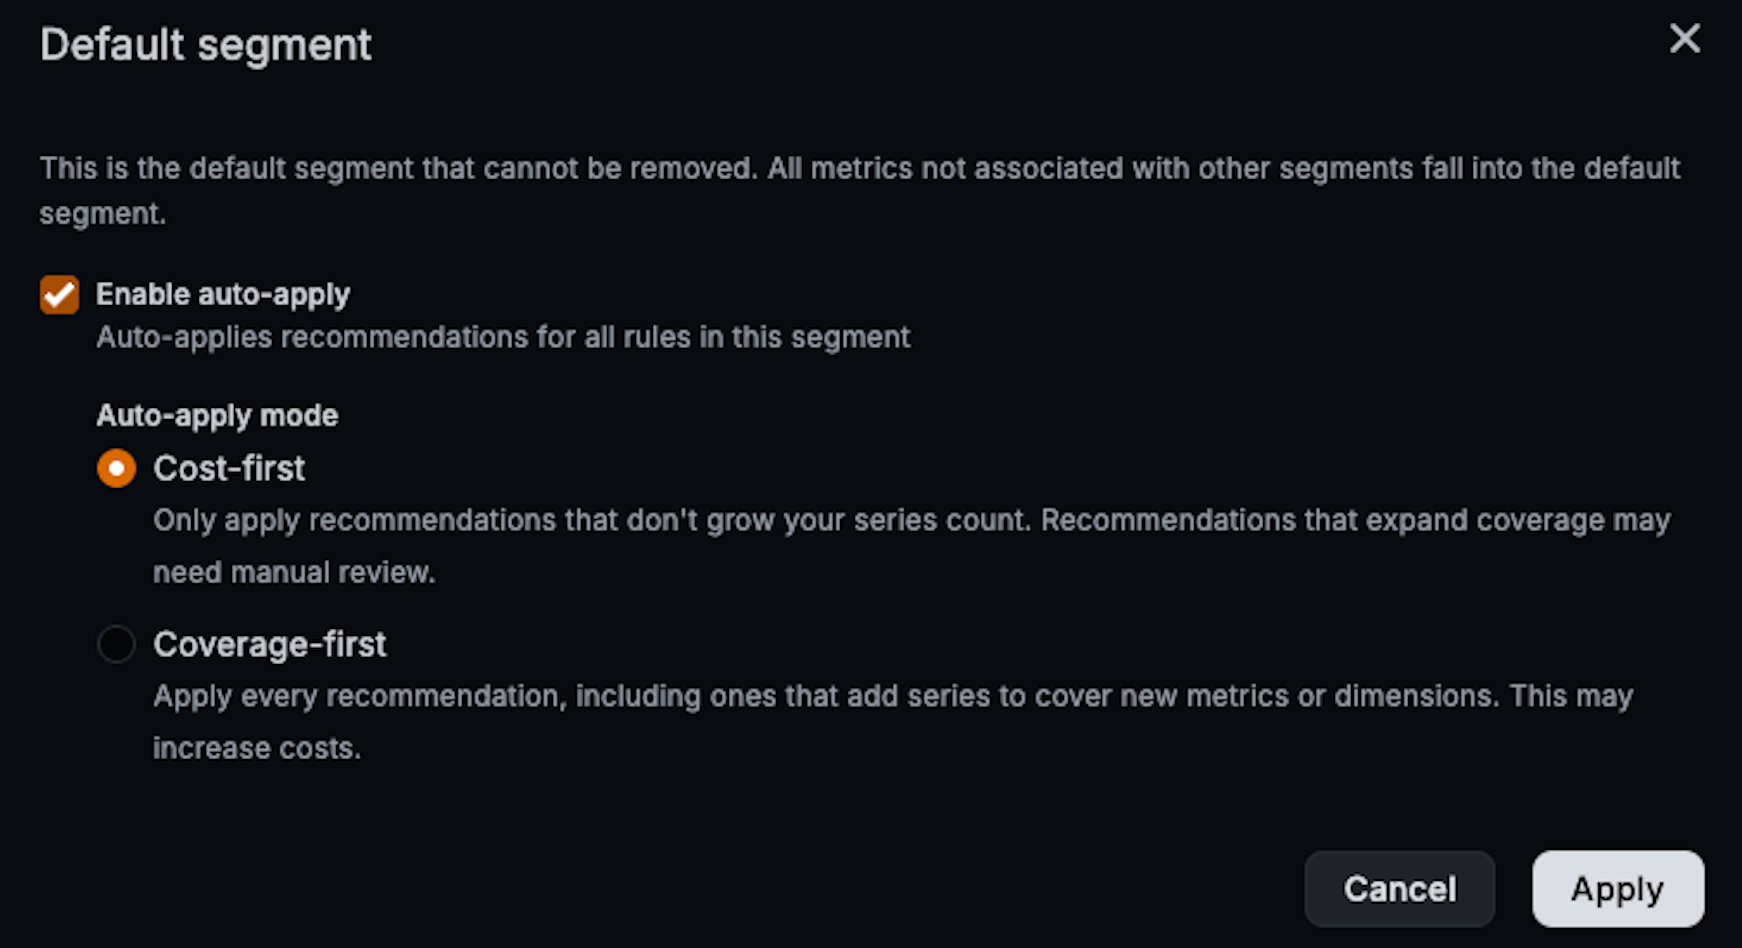
Auto-apply is now generally available! By enabling auto-apply, Grafana Cloud Adaptive Metrics automatically applies recommendations for segments, so you don’t have to review the list after every analysis.
To get started, enable auto-apply for the Default segment if you haven’t created any segments yet. If you already have segments, enable it for multiple segments or for an individual segment, and choose Coverage-first or Cost-first.
Connection KPIs let you reduce the metrics cost of inbound and outbound service connections without turning the service graph off. You choose how much performance data Grafana Cloud Traces generates for each client-server pair.
Latency histograms add many more series than request and error counts. Generate all KPIs keeps requests, errors, and latency. Generate requests and errors drops those histograms, which is usually the largest saving, while traffic and errors stay visible.
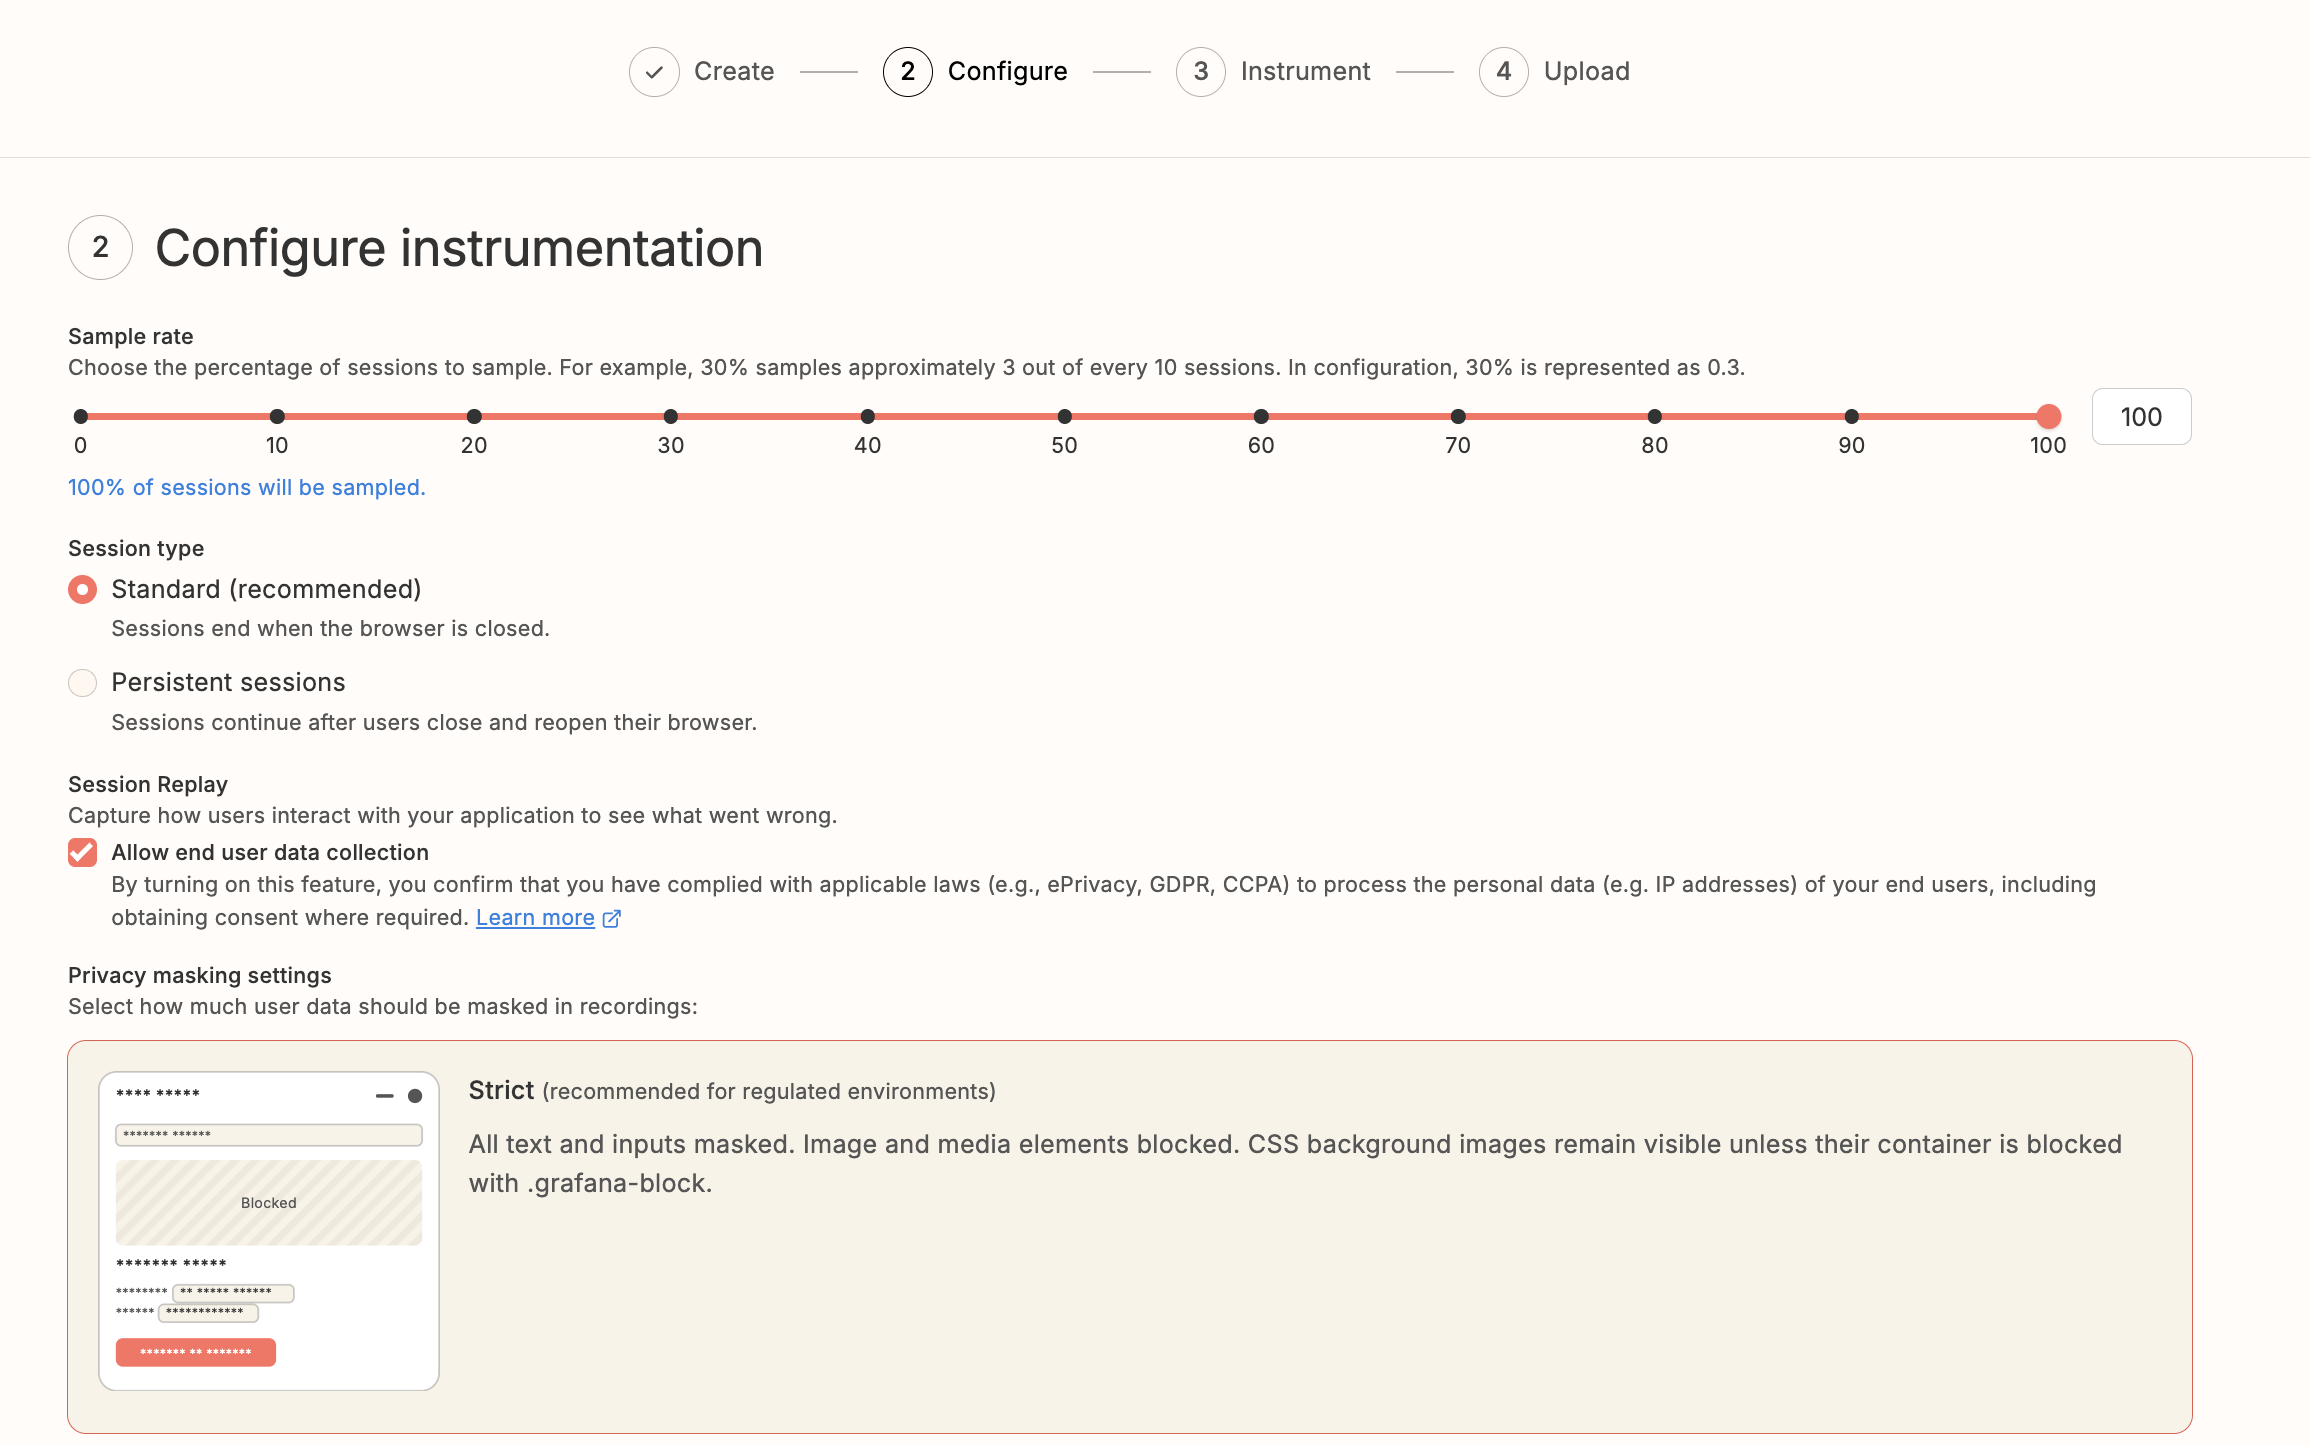
Session Replay in Frontend Observability is open to everyone. You no longer need the waitlist form from the August 2026 public preview announcement.
You can turn Session Replay on directly from the Frontend Observability app setup flow. On the Configure instrumentation step, enable Allow end user data collection under Session Replay and pick a privacy masking preset.
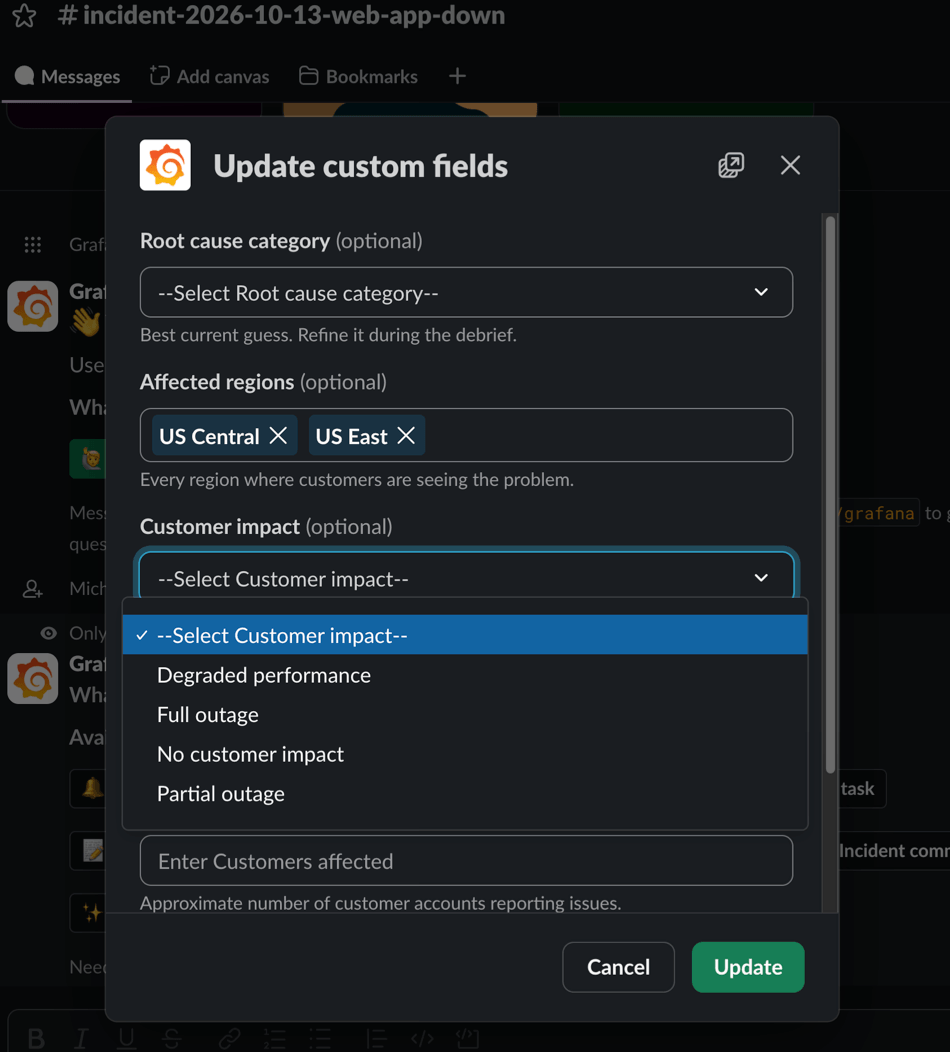
Incident custom fields in Grafana IRM work in the Grafana Cloud app for Slack. Responders can record the details your team tracks without switching to the browser.
You can now filter and sort alert groups in Grafana IRM by when they were created, last received an alert, acknowledged, or resolved.
Want to review what your team resolved last week? Select Resolved At from the drop-down next to the time range picker, then select Last week.
When you silence an alert group in Grafana IRM, the silence now lasts for the full duration you choose, even if the source resolves and fires again.
Previously, if the source sent a resolve signal while an alert group was silenced, the alert group resolved immediately and the silence ended with it. If the alert was flapping, the next firing alert started escalation again, so a three-hour silence could end after a few seconds.
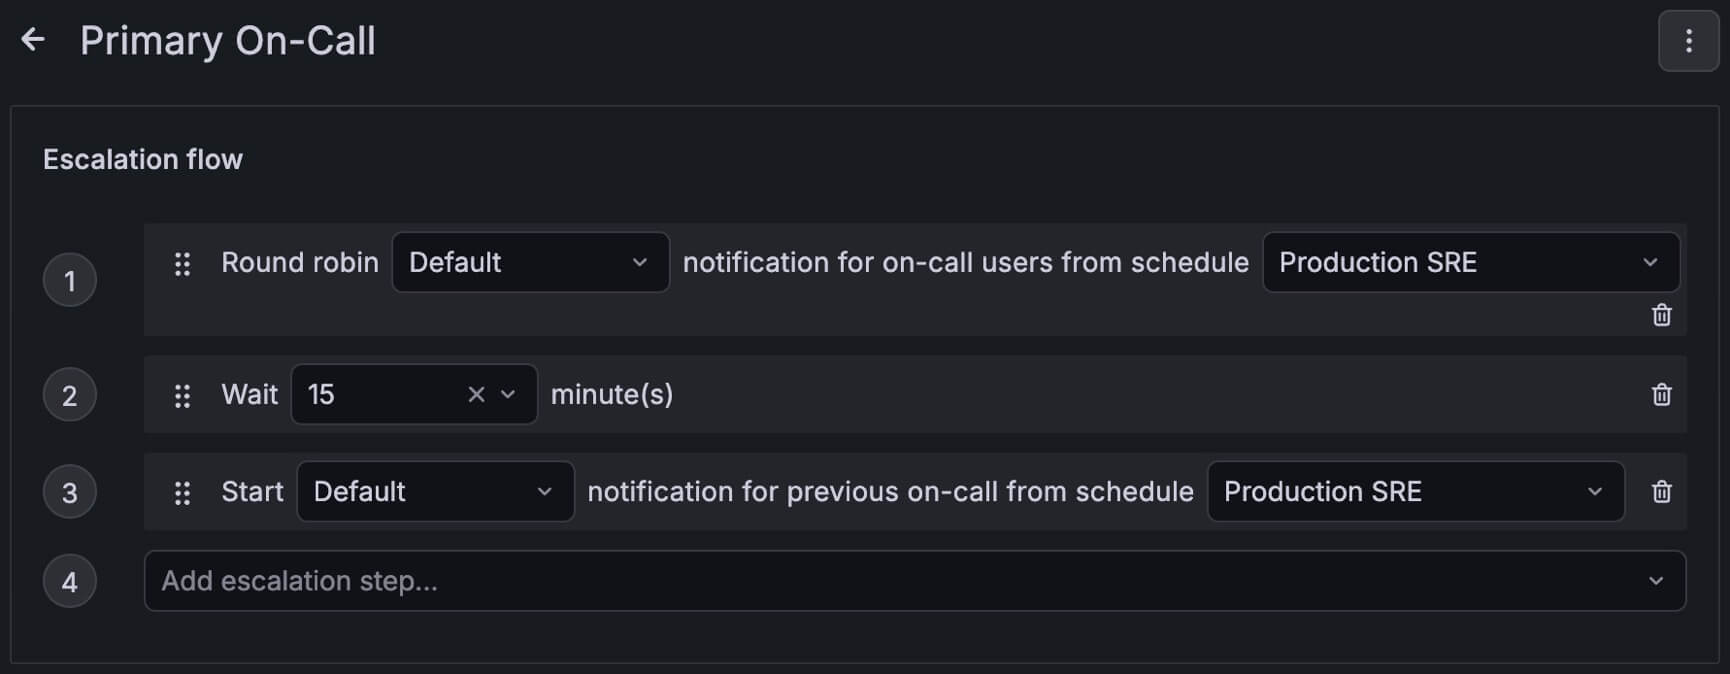
Escalation chains in Grafana IRM have new options that give you more control over who gets paged, and when.
Spread pages across everyone on a shift, or pull in the responder coming off the last shift. When an alert group is waiting, move it to its next step without waiting out the timer.
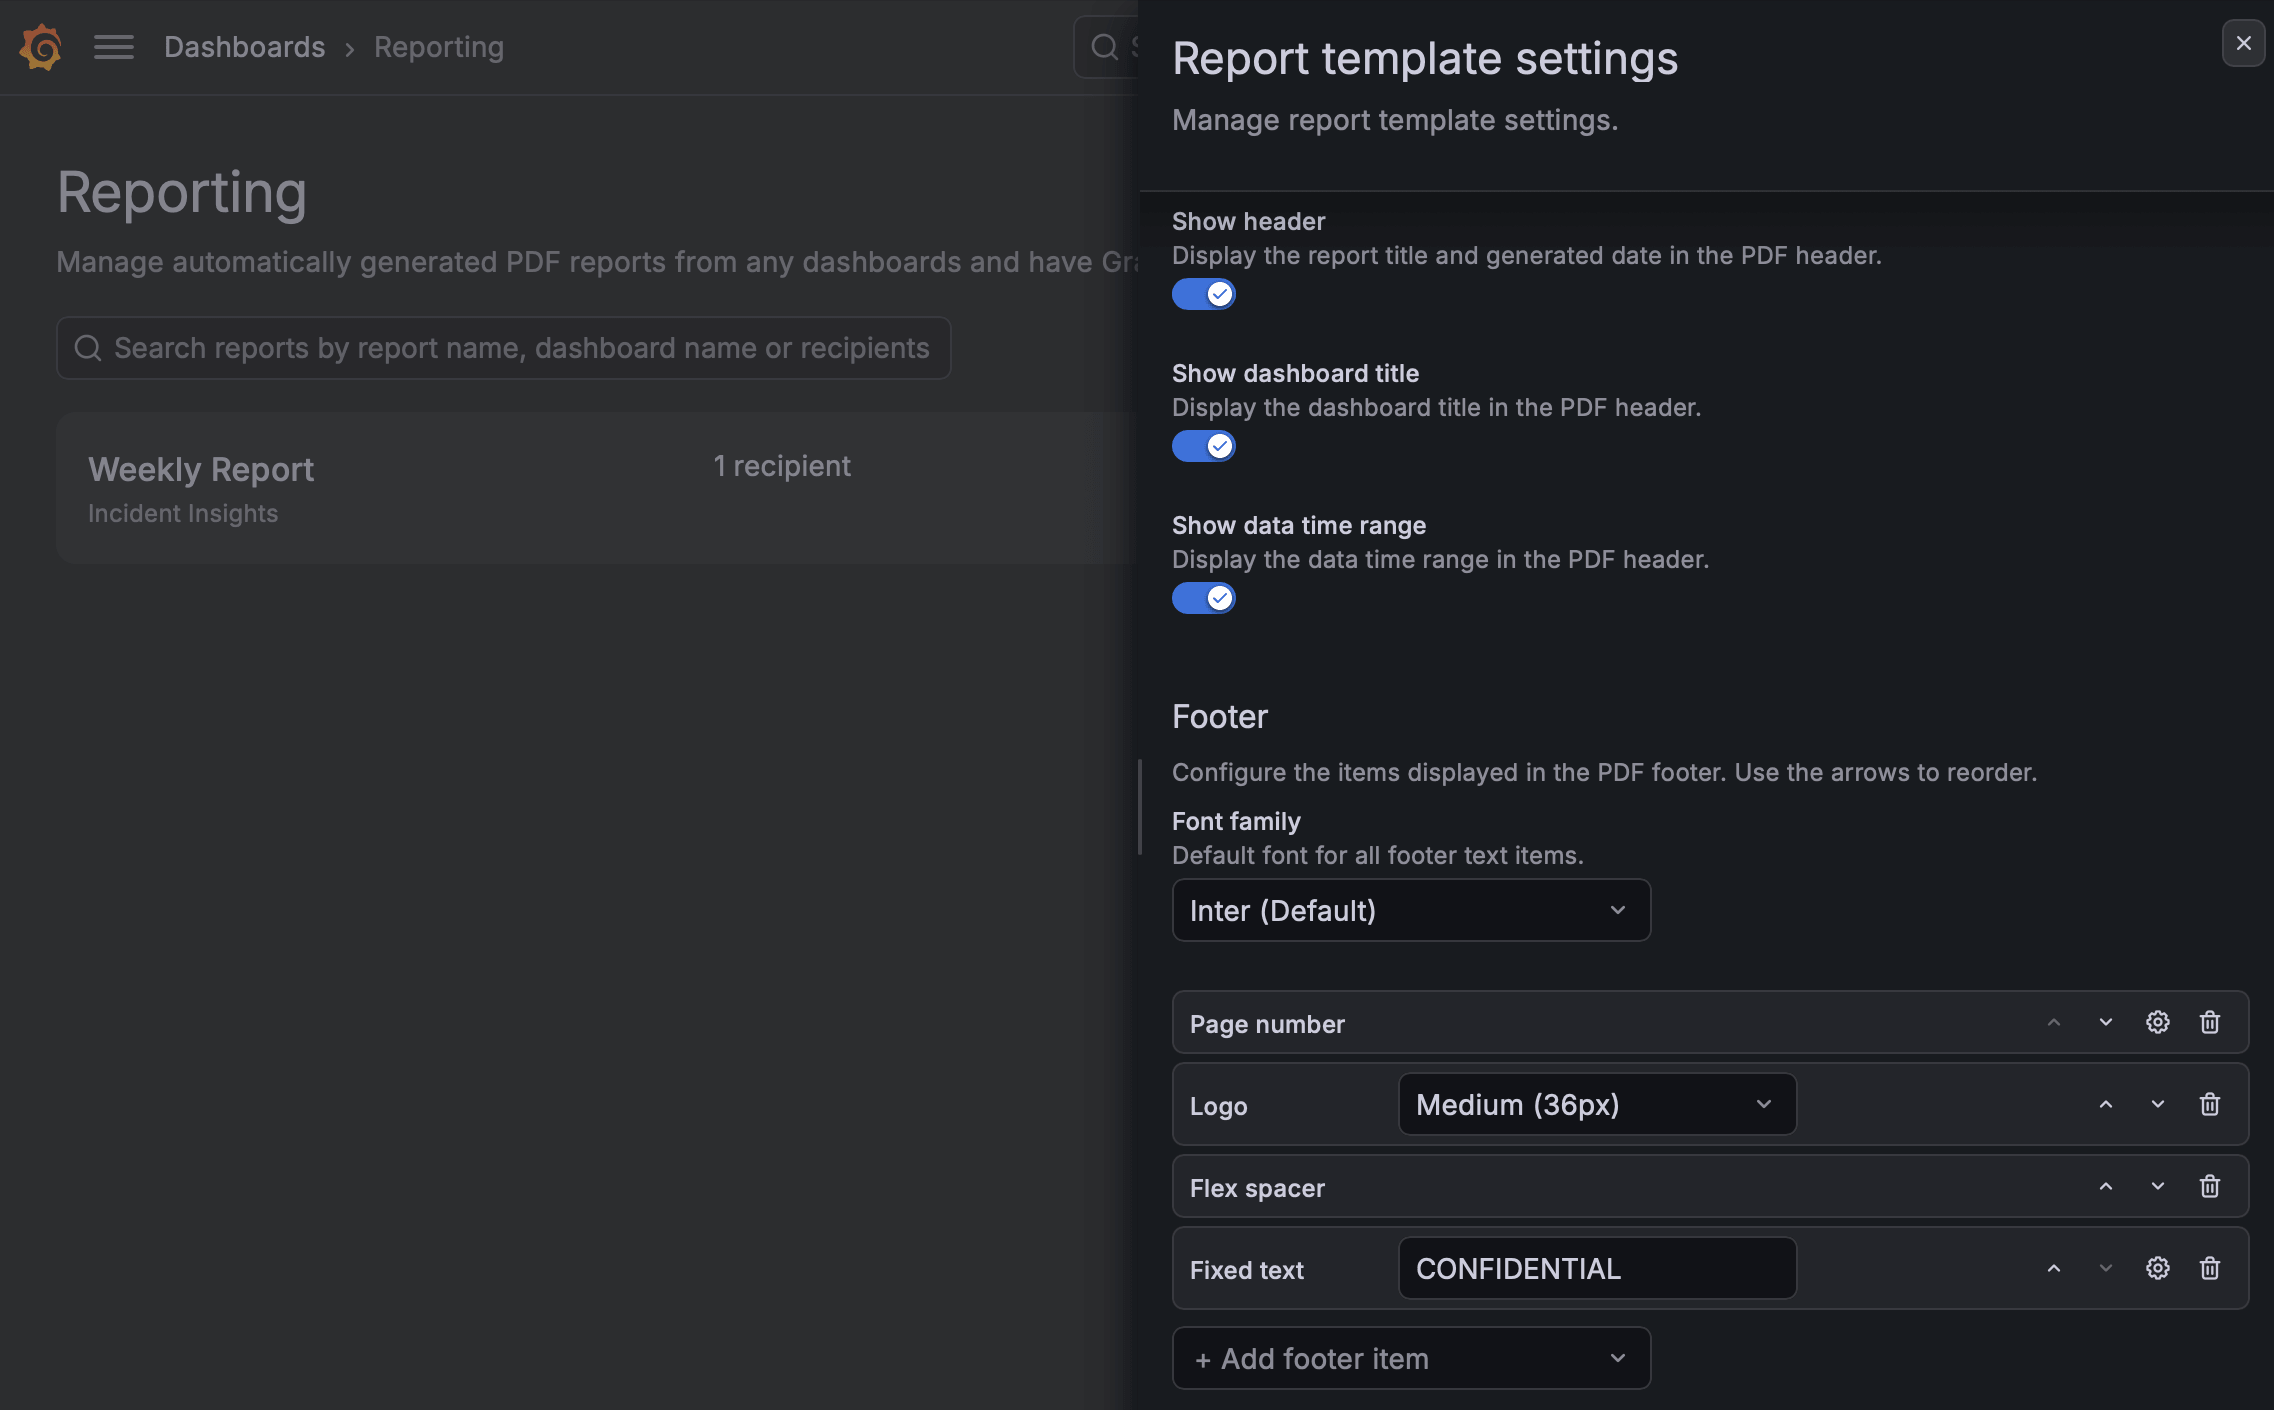
Different readers need different things from a report. An executive may want clean pages that put the panels first, while a client expects your branding and page numbers throughout.
Custom PDF headers and footers let you shape your reports around the people who read them. Decide what the header shows, build a footer from the pieces you need, and style the text to suit your audience.
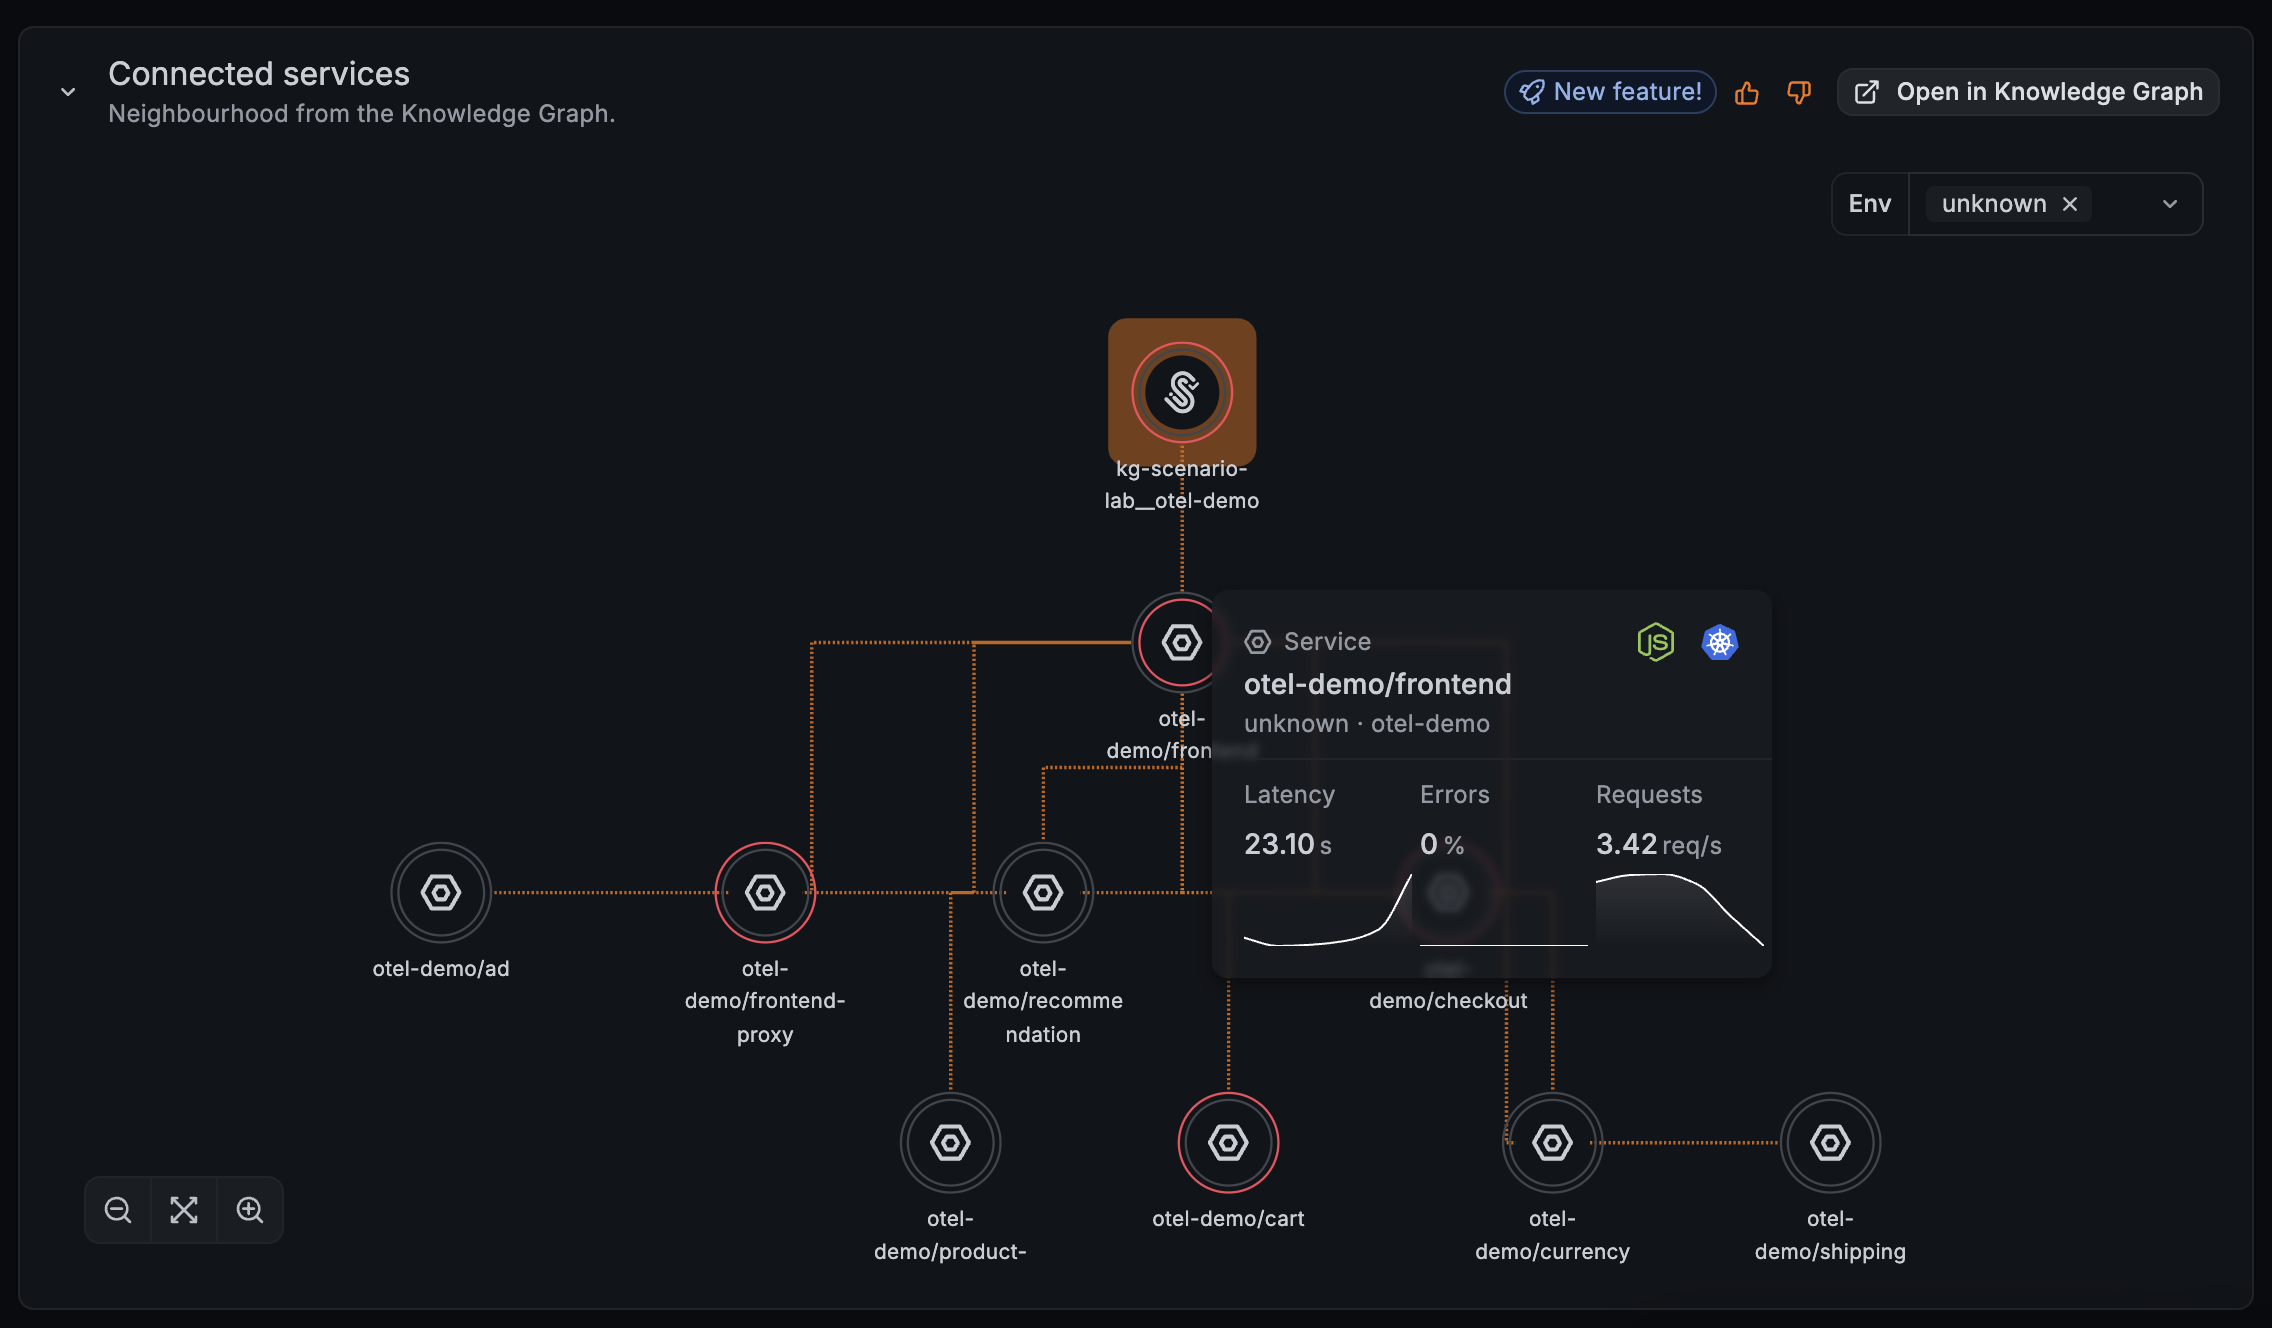
Grafana Cloud Synthetic Monitoring now integrates with the knowledge graph, available in public preview. When a check fails or slows down, you can see the service it monitors, explore its dependencies, and compare check results with service health to narrow down where to investigate.