
What's new from Grafana Labs
Grafana Labs products, projects, and features can go through multiple release stages before becoming generally available. These stages in the release life cycle can present varying degrees of stability and support. For more information, refer to release life cycle for Grafana Labs.


Loading...
Area of interest:
Cloud availability:
Cloud editions:
Self-managed availability:
Self-managed editions:
No results found. Please adjust your filters or search criteria.
There was an error with your request.
Synthetic Monitoring checks can now connect directly to Grafana SLO (Service Level Objective), so you can use checks and their reachability data to measure service reliability.
When you activate an observability solution on an existing Grafana Cloud stack, the Grafana Cloud Knowledge Graph automatically maps that solution’s entities and insights. Services, hosts, Kubernetes resources, and their relationships appear in the knowledge graph without any additional configuration.
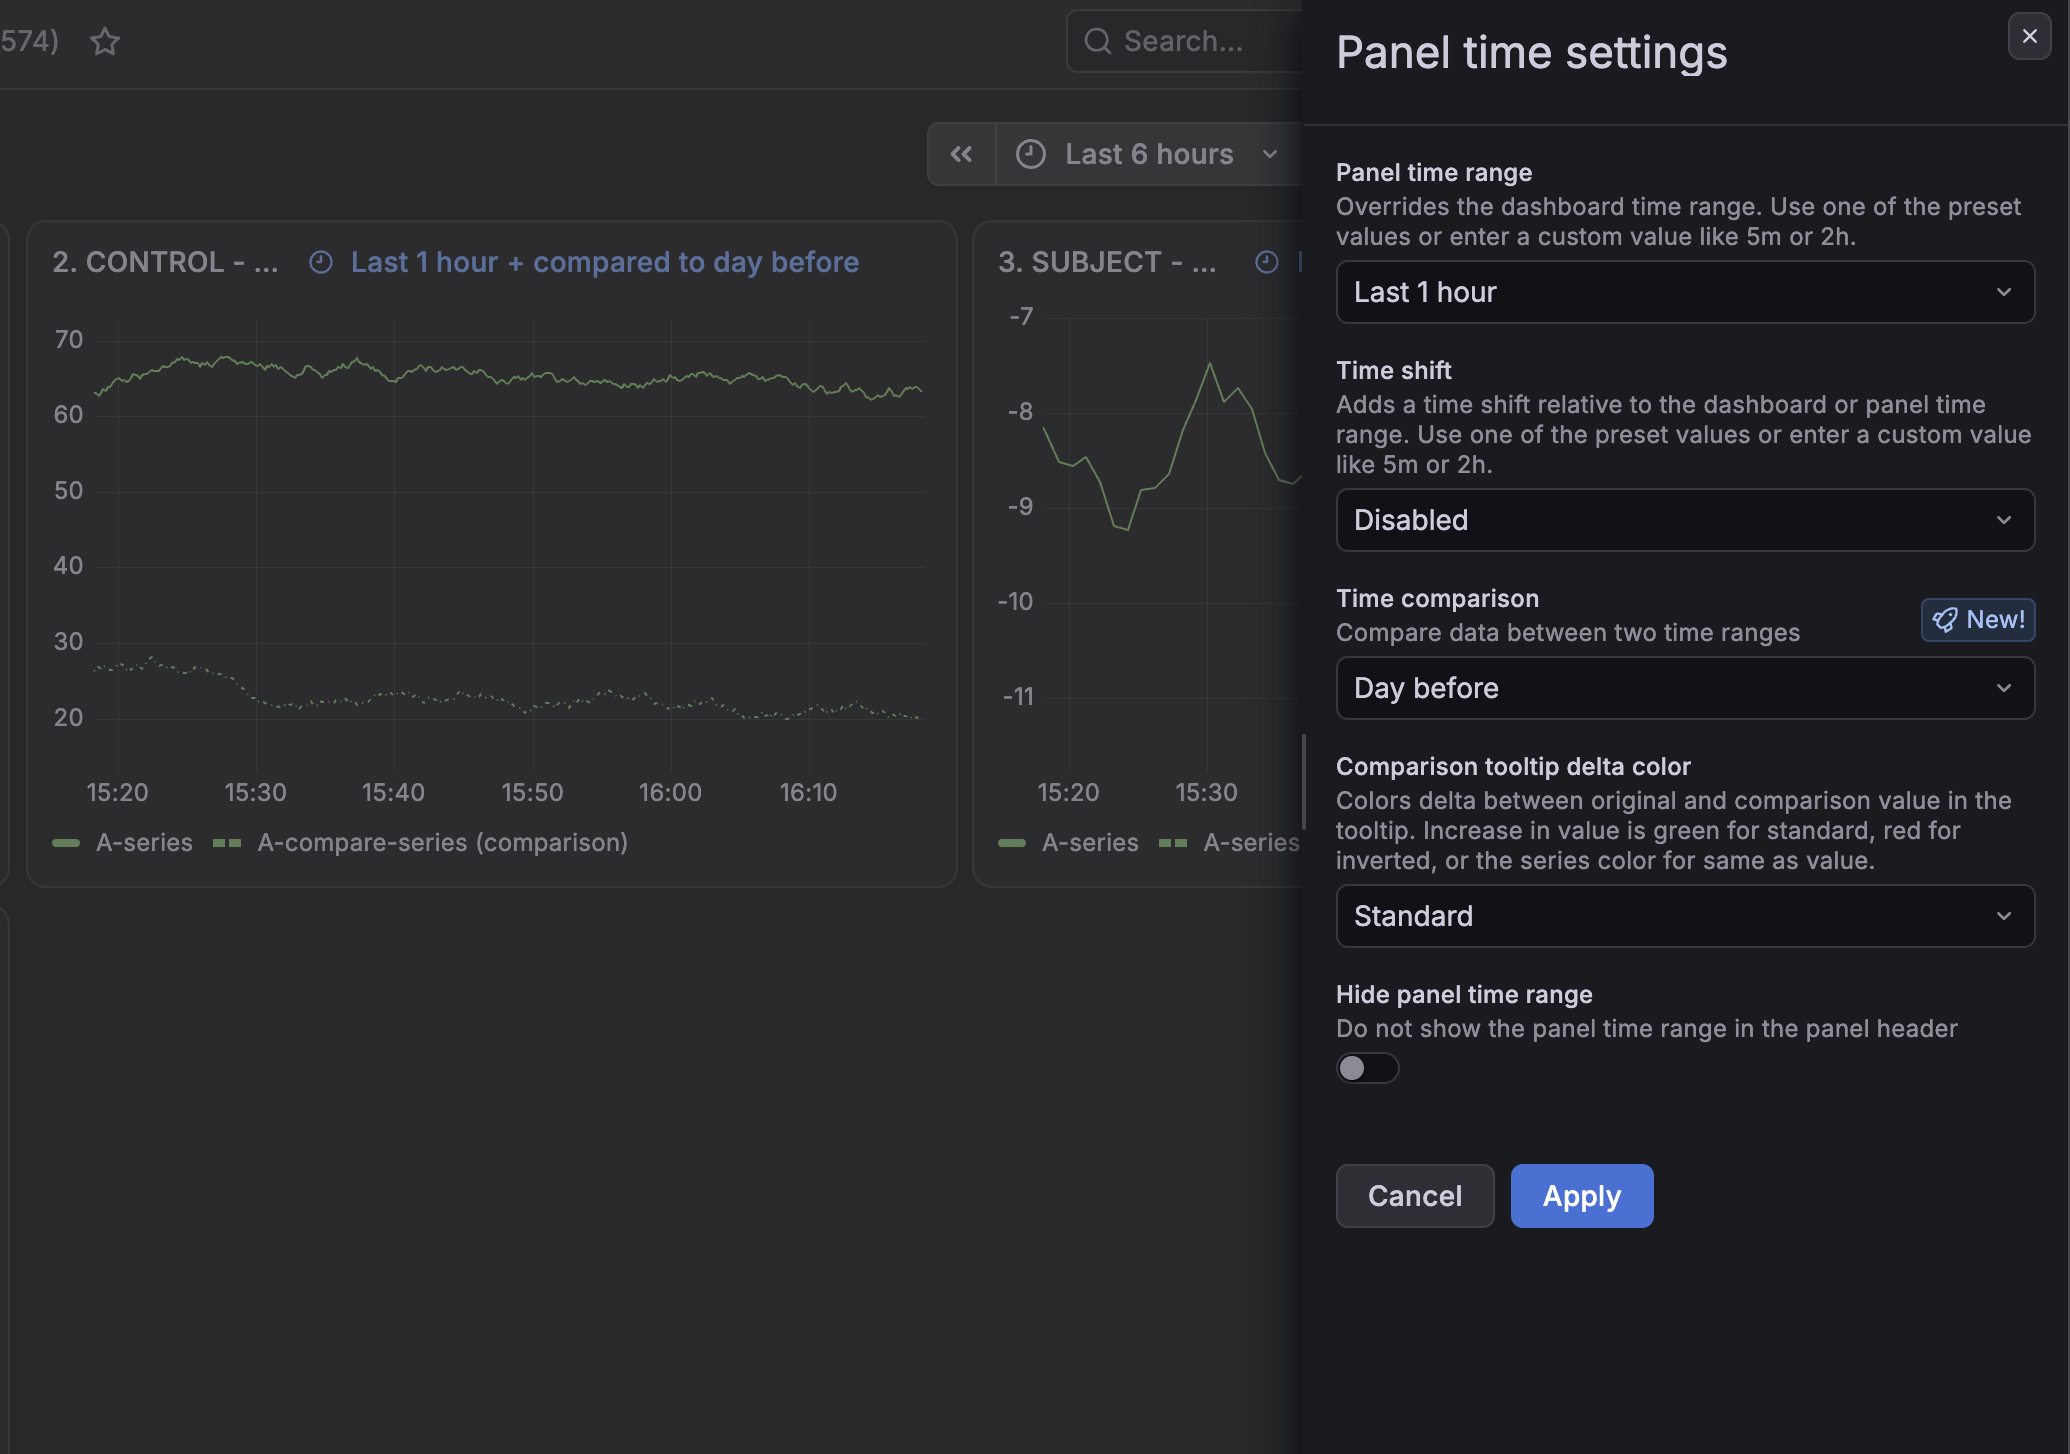
Panel time settings and time comparison are now generally available.
The Panel time settings drawer brings a panel’s time options together in one place. Open the panel menu and select Time settings to override the dashboard time range for a single panel, shift that panel’s window, or compare its data against an earlier period, all without entering dashboard edit mode. When you configure these settings, they appear in the panel header.
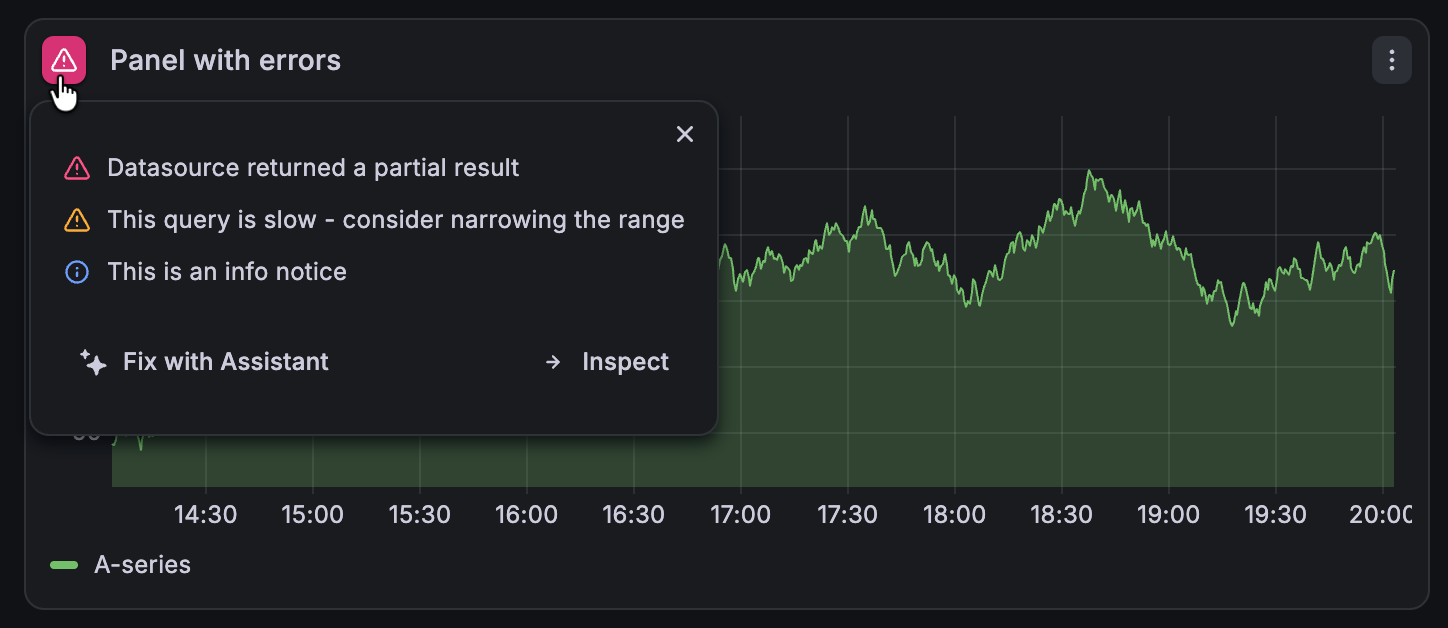
We’ve enhanced the panel errors icon functionality to provide more information around query errors and notices.
This update brings three significant updates. First, the icon is dynamic reflecting the highest severity notice on a panel. Second, when you hover your cursor over the icon, there’s a new tooltip showing all the panel errors, sorted by severity:
The Grafana Cloud Knowledge Graph adds a Show all entities predefined search that displays a connected view of every entity in your environment — services, databases, pods, nodes, and storage volumes — along with the relationships between them.
Select Show all entities from the Frequently used menu in either the entity graph or the entity catalog to see the full topology of your infrastructure and applications. From there, use filters to narrow the view to the entities you care about, or click any entity to navigate to its connections and KPI dashboards. For environments with a large number of entities, results are truncated for performance.
Moving alert rules from Mimir and Prometheus to Grafana previously meant manually rebuilding their notification setup in Grafana. Now you can import your existing Prometheus or Mimir Alertmanager configuration alongside your alert rules—bringing routing and notification settings with you instead of recreating them from scratch.
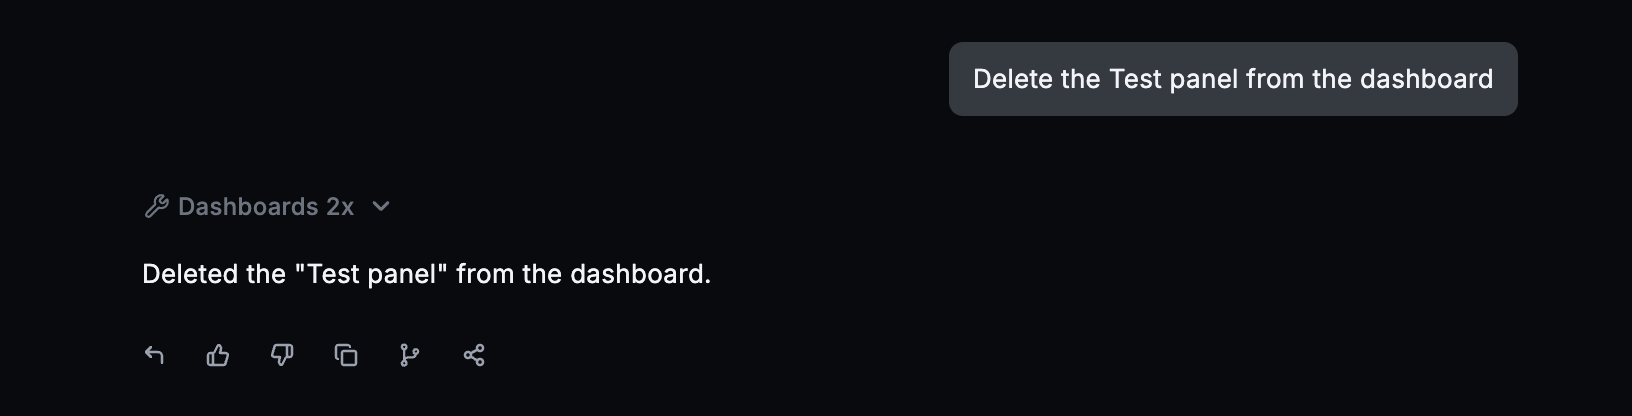
You can now undo Grafana Assistant’s latest dashboard changes with a click. If you try a different layout or visualization and prefer what you had before, you can restore it and keep experimenting.
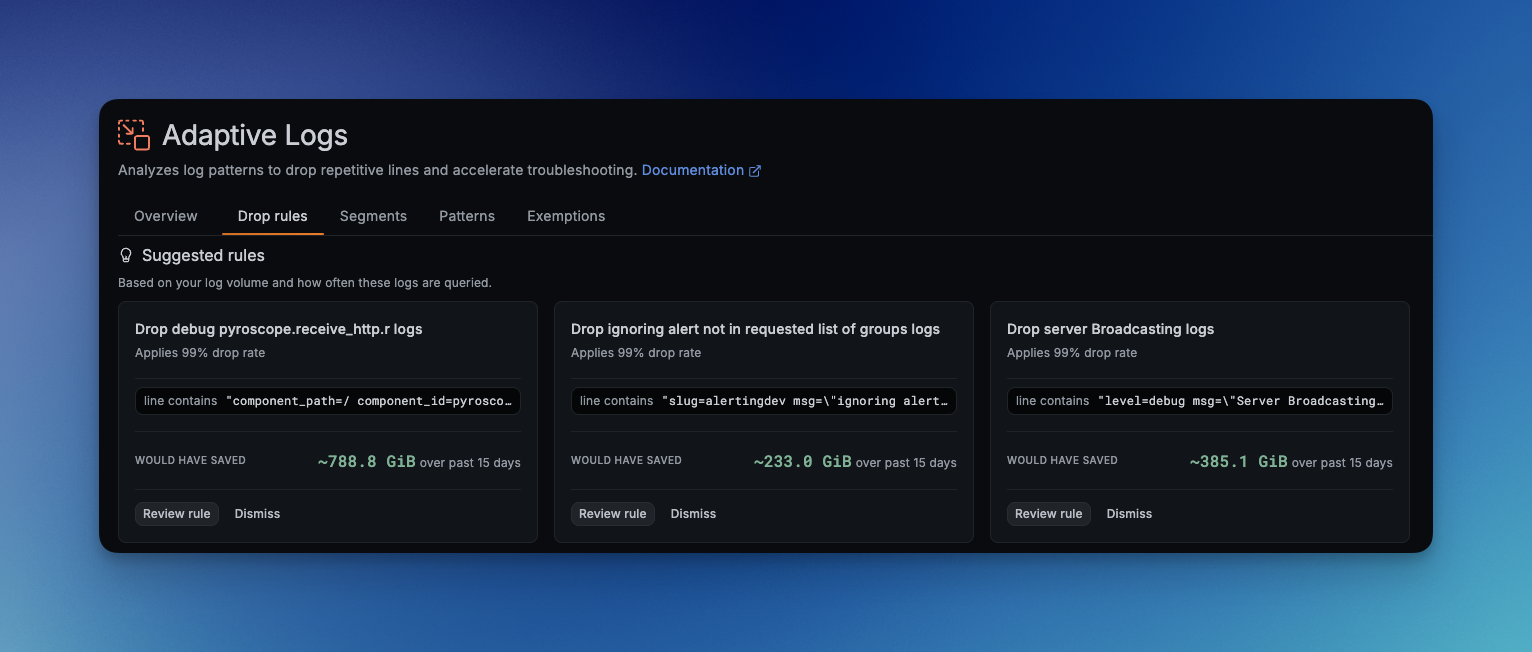
Get to your first Adaptive Logs savings faster!
See your 3 most valuable Adaptive Logs recommendations, and easily tailor them to your needs, to make optimizing log cost even easier.
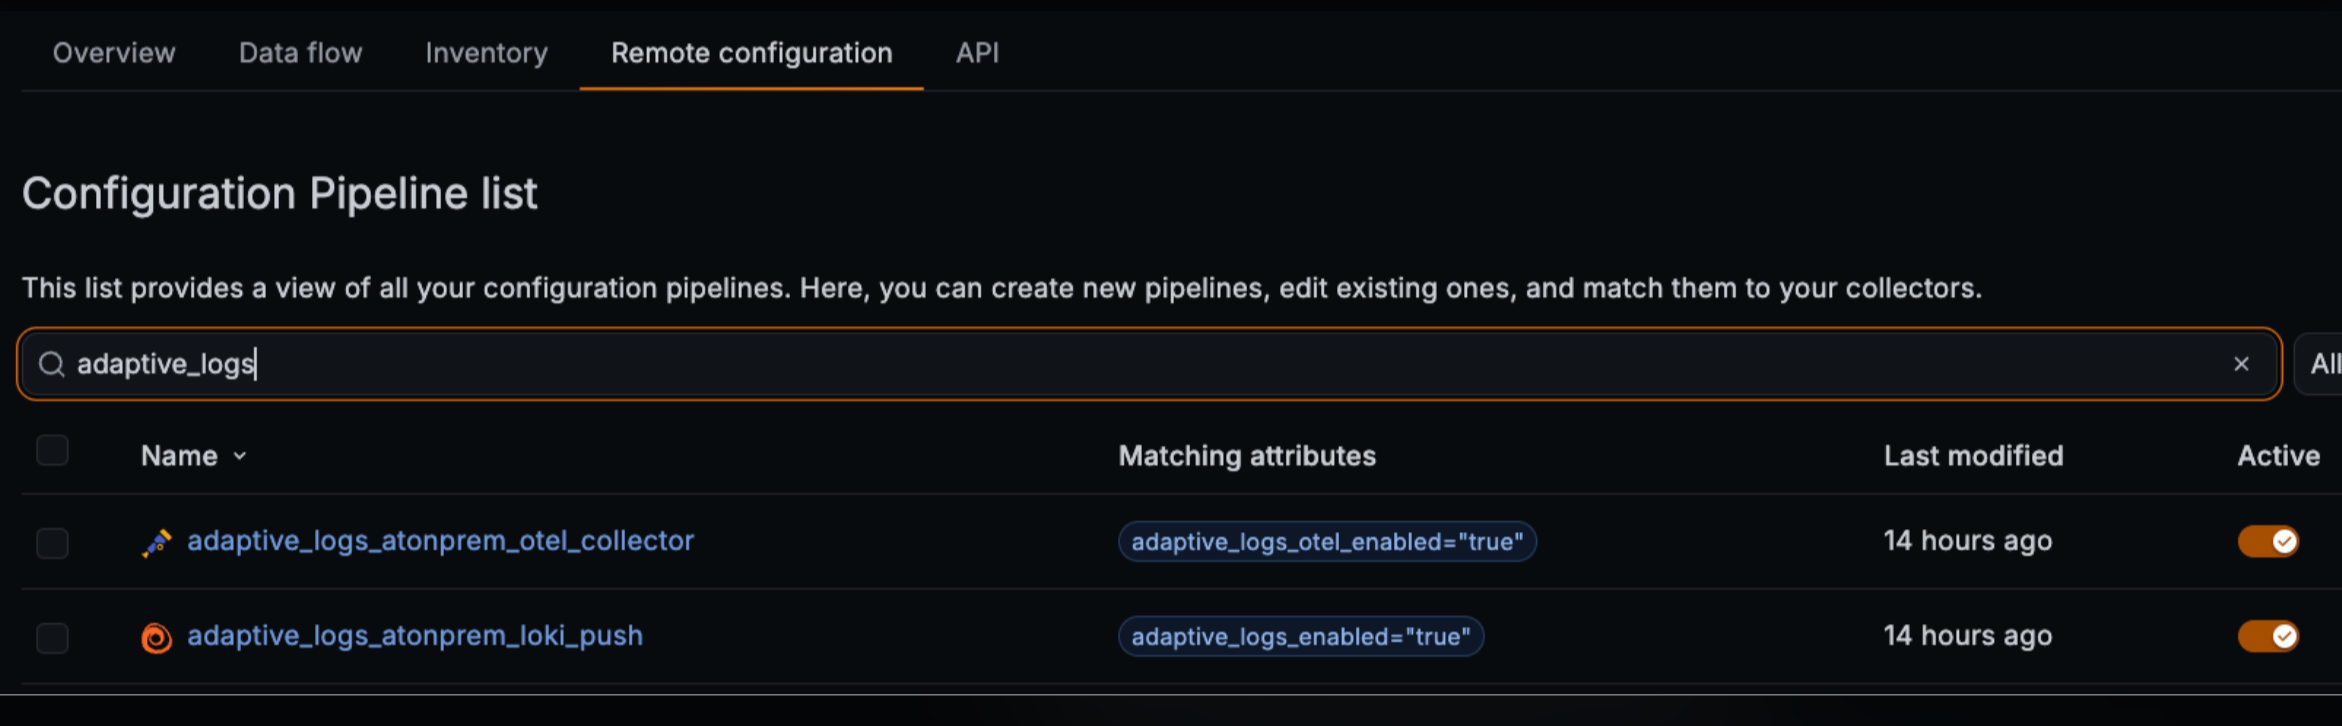
Make log ingest cost effective with fleet-managed Adaptive Logs! Now available in public preview, Adaptive Logs applies your drop rules and exemptions on collectors you already run, so matching logs are filtered before they leave your environment. Pattern drop rates still run in Grafana Cloud.
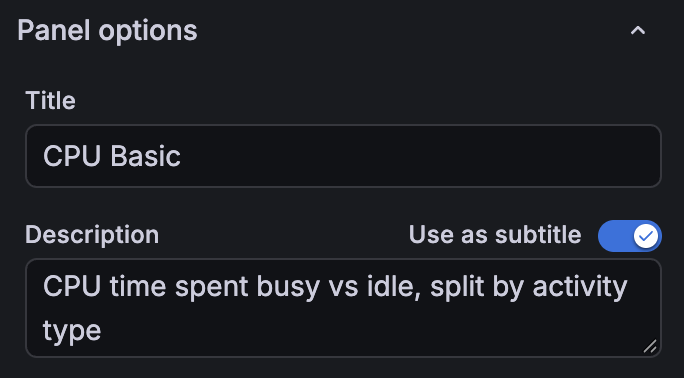
When a panel title needs more explanation, you can now display its description as a subtitle directly beneath it. This keeps context visible as you read the dashboard, helping you understand what a metric measures or how to interpret a chart.
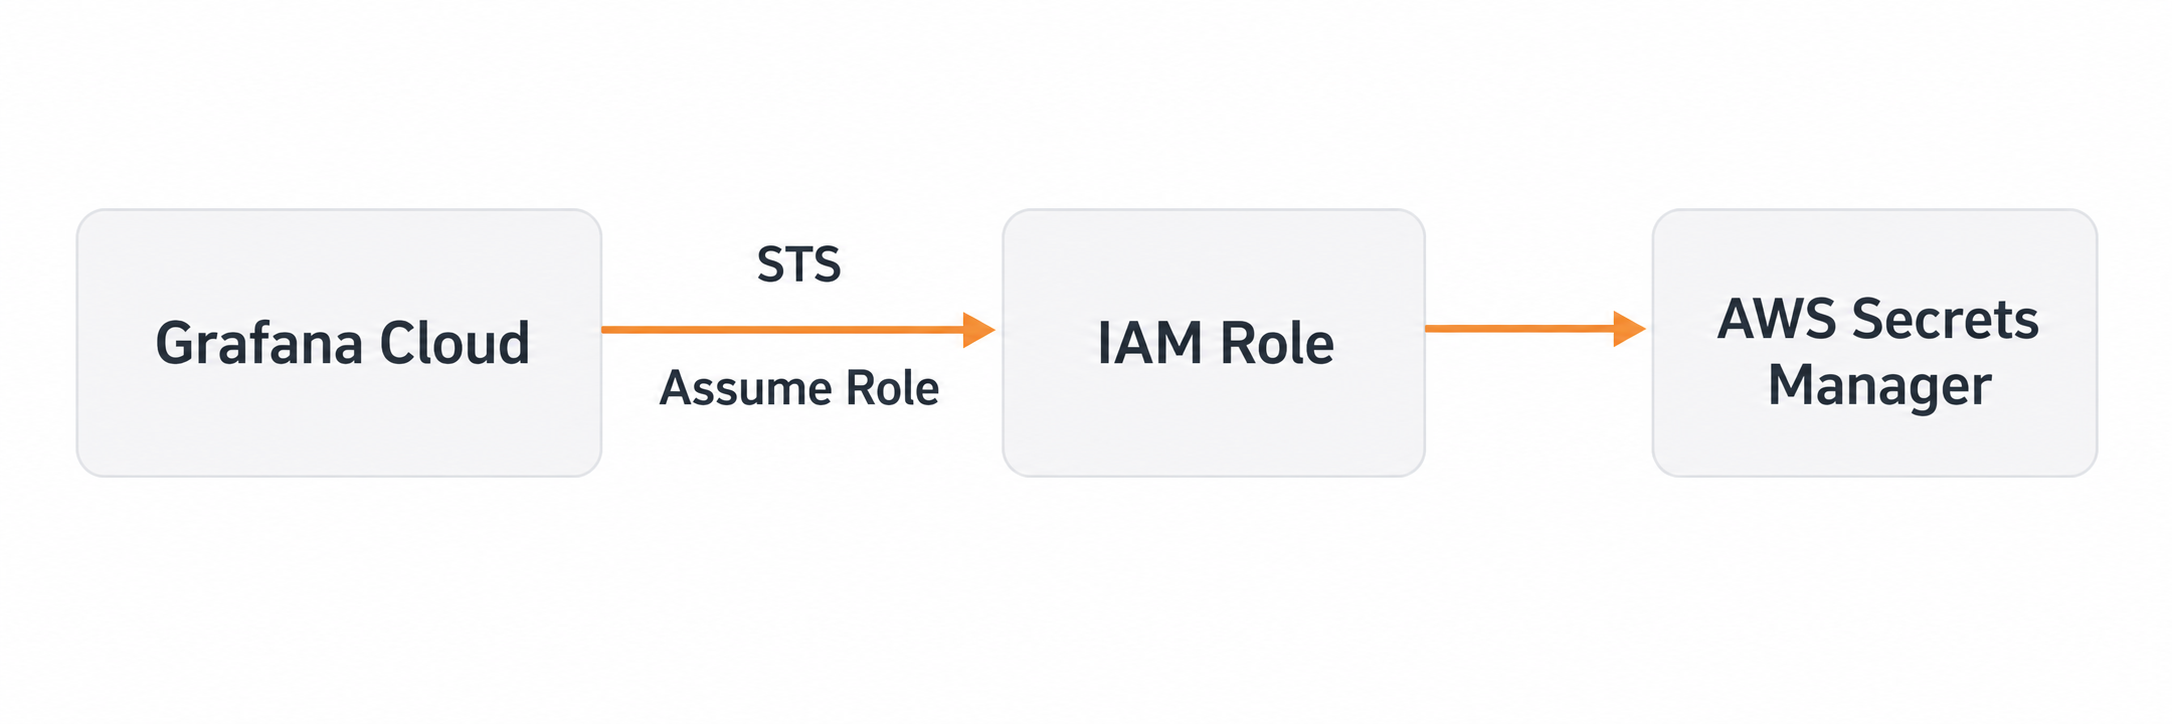
We’re excited to announce the general availability of secrets management in Grafana Cloud, along with a new AWS Secrets Manager integration. Secrets management gives you one safe place to store the API keys, tokens, and passwords that your Synthetic Monitoring checks and Grafana Cloud k6 tests need, so credentials never end up in your scripts.
With the AWS Secrets Manager integration, you don’t even have to store them in Grafana. Your secrets can stay in your own AWS account, under the IAM policies, rotation, and audit logging you already have, and Grafana fetches each value only at the moment a check needs it.
The Observability home page is now the default landing page when you select Observability in the Grafana main menu. It brings together your services, databases, frontend applications, Pods, and nodes in one view so you can see what needs attention across your entire stack without switching between individual products.

From a service in the entity catalog, open the SLO tab. If the service has no SLOs yet, Grafana suggests availability and latency targets from recent request, error and latency metrics. You can edit the name, target and window, choose a folder, optionally add burn-rate alerts and create the SLO. You can also create one manually. After you create SLOs, the tab shows their health, SLI and error budget on the same entity.

Every Service entity in the entity catalog carries an SLOs tab, so you can check whether a service is meeting its service level objectives (SLOs) while you investigate it, without switching to another app. The entity header carries an SLOs dropdown menu with a status dot, which gives you the same answer at a glance.
Each objective appears as a card with its measured service level indicator against target, the share of error budget remaining, and the absolute budget left in the compliance window. A Burning badge, and a banner at the top of the tab, tell you when a service consumes its error budget faster than allowed.
New Grafana Cloud organizations get Grafana Application Observability powered by the Grafana Cloud Knowledge Graph automatically. Host, Kubernetes, and Database Observability activate alongside it, so you get correlated, full-stack context on your services, infrastructure, and dependencies from the moment you start sending telemetry.
The knowledge graph replaces the classic Application Observability plugin for new organizations. It automatically discovers your services from OpenTelemetry data, surfaces performance insights, and connects metrics, logs, traces, and profiles in a unified view. You can also access the knowledge graph directly from the command palette.