What's new from Grafana Labs
Grafana Labs products, projects, and features can go through multiple release stages before becoming generally available. These stages in the release life cycle can present varying degrees of stability and support. For more information, refer to release life cycle for Grafana Labs.


Loading...
Area of interest:
Cloud availability:
Cloud editions:
Self-managed availability:
Self-managed editions:
No results found. Please adjust your filters or search criteria.
There was an error with your request.
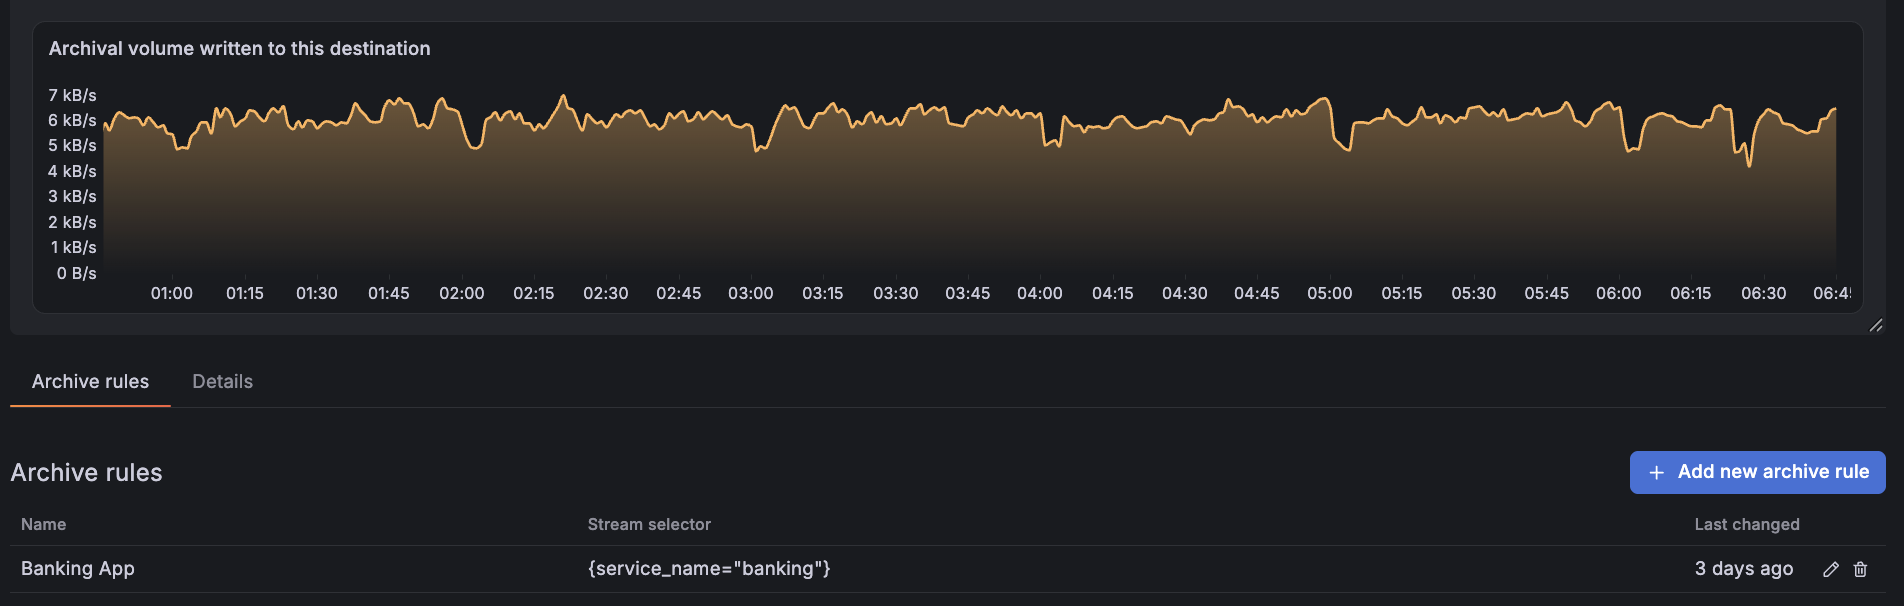
Improve logs economics by routing logs to your own object storage. Perfect for long term retention for logs needed for incidents, compliance, and auditing.
Private Data Source Connect (PDC) over Tailscale is now available in public preview. Securely query private data sources on your Tailscale network from Grafana Cloud, without needing to deploy and manage a PDC agent or expose endpoints to the public internet.
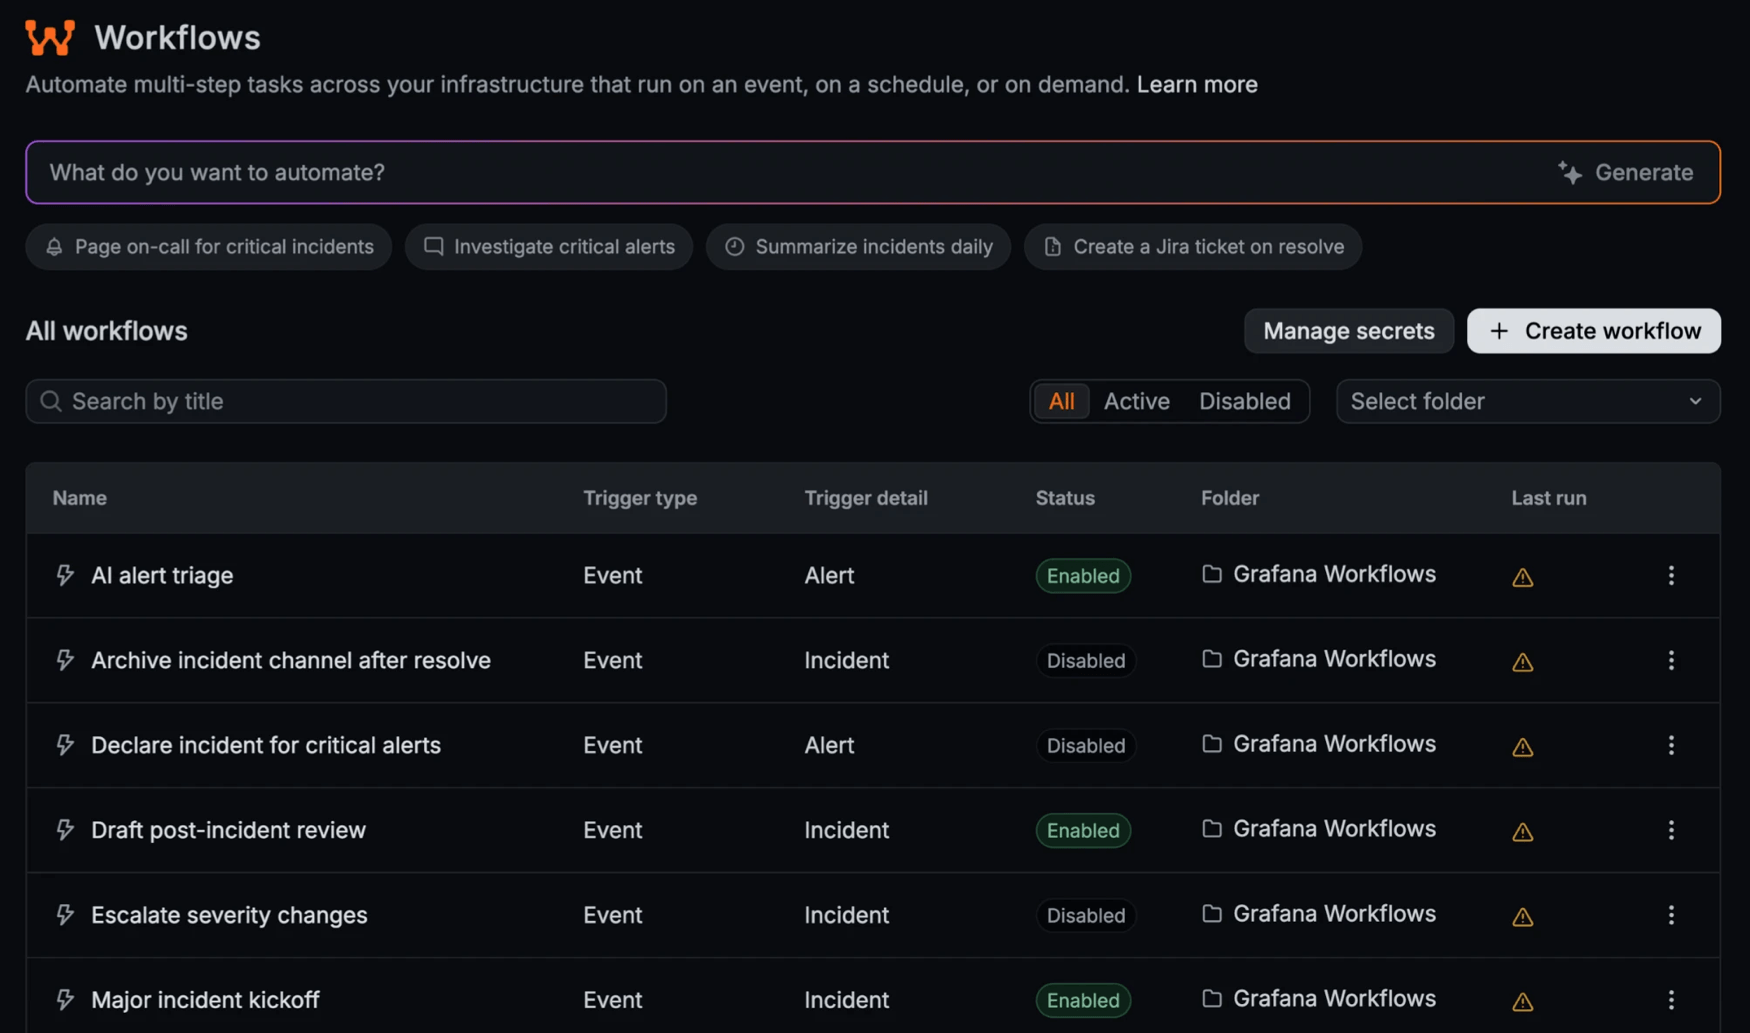
Grafana Workflows is now in public preview for all Grafana Cloud stacks. Workflows is an automation engine built into Grafana Cloud. You define a series of steps that run when something happens, on a schedule, or on demand.
Use it to automate the repetitive parts of incident response and operations, so your team can focus on fixing the problem.
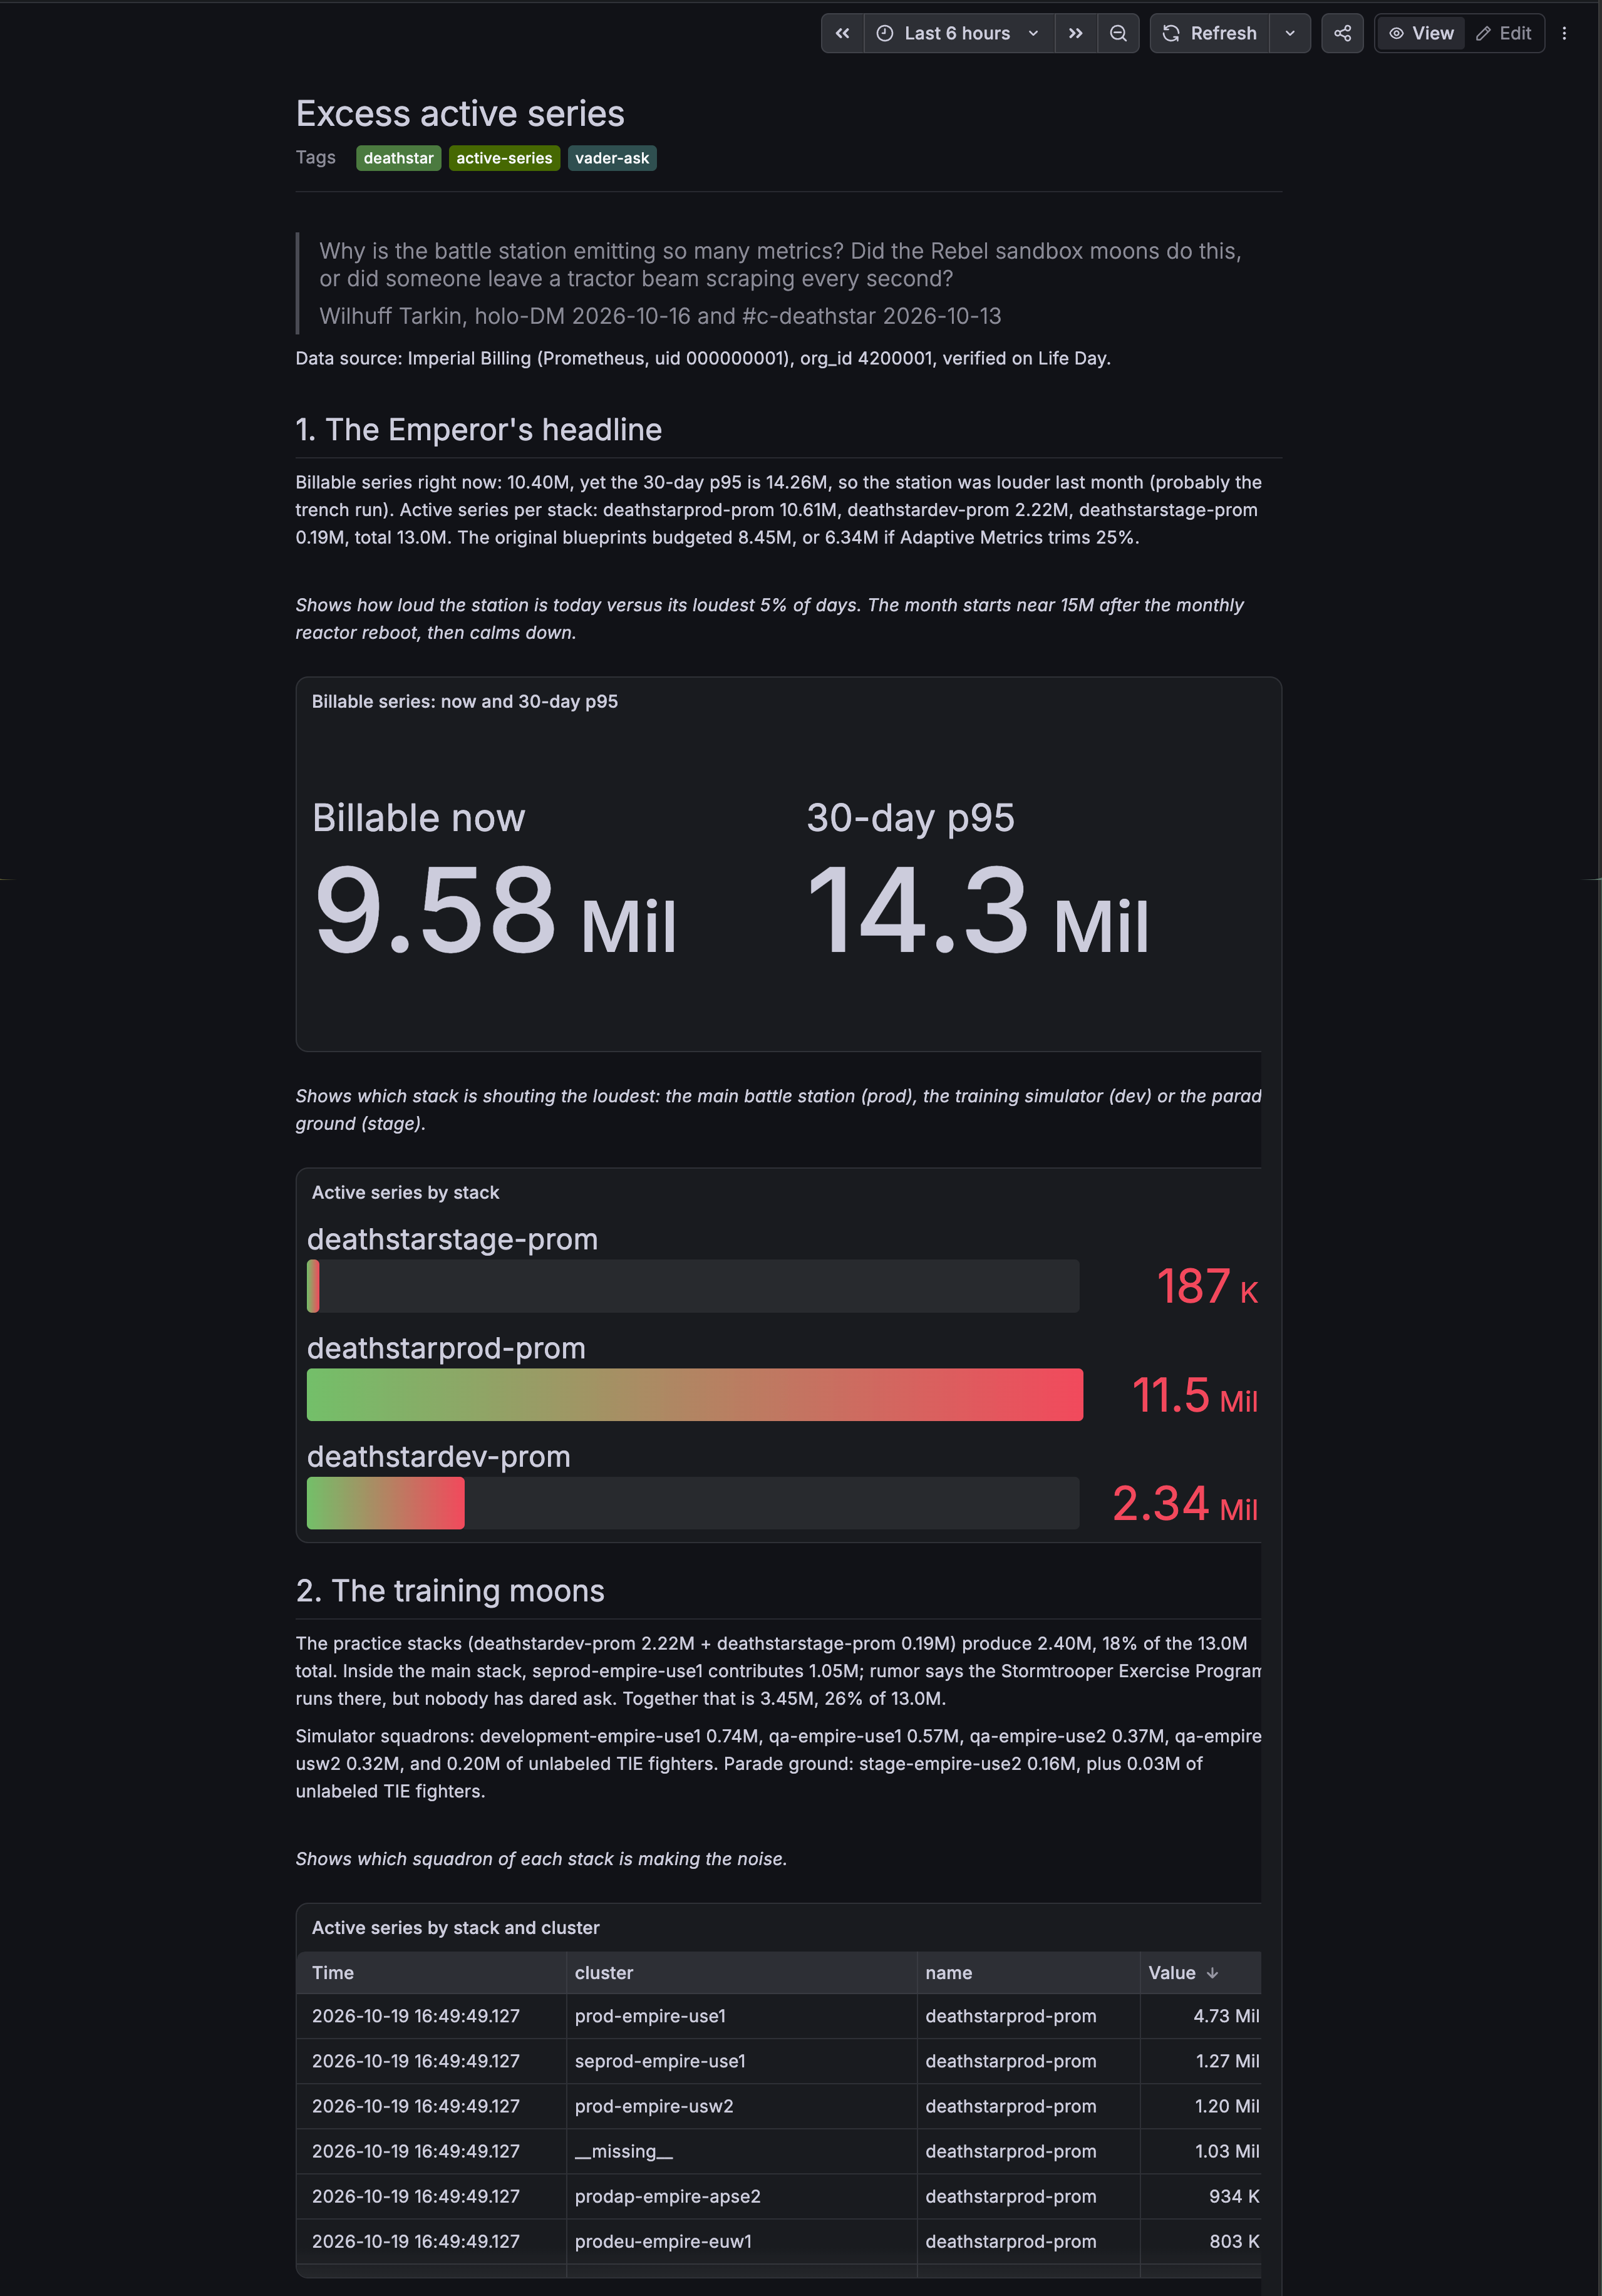
Bring dashboard panels, Explore queries, and Grafana Assistant findings into one editable notebook. Add your reasoning alongside the evidence, then share it so teammates can understand how you reached your conclusions.
Managing alert rules in Prometheus, Mimir, and Loki is moving into a dedicated Grafana app plugin, Prometheus Alerting. The plugin is built around how those systems actually work. It manages rule groups and namespaces in a Prometheus-compatible ruler, along with routes, receivers, templates, silences, time intervals, and inhibition rules in an external Alertmanager.
With the plugin installed and the hand-off enabled, Grafana routes data source managed alerting URLs to the matching page in the plugin. Shared links, bookmarks, and in-product links keep working — they land in the plugin instead of the core alerting UI. Grafana-managed alerting stays in core, and both experiences run side by side in the same Grafana instance.

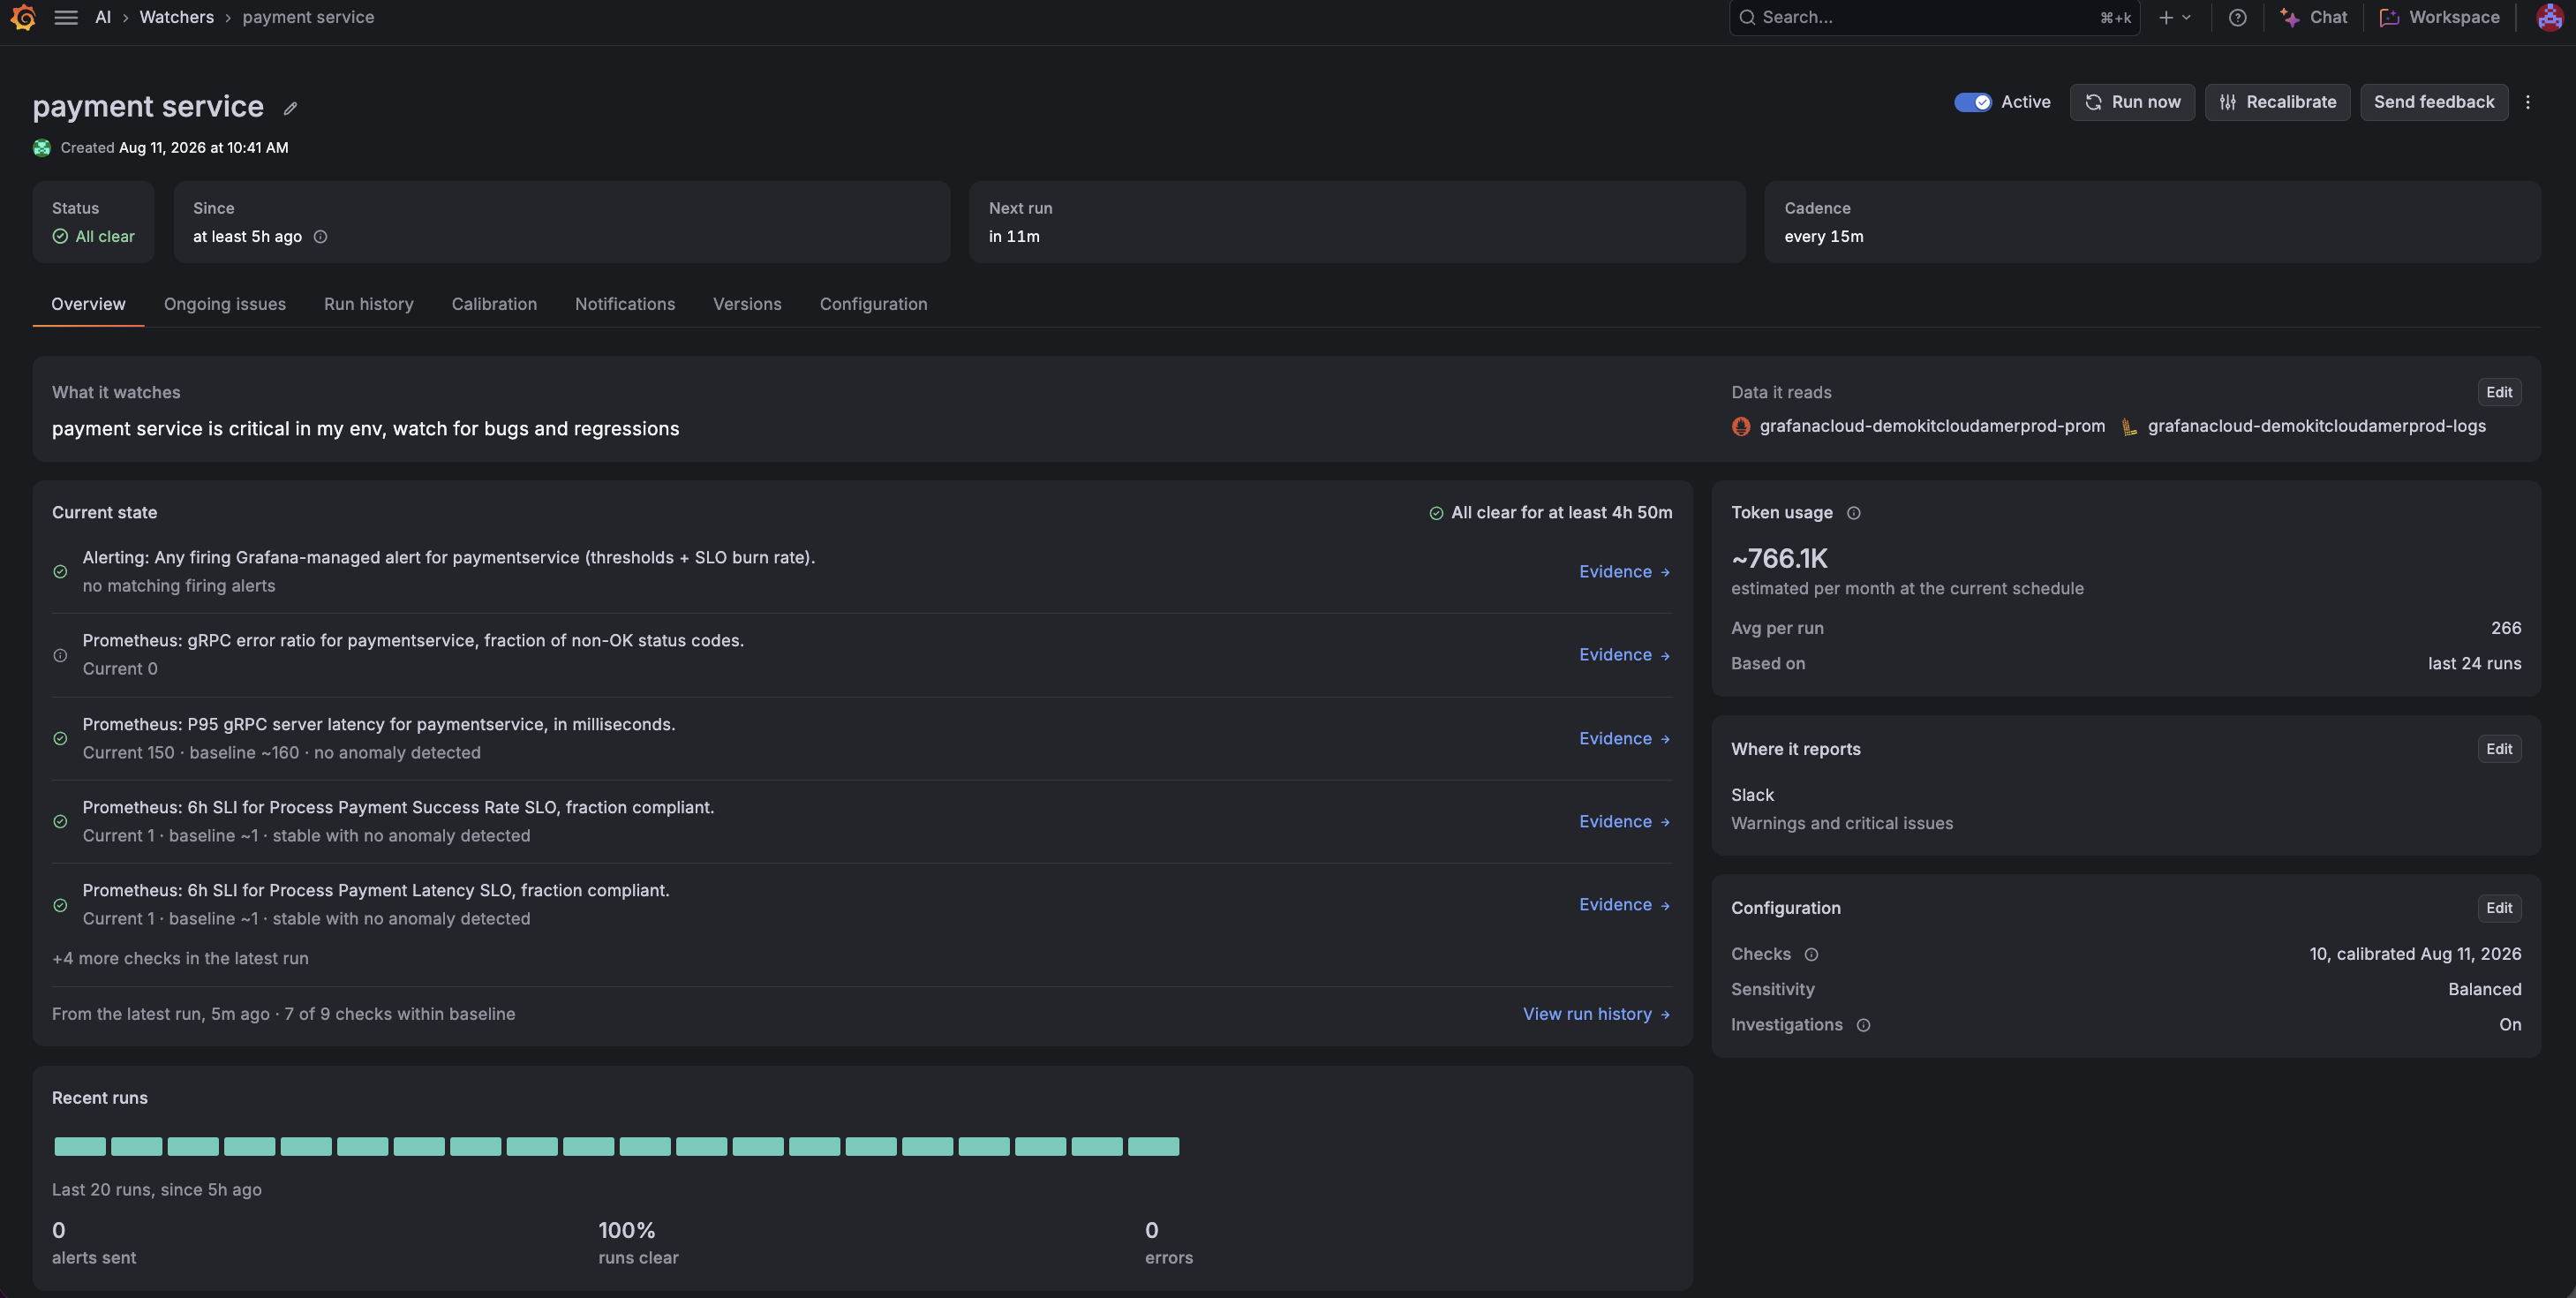
Assistant Watchers are now generally available. Watchers are always-on agents for the problems that are hard to write an alert rule for. You can’t always spell out every way something might go wrong, but you know what right looks like.
Describe it and pick your data sources. Assistant calibrates checks against your data in the background, so you can move on while it works. Once it’s ready, the watcher runs on a schedule and tells you when right starts drifting into wrong.
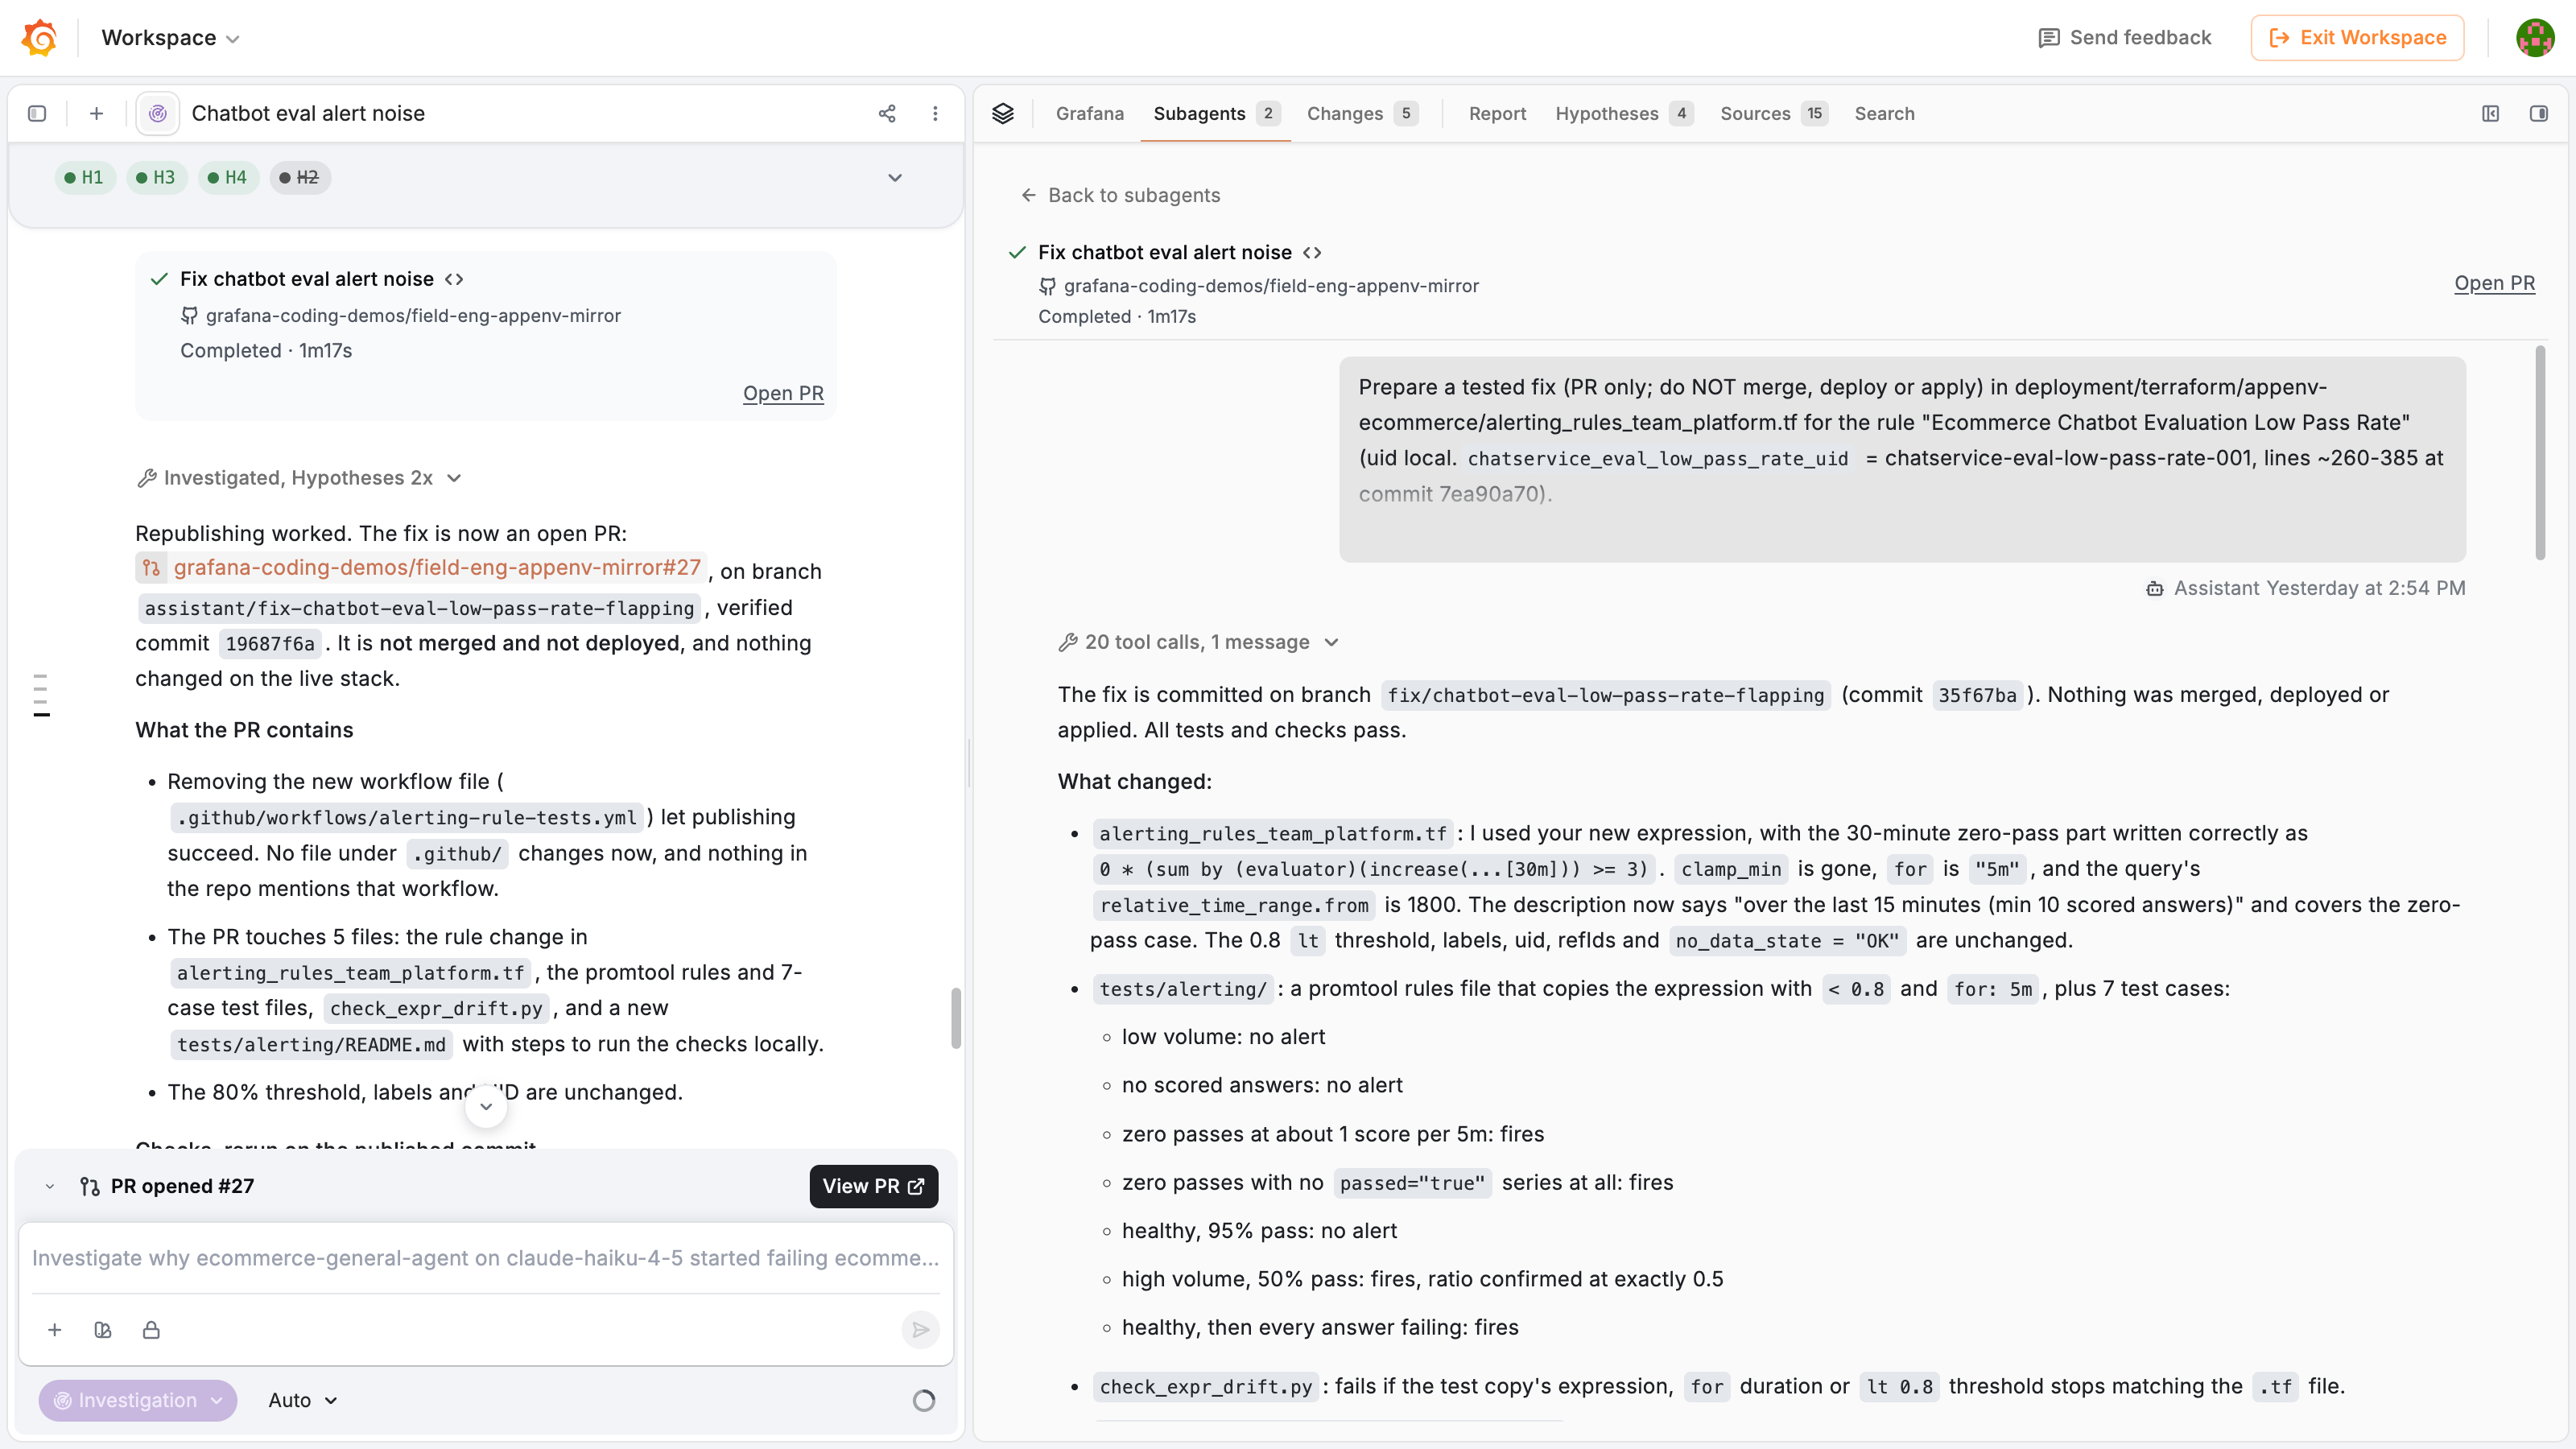
Observability usually stops at telling you what’s wrong. With Managed Sandboxes, now in public preview, Grafana Assistant can hand its diagnosis to a coding agent and get you to a fix. The agent gets the full context: the alert, the log lines, the traces, and the suspected commit. It runs within a sandbox in the cloud, so the work keeps going after you close your laptop.
In the sandbox, the agent reads your repository, edits the code, runs tests and builds, and commits to a branch. The diff shows up in Grafana next to the investigation, with a Create PR button. You stay in control, and Grafana never merges or deploys.
Your data shouldn’t have to fit in a panel. With Grafana Pages, now in public preview in Grafana Cloud, you describe what you want to see and Pages build it: a custom visualization, an app, a slide deck, or even a game. Pages are for the moments a dashboard can’t cover, like walking leadership through a launch, building a morning view of the services you own, or turning an incident into a story everyone can follow.
Every page runs on your real data, pulled from the data sources already connected to Grafana. There’s nothing to export or upload, no IDE, code, or deploy step, and you don’t need to be a developer. Anyone on your team can go from an idea to a page they can share in minutes.
You can now send OpenTelemetry traces straight to Agent Observability, without the SDK. If your agents already emit OpenTelemetry generative AI spans, from your framework, an instrumentation library, or spans you write yourself, keep your existing route through Grafana Alloy or an OpenTelemetry Collector and opt in your AI spans with a single attribute. Your agents then show up like any other service, next to the traces, metrics, and logs you already send to Grafana Cloud.
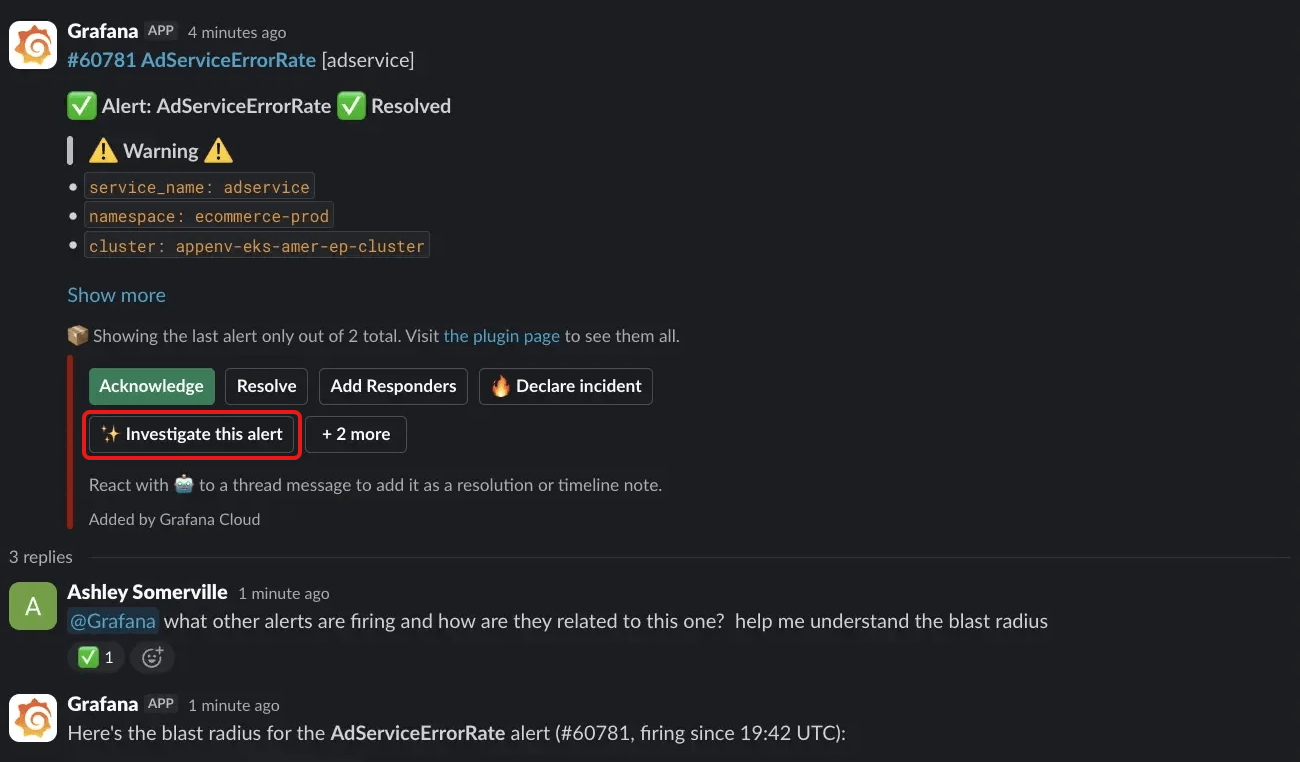
Grafana IRM brings Grafana Assistant into the places where you respond to alerts and incidents. Start an investigation and review what it found without switching tools.
Investigate an alert from Slack
Click Investigate this alert on an IRM alert group message in Slack. Grafana Assistant then does the following:
- Summarizes what’s firing and its current status.
- Checks for related incidents and other firing alerts.
- Assesses the blast radius and impact.
- Suggests next steps for triage.
Assistant replies in the alert group’s thread so the whole team can see it.
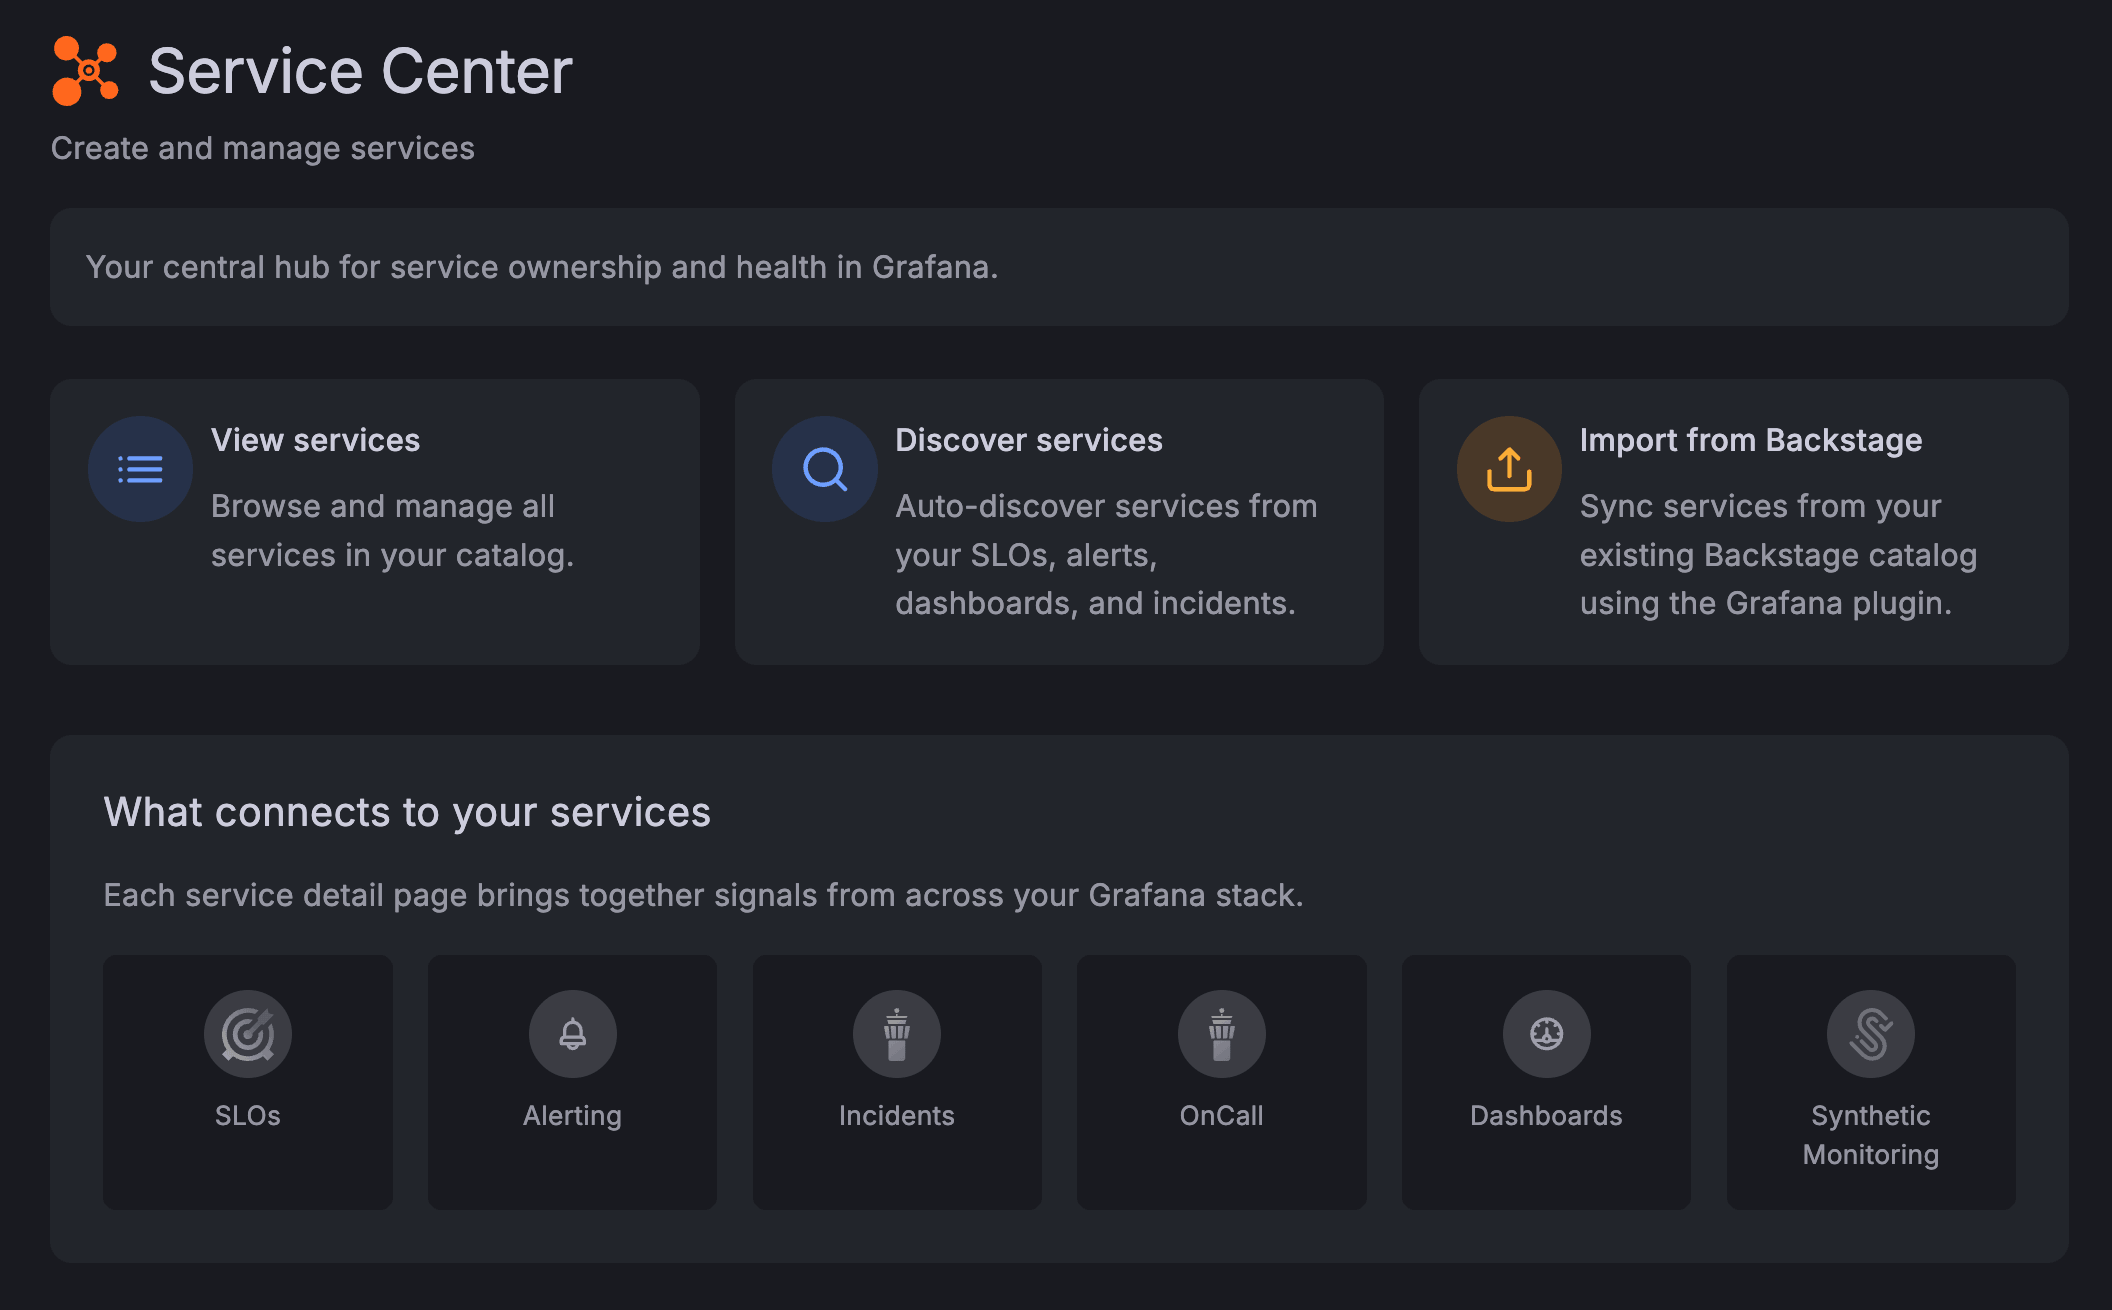
Service Center in Grafana Cloud brings a service’s SLOs, alerts, incidents, on-call activity, dashboards, and synthetic checks into one view. You now have more ways to get your services into Service Center and keep them organized.
Find your services faster
A new Service Center home page links to the main actions: view services, discover services, or import from Backstage.
In the service list, star your favorite services and filter by name, team, identifier, starred services, or My teams. Recently viewed services are one click away. Filters are saved in the URL, so you can bookmark or share a filtered view.
Discover services automatically
The Discover services page scans your SLOs, alerts, dashboards, incidents, and synthetic checks for services you haven’t added yet. Choose the label that ties them together, such as service_name, service, job, namespace, app, team, or a custom key. Set a naming pattern with a live preview, and create the services you want in bulk.
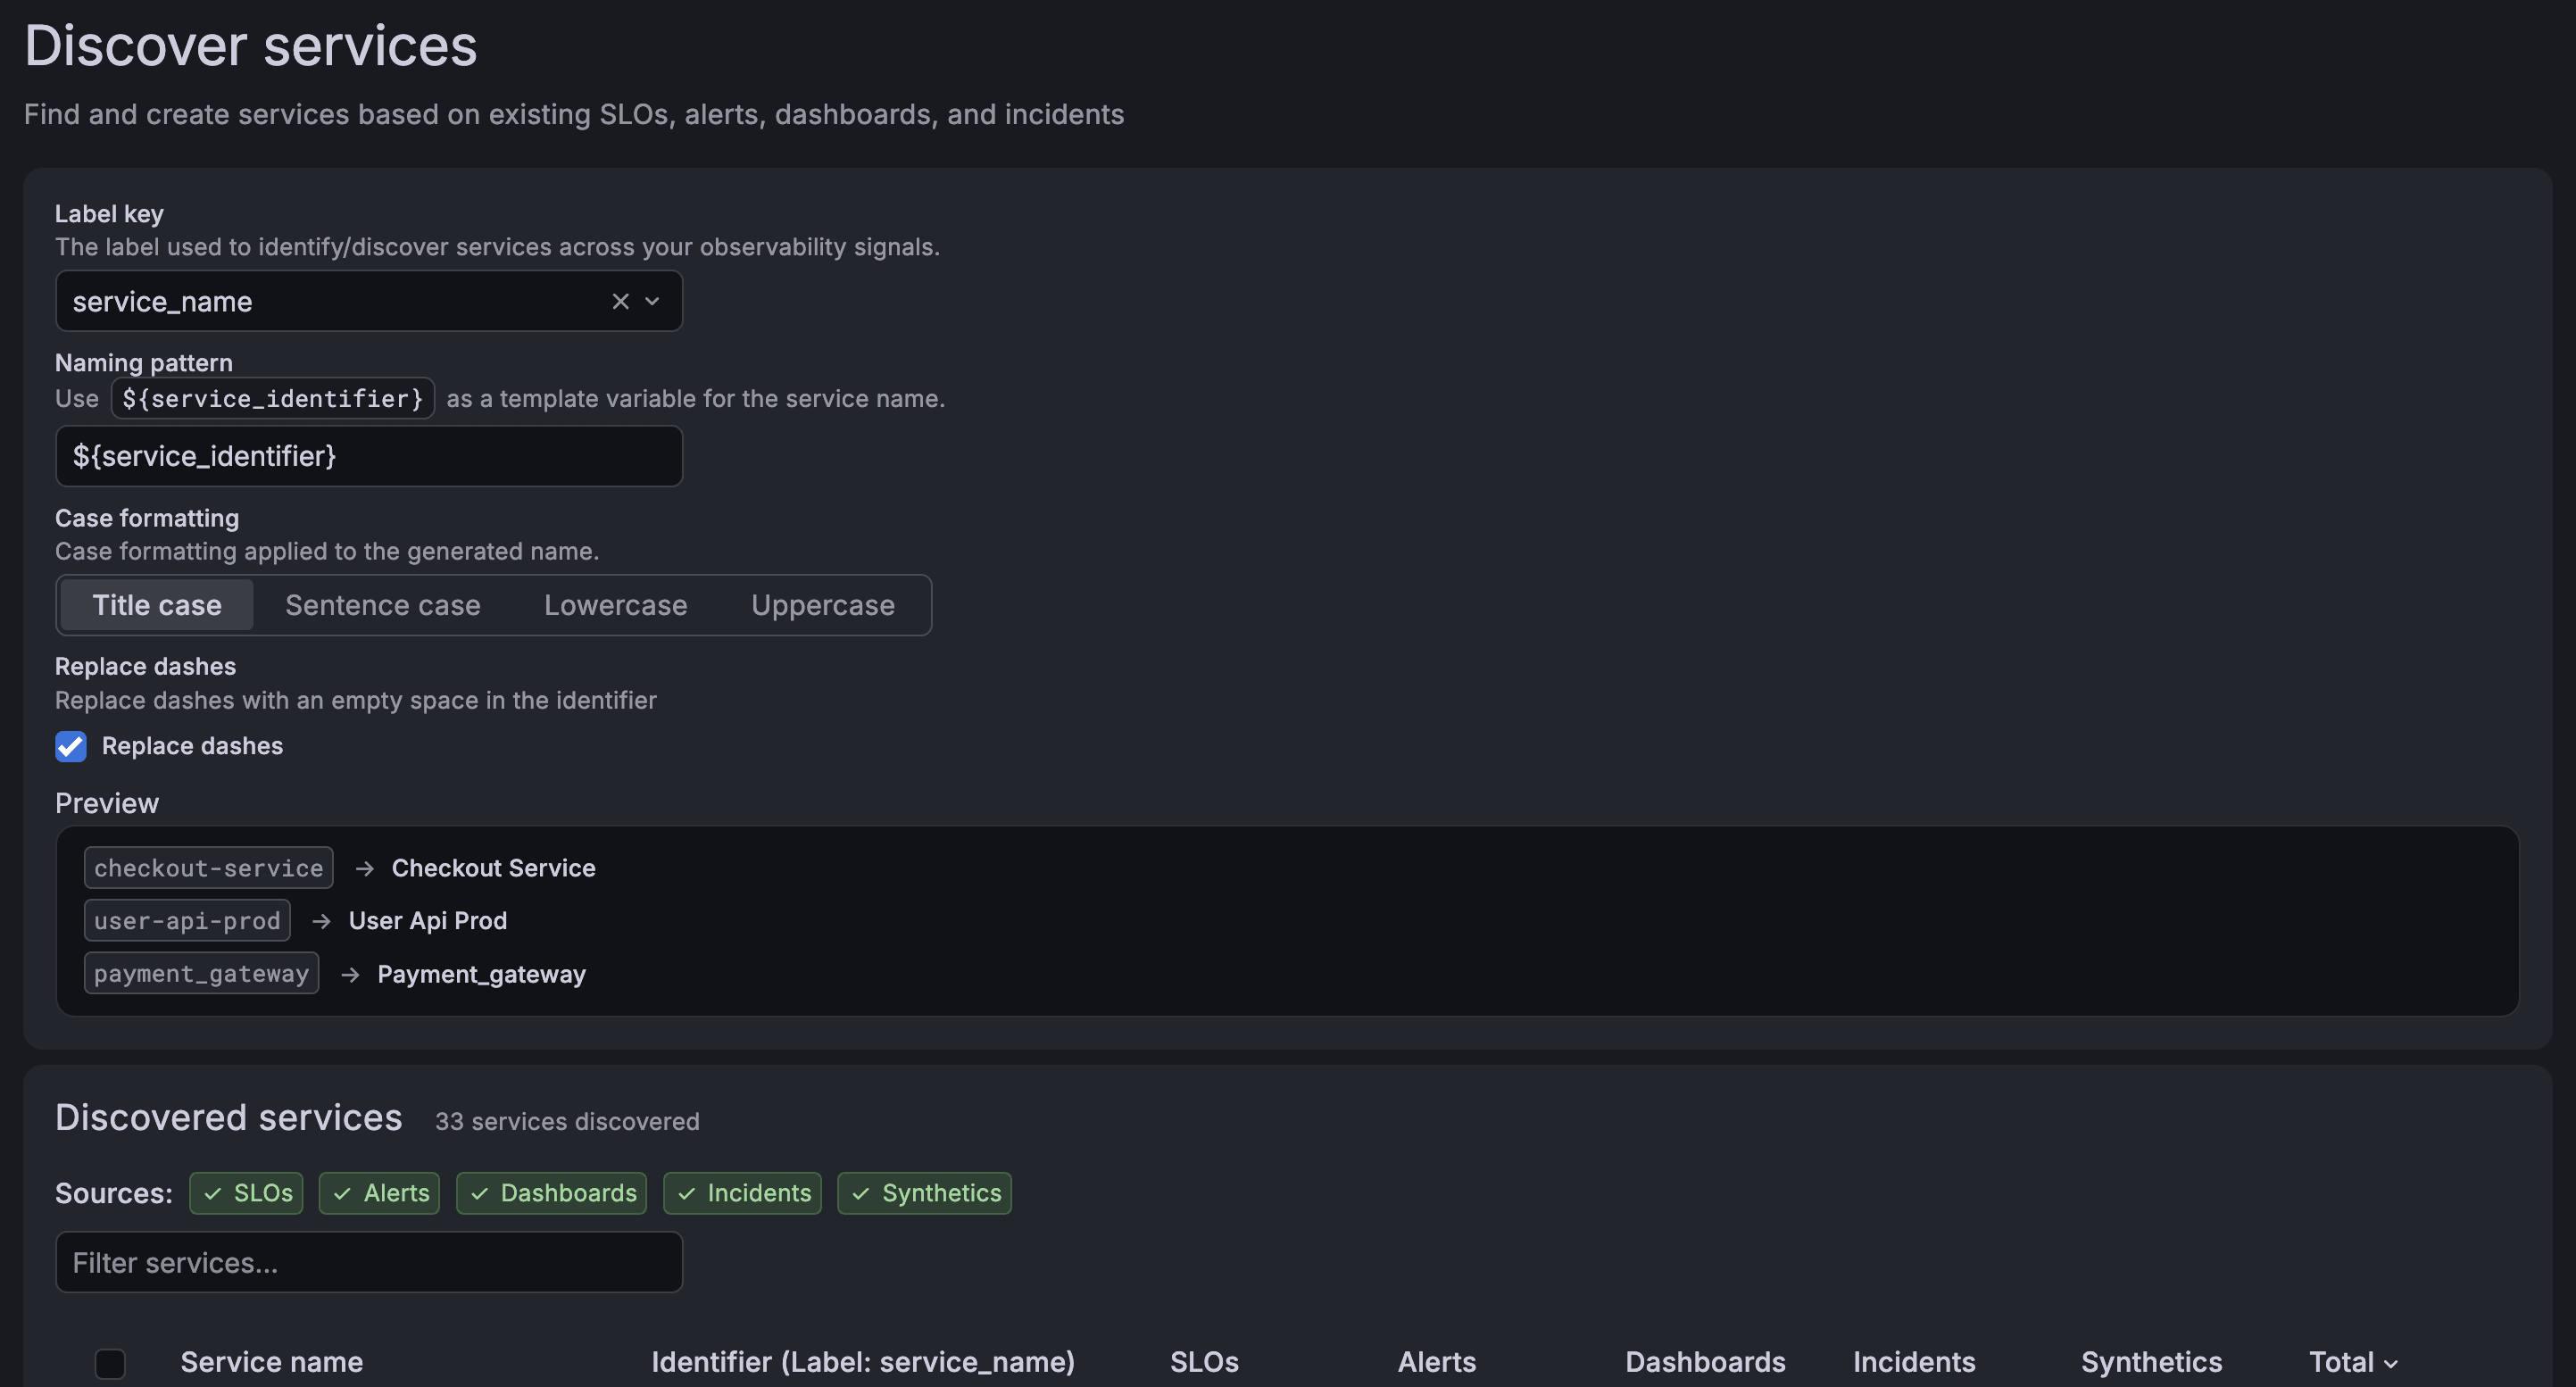
To learn more, refer to Discover services.
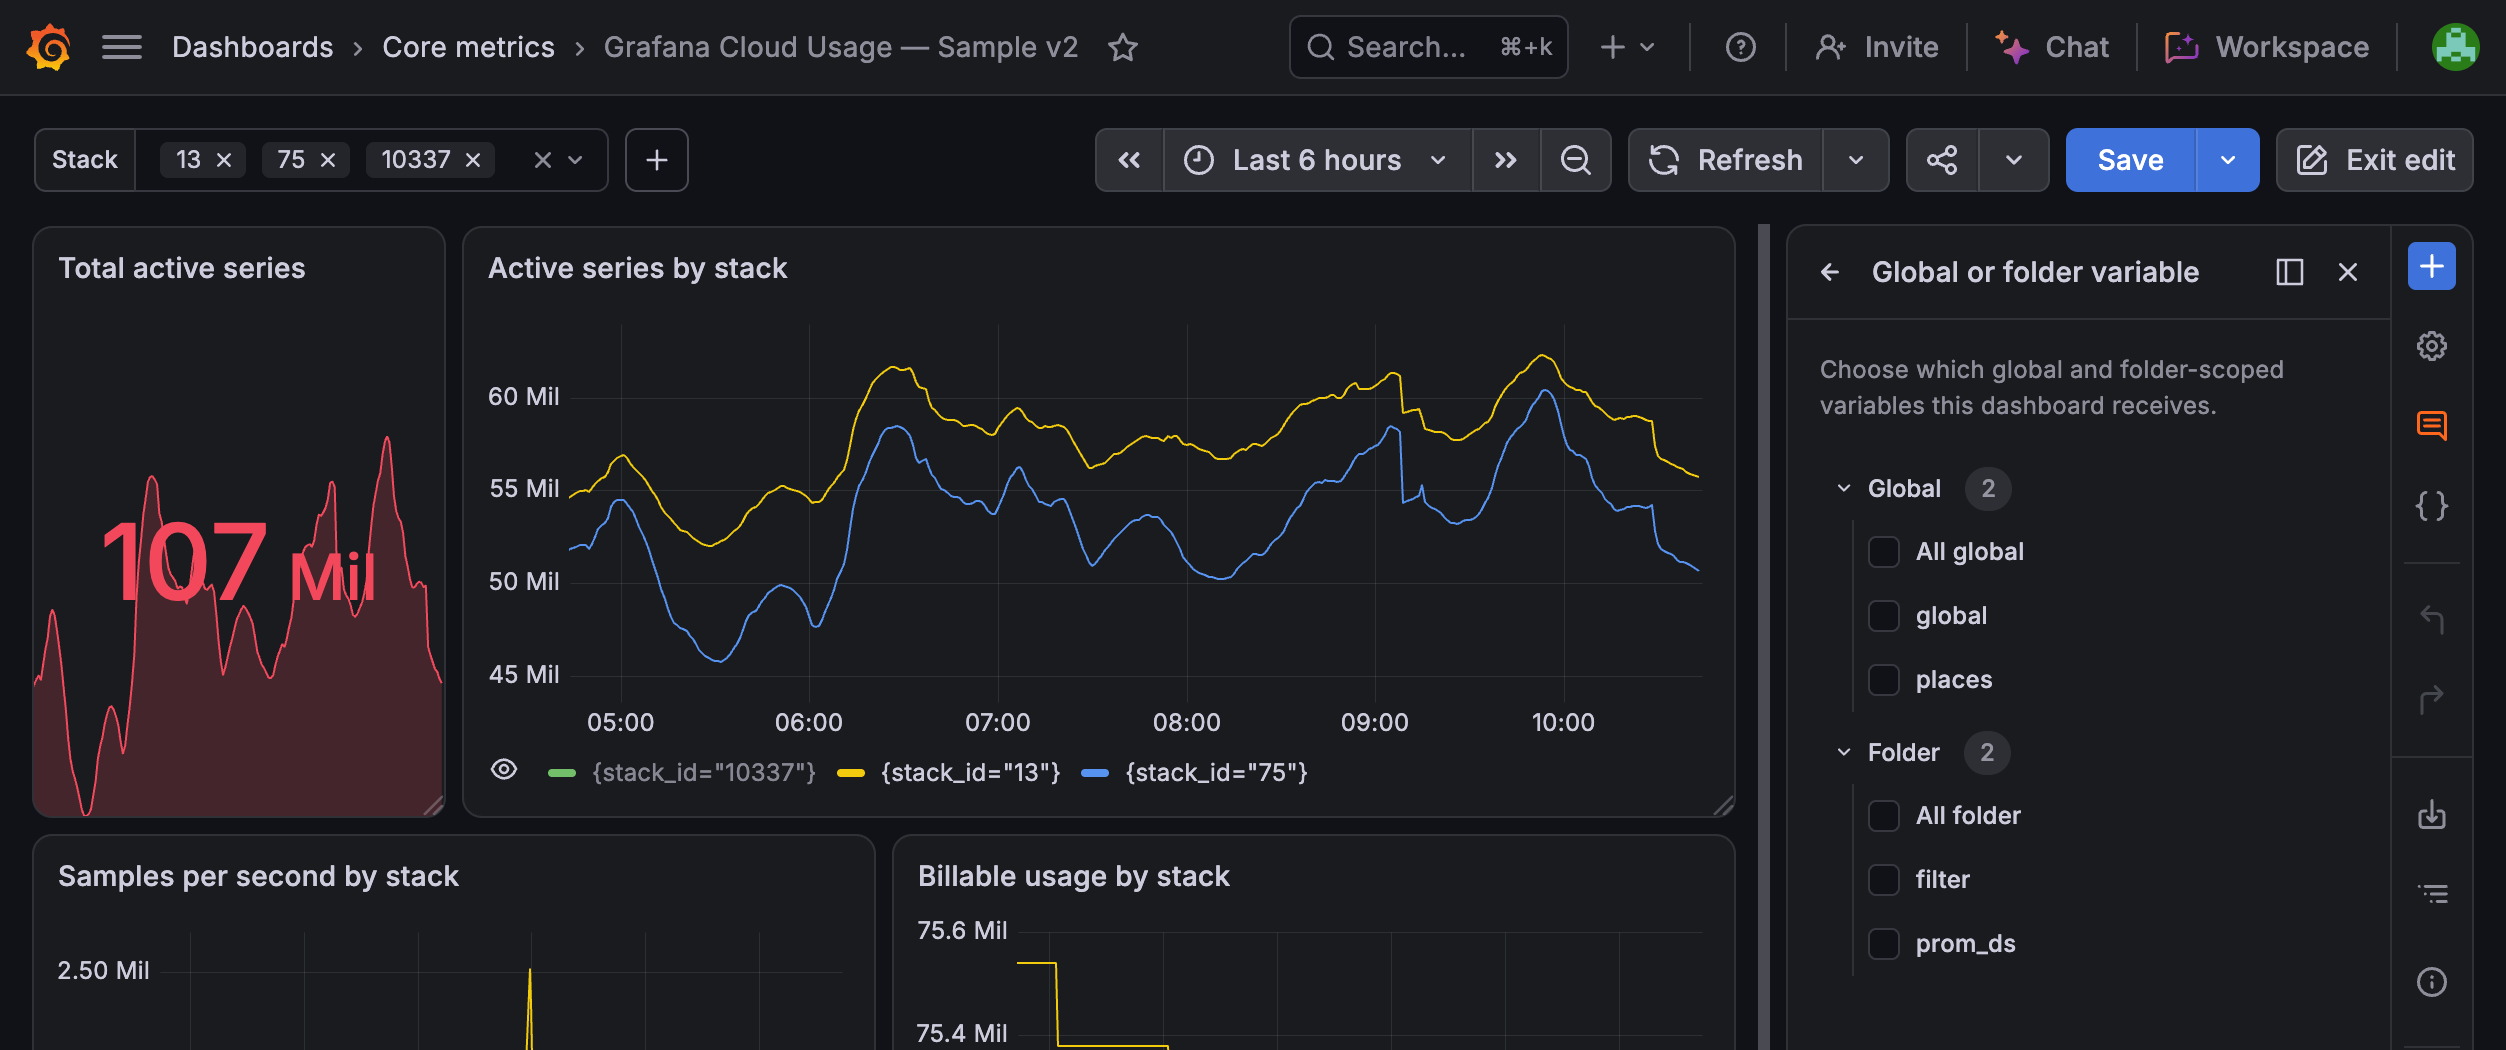
When multiple dashboards use the same variable, creating and maintaining it separately in each dashboard can lead to duplicated work and inconsistent configuration. Cross-dashboard variables let you define a variable once and reuse it across multiple dashboards in your Grafana organization.
Create and manage cross-dashboard variables from Dashboards > Variables. You can scope a variable in either of two ways:
- Global: Available to all dashboards in the organization.
- Folder: Available only to dashboards in the same folder.
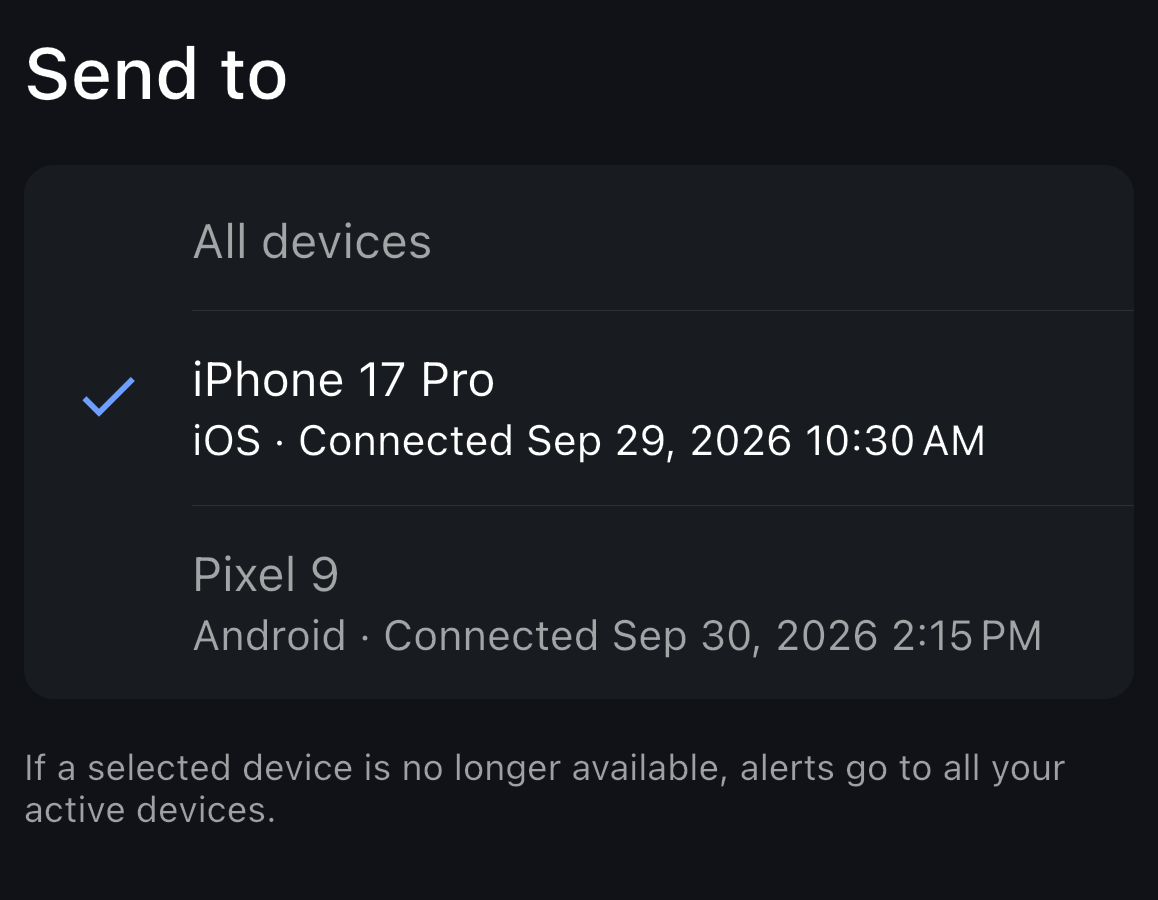
When you use the Grafana mobile app on more than one device, you might want alerts on the phone you carry while your other devices stay quiet. For each mobile push notification step, you can now choose which paired device receives alerts, or keep sending them to all your active devices. You can manage this in the Grafana mobile app or on the Mobile app tab of your Grafana user profile.
You can now improve your alert rule quality with the Alert Advisor. Alert rules are easier to act on when they carry the right context, like a runbook URL to guide investigation or a team label to route notifications. With the Alert Advisor in Grafana, you can:
- Define which labels and annotations are required for Grafana-managed alert rules.
- Find rules with missing required labels or annotations and update them.
- Optionally enforce selected requirements on supported provisioning writes.
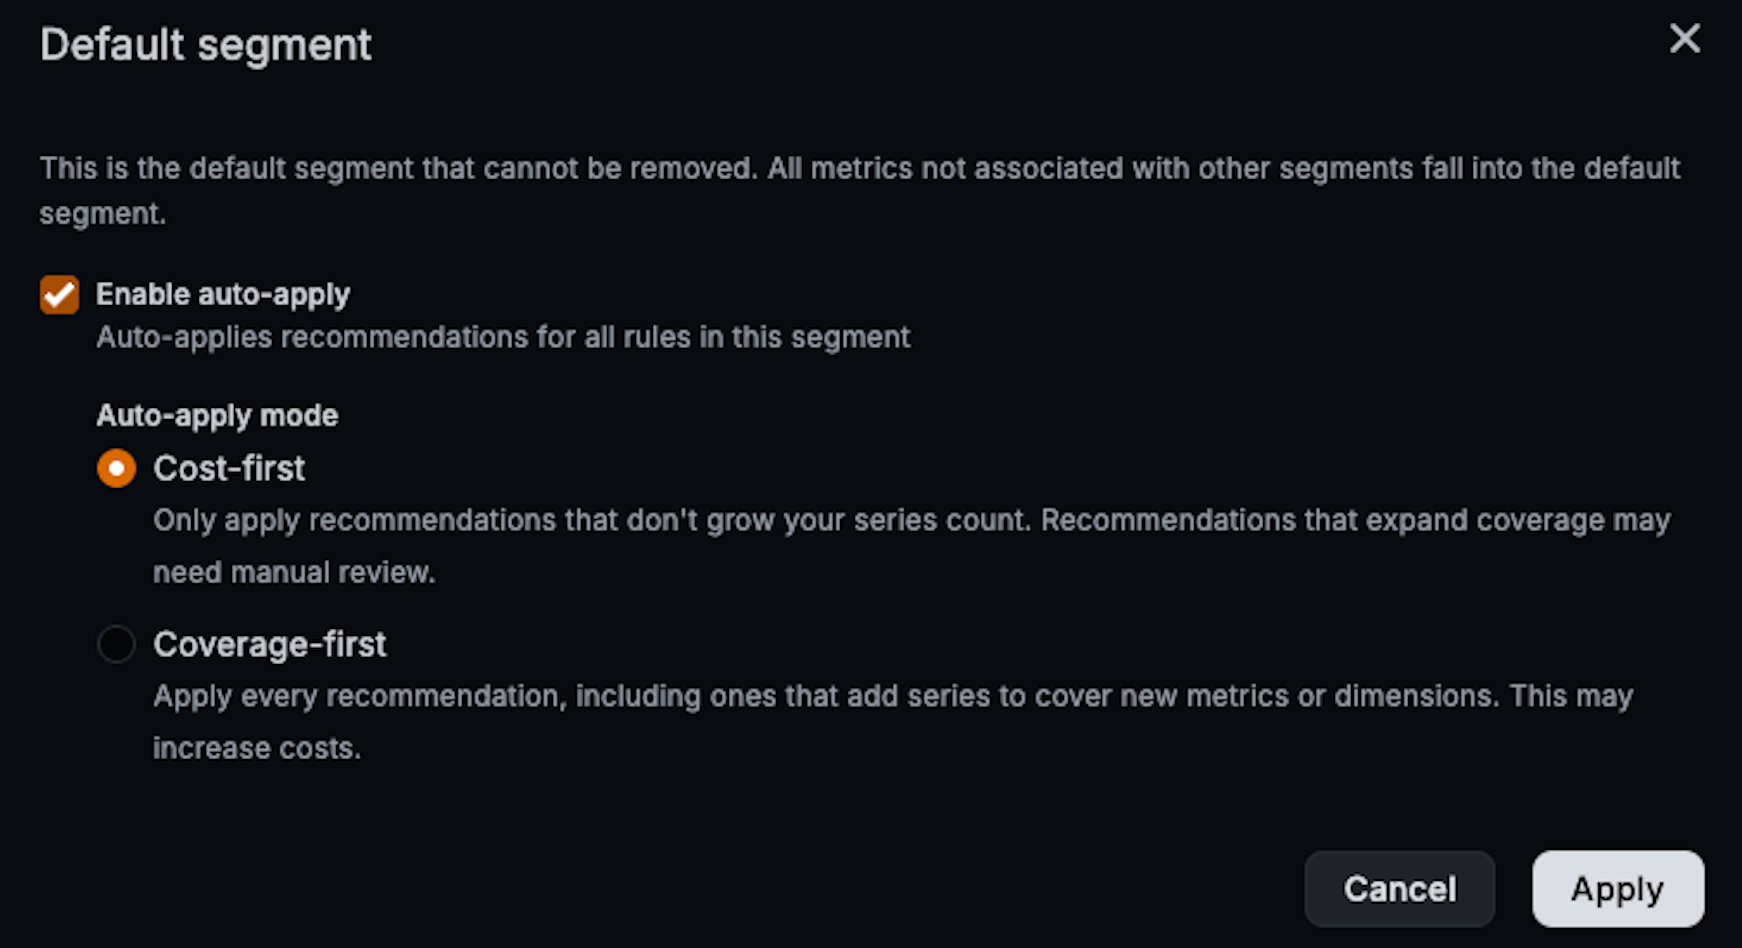
Auto-apply is now generally available! By enabling auto-apply, Grafana Cloud Adaptive Metrics automatically applies recommendations for segments, so you don’t have to review the list after every analysis.
To get started, enable auto-apply for the Default segment if you haven’t created any segments yet. If you already have segments, enable it for multiple segments or for an individual segment, and choose Coverage-first or Cost-first.