
 More control over how you explore and display table data

More control over how you explore and display table data
Wide, dense tables can make it difficult to find relevant information and present it clearly. We’ve updated Grafana’s core table visualization with more control over filtering, column layout, and readability, bringing more of the table capabilities you need directly into your dashboards.
The updates include:
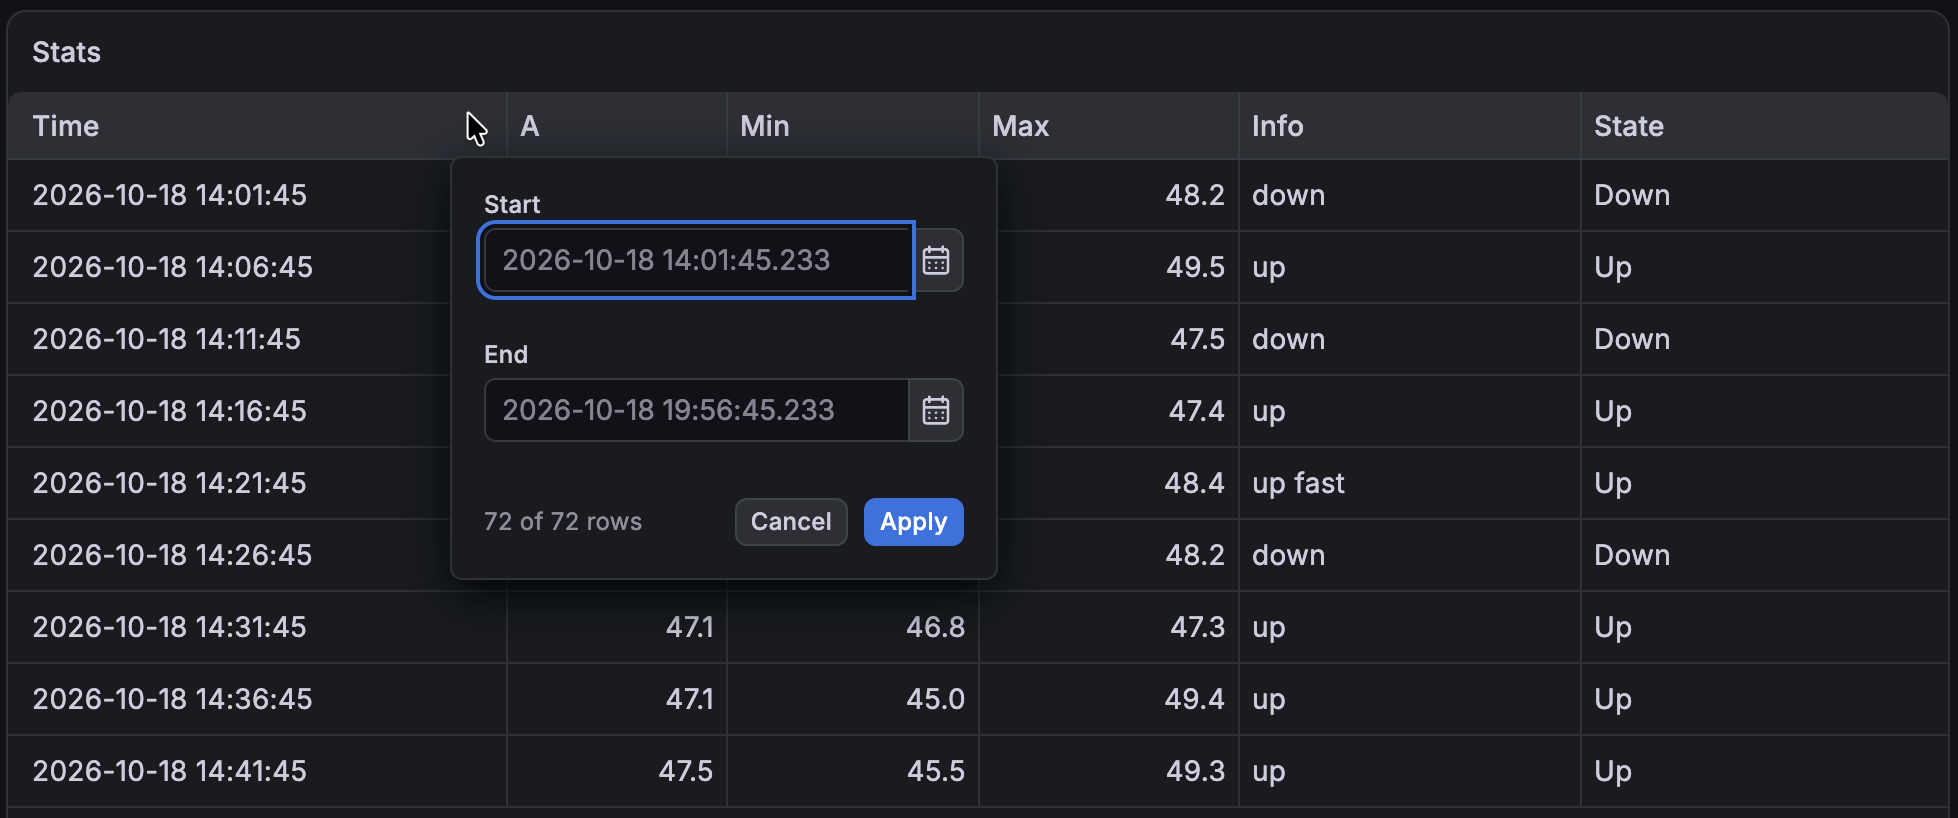
Focus on relevant data: Column filtering is now available by default. Select specific values, use a slider or minimum and maximum values to filter numeric ranges, or set start and end dates to filter date ranges.
![Time filter]()
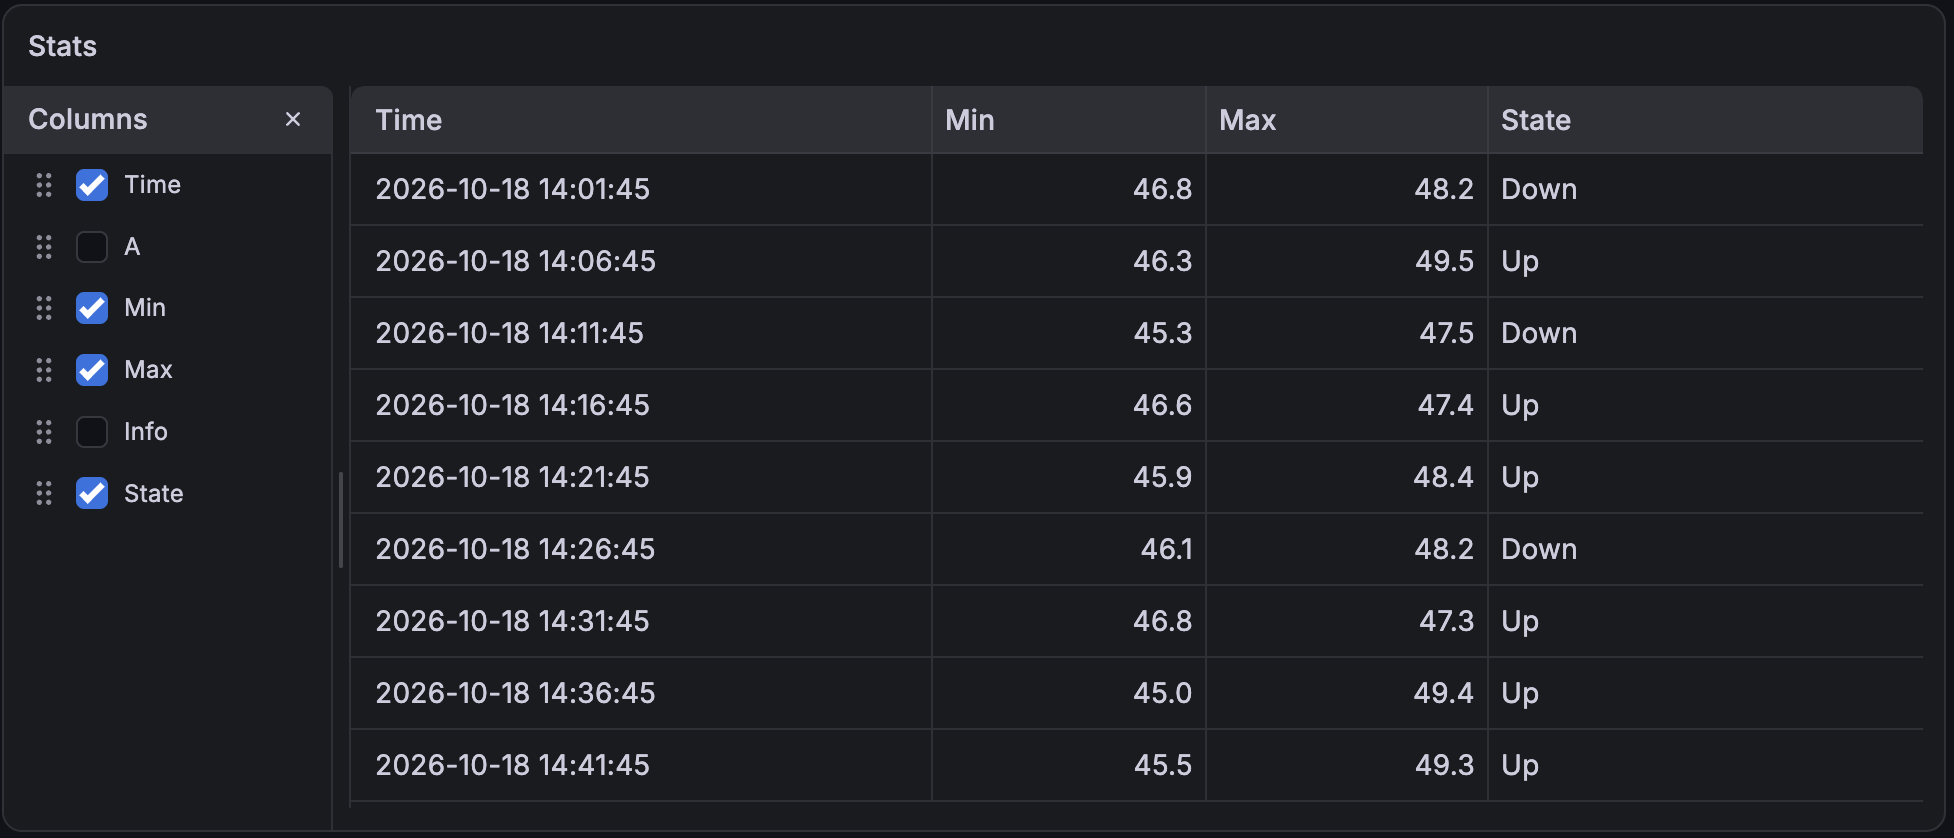
Put the columns you need in view: Use the new column management sidebar to hide, show, and reorder columns.
![Column management sidebar]()
Save or reset your table view: An eye icon indicates unsaved changes when you show, hide, reorder, or filter columns. Dashboard editors can select Save changes to apply these changes as panel transformations without building them from scratch. Both editors and viewers can select Remove changes to return to the saved view.
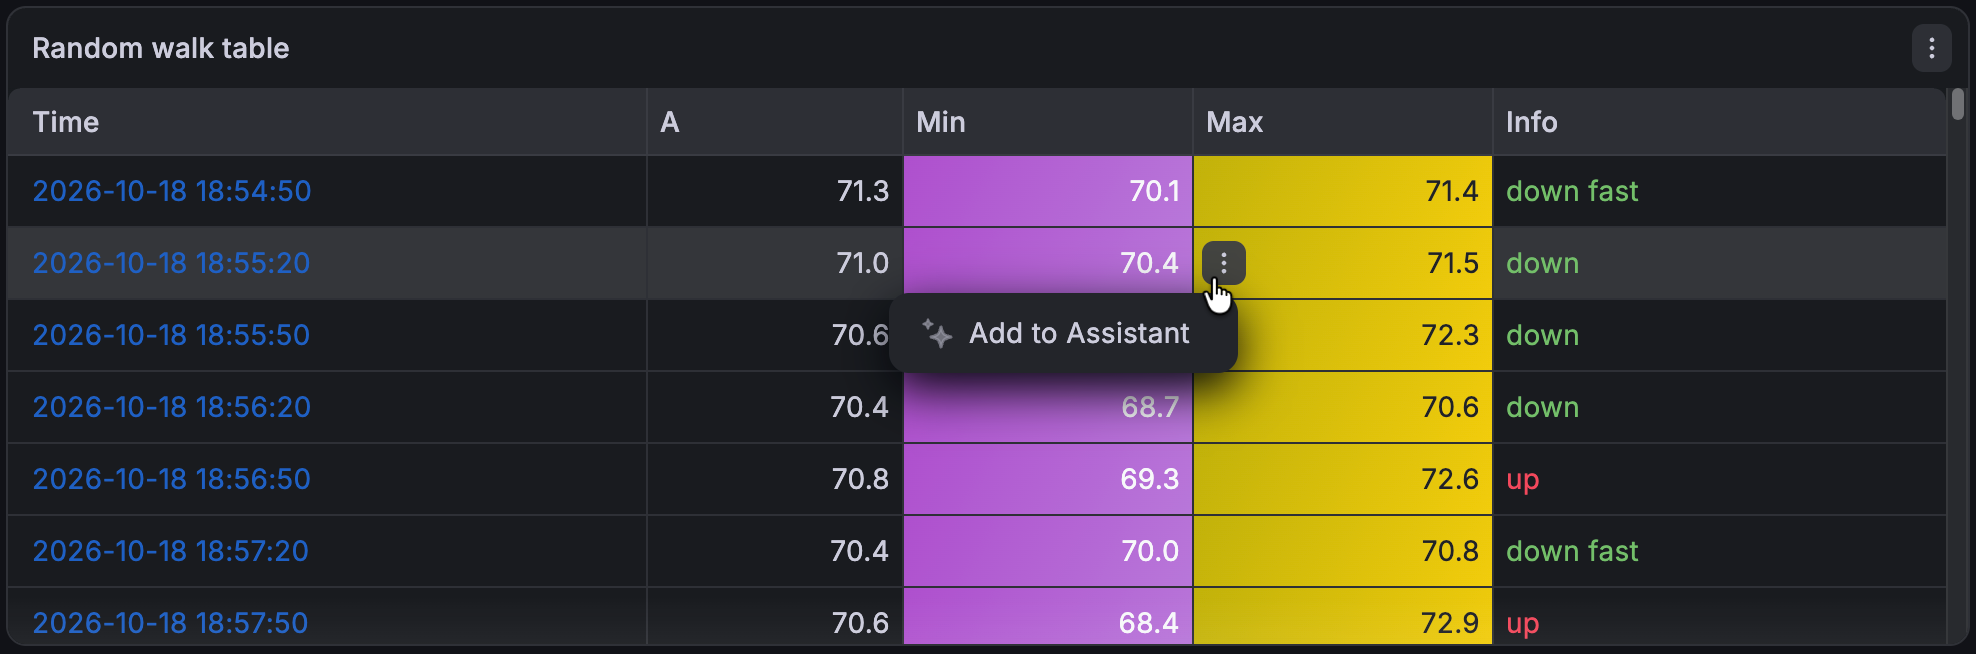
Updated cell controls: When enabled, value inspection and filtering actions are now grouped in a menu that appears when you hover over a cell, replacing the separate icons.
Spend less time adjusting column widths: Grafana now sizes columns based on their contents and the table’s width.
Make tables easier to read: Enable:
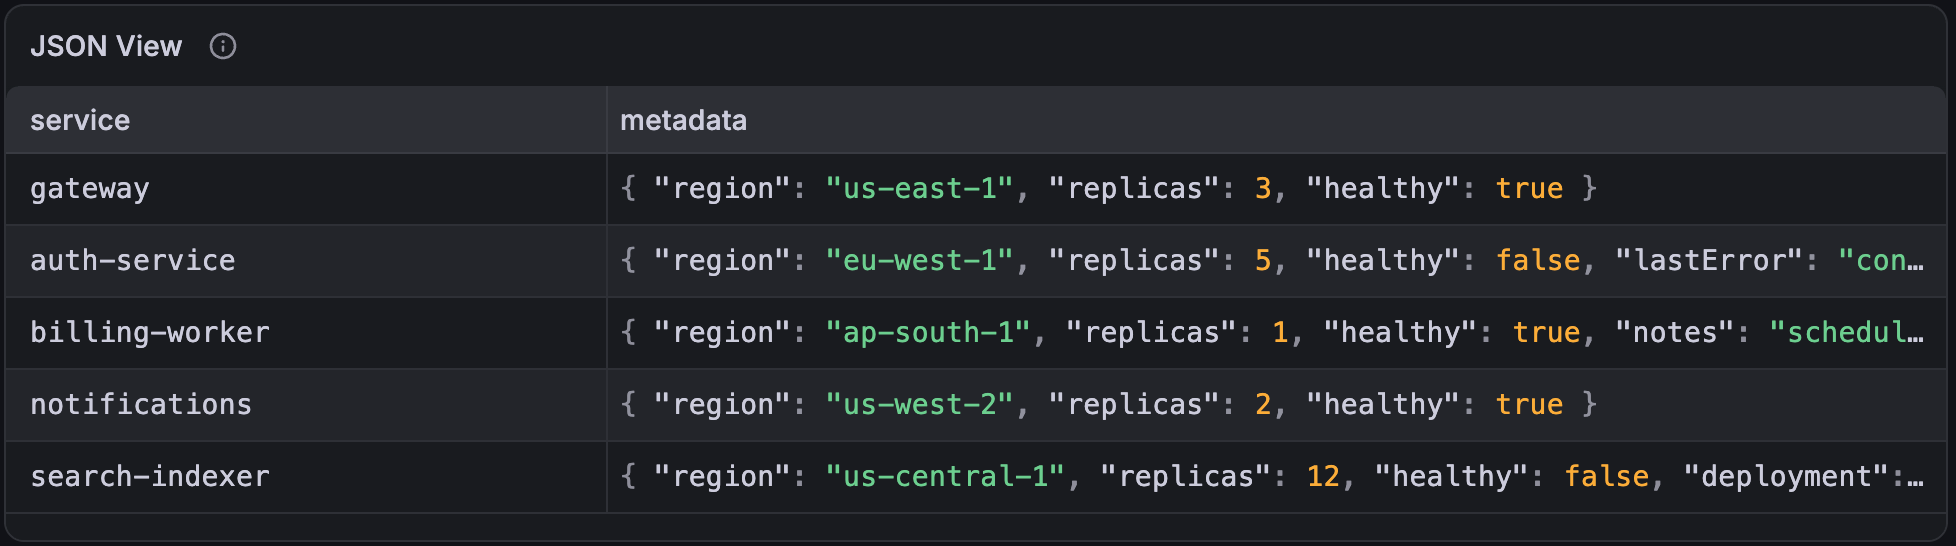
- Zebra striping to help your eyes follow rows across columns.
- Syntax highlighting to make JSON values easier to read.
![Table with zebra striping and syntax highlighting]()
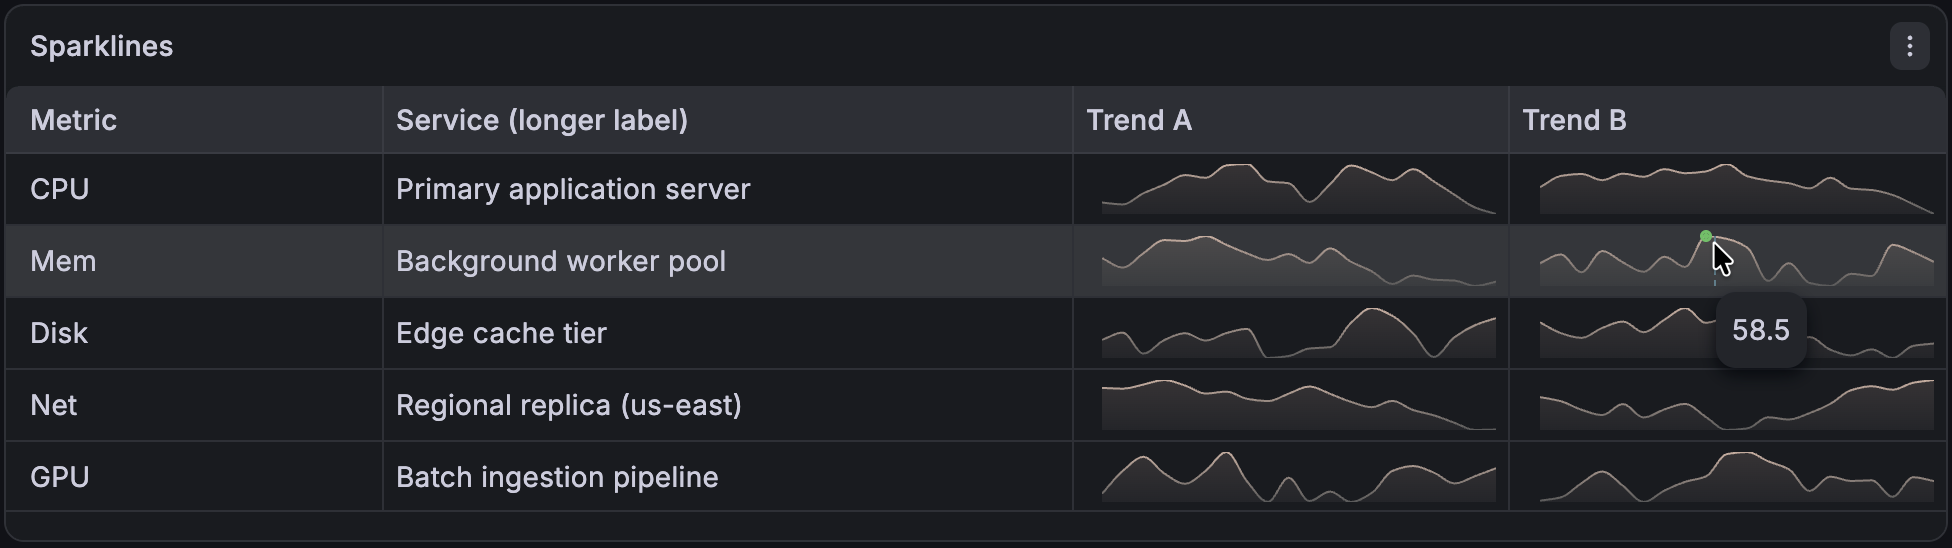
- Hover tooltips for sparkline cells to show values under the pointer.
![Table with sparkline tooltips on hover]()
Choose how many rows to review at once: Set a fixed page size to keep the number of rows consistent, or let Grafana adjust it automatically to fit the panel height.
Assistant support: Select Add to Assistant in column header and cell menus to provide that data as a context pill to Grafana Assistant. The pill carries a cell’s raw and formatted value, which field it belongs to, details of the query behind it, and which panel, dashboard, and time range it came from. For columns, it uses all the values in the column even if they’ve been filtered out.
![Ask Assistant option in menu]()
The updated table visualization is in public preview and is gradually rolling out to Grafana Cloud instances.
