Redesigned Grafana Cloud homepage

Redesigned Grafana Cloud homepage
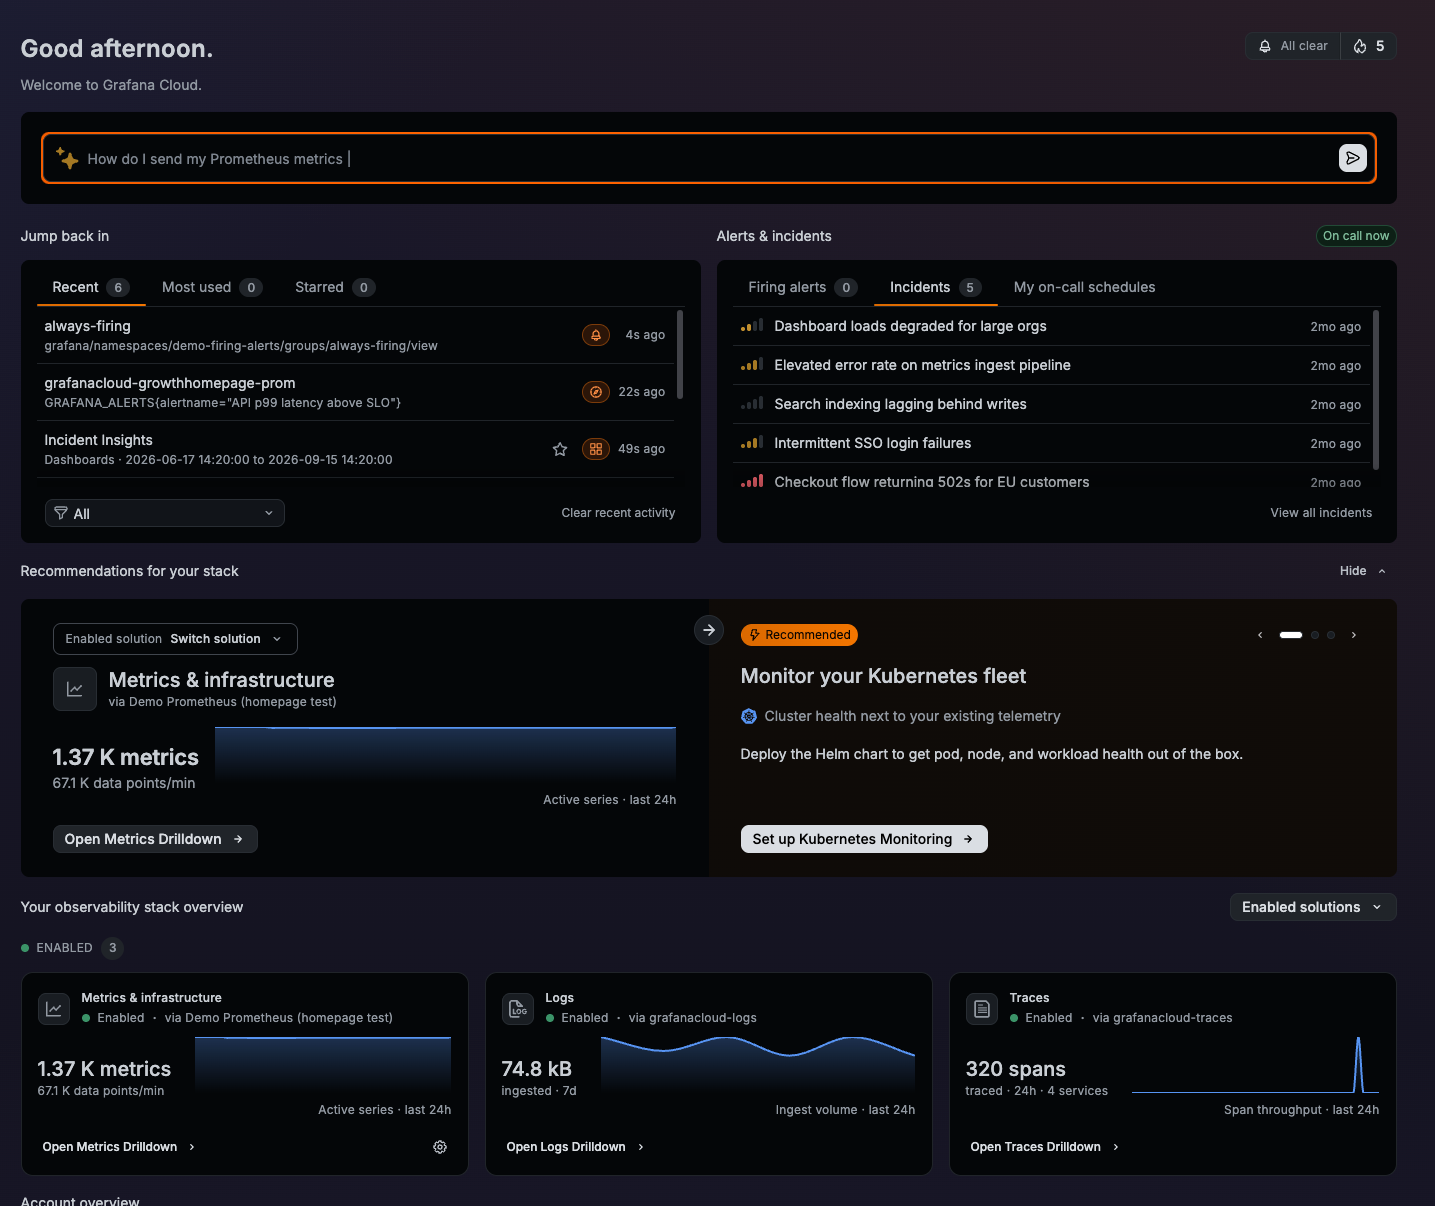
We’ve redesigned the Grafana Cloud homepage around what you need when you log in. It brings your recent work, firing alerts and incidents, your on-call shifts, and the state of your observability stack onto one page.
The homepage adapts to your stack. On a new stack, it guides you through setting up your first solutions. On an established one, it highlights what needs attention and recommends what to add next.
Pick up where you left off with recent activity
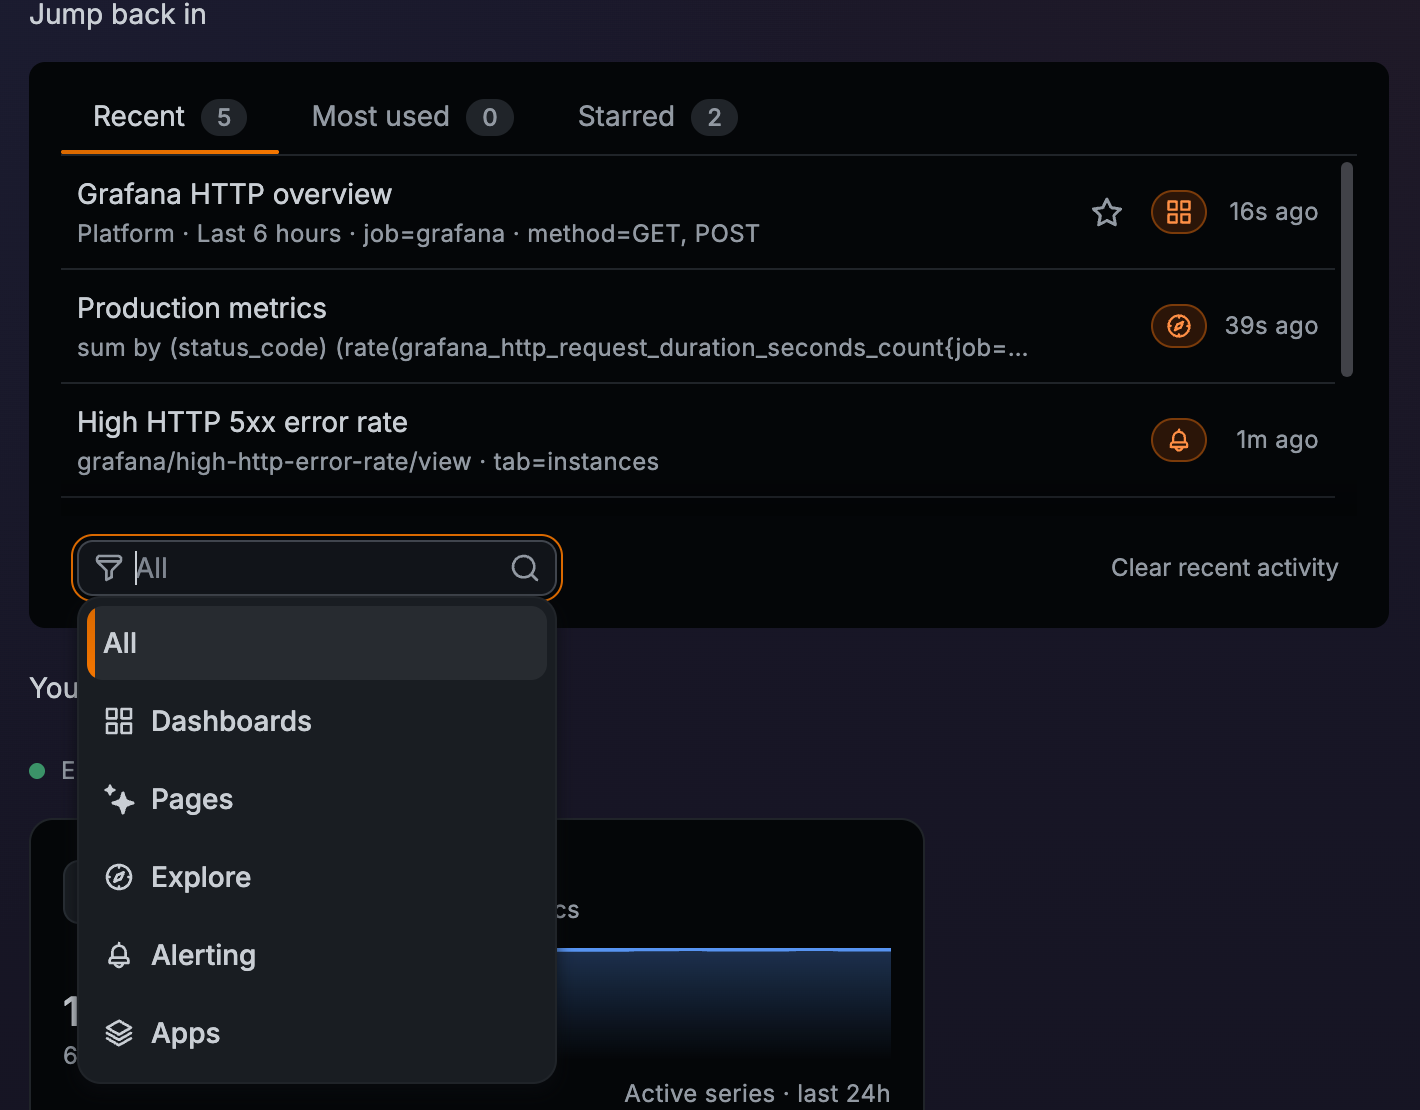
Jump back in replaces the Dashboards section. Its Recent tab lists every kind of recent activity: the dashboards, Explore sessions, alerting views, plugins, and Grafana Pages you visit.
Each entry keeps the URL parameters from your last visit. Dashboards keep their time range and variables, Explore keeps its data source and queries, and alerting views and plugins keep their filters. Click an entry to return to that exact view.
Use the filter drop-down menu to show one kind of entry, or click Clear recent activity to start over. When you’re logged in, your history follows you across browsers.
Filter alerts and incidents by label
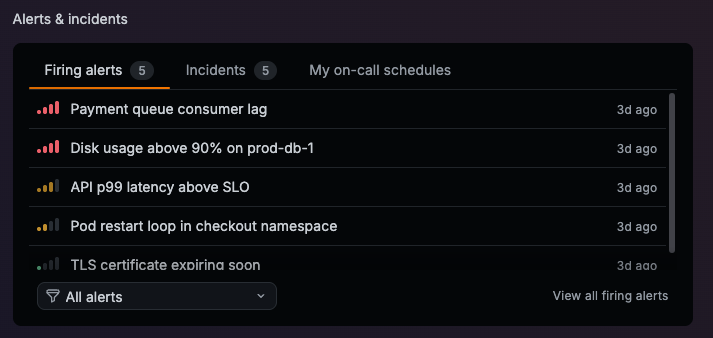
The Alerts & incidents section shows firing alerts and incidents in separate tabs. Filter either tab by label from the drop-down menu in the card.
For alerts, the menu lists every label set on your alert rules, such as severity or team. If you belong to a team, the filter starts on Your teams.
See your on-call shifts
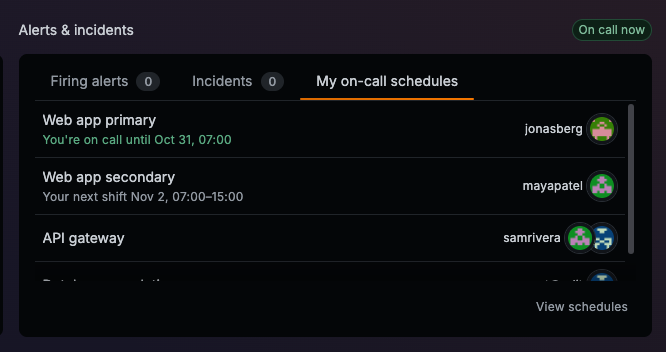
If you use Grafana IRM, the My on-call schedules tab tells you whether you’re on call and who else is. While your shift runs, the tab shows when it ends, and an On call now badge appears.
When you’re not on call, the tab shows your next shift within the next 30 days. The tab also shows your teams’ schedules and lists who’s on call on each one, so you know who to reach.
Get started on a new stack
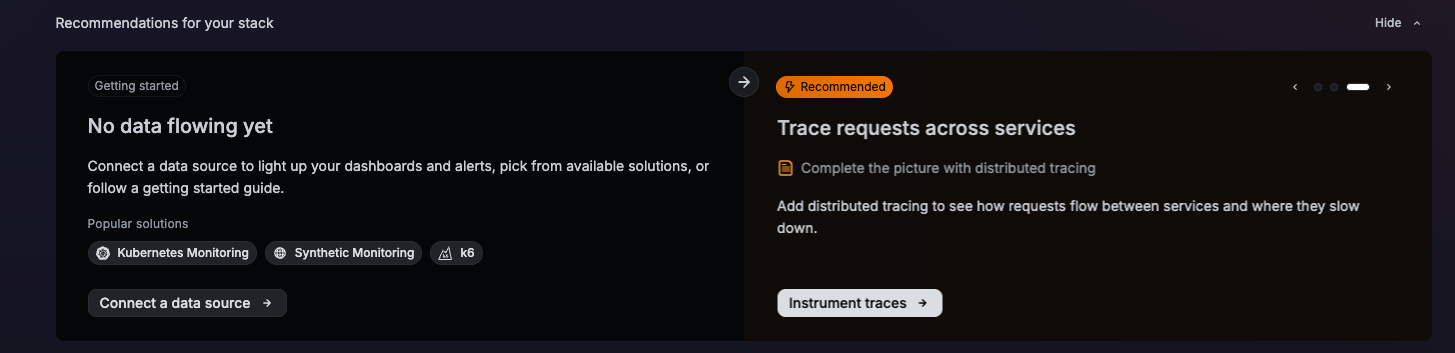
Recommendations for your stack suggests what to set up next. On a stack that doesn’t receive data yet, it shows No data flowing yet with popular solutions and a Connect a data source action.
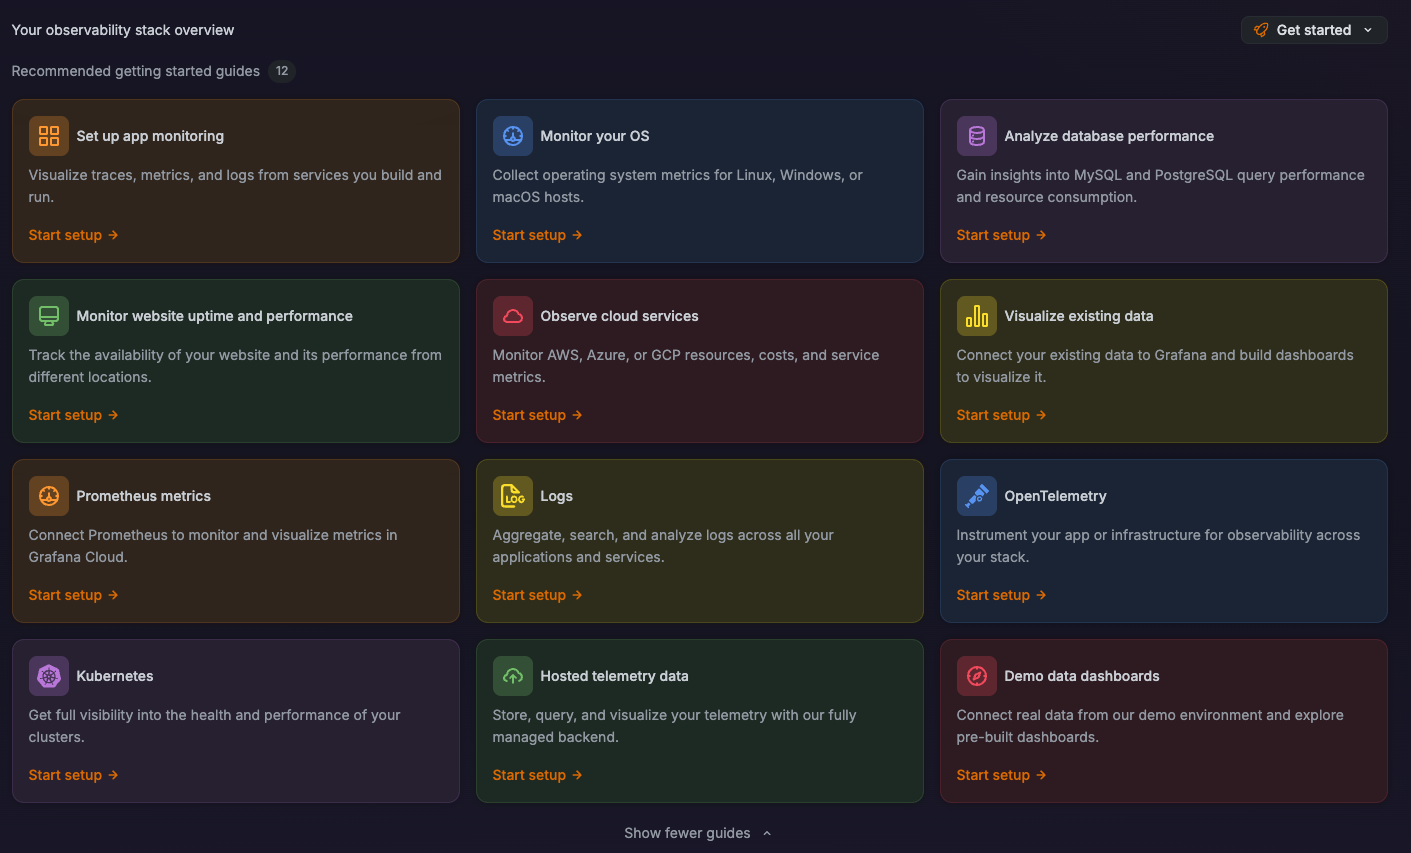
Your observability stack overview opens on Recommended getting started guides. Together, they help you set up your first solutions: pick a guide and click Start setup.
Get more from the solutions you use
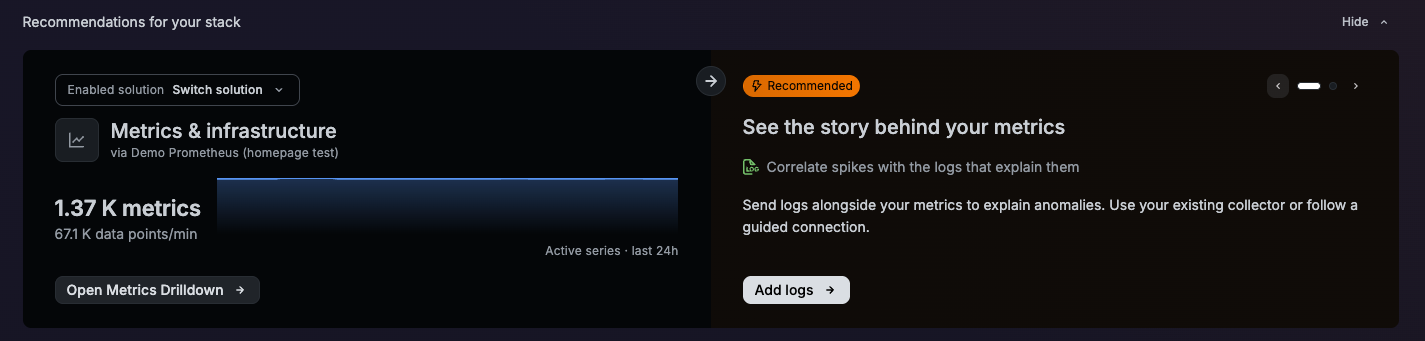
Once a solution receives data, recommendations build on it and suggest the most natural next step. For example, when metrics flow, the homepage recommends adding logs to explain spikes in those metrics.
See what needs attention across your stack
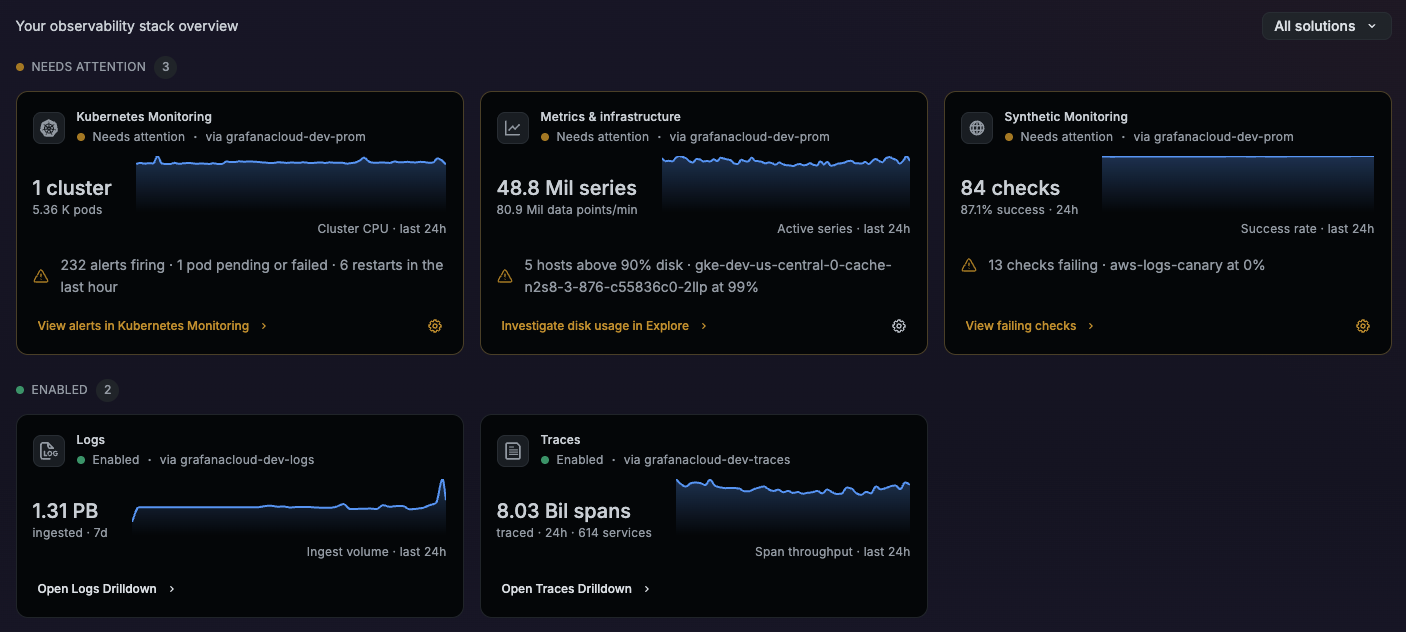
Your observability stack overview groups solutions into Needs attention, Enabled, and Available. A card that needs attention names the problem, such as firing alerts, hosts above 90% disk, or failing checks, and links to where you can investigate.
The other cards summarize each solution’s main signal with a headline number and a 24-hour trend. For example, you see active series for metrics, ingested volume for logs, and span throughput for traces.
To tailor a card’s query, click the gear on these cards:
- Kubernetes Monitoring: Scope the card to a cluster, namespaces, and nodes.
- Metrics & infrastructure: Exclude hosts and filesystems from the disk alert, for example, cache nodes that fill their disks on purpose.
- Synthetic Monitoring: Ignore checks, targets, and probes, for example, canaries or decommissioned targets.
Tailored queries keep these cards relevant in organizations with many users and data sources.