
 Revamped query editor, now generally available

Revamped query editor, now generally available
The revamped query editor is now generally available and is the default experience when you edit a panel. It brings your whole data pipeline into a single view (queries, expressions, transformations, and the alert rules that depend on them), so complex and multi-source panels are faster to build, review, and troubleshoot.
Each query, expression, and transformation appears as a card in the sidebar, with clear indicators for errors and hidden or disabled items. Choose a data source for each query to build mixed panels with no extra steps, and adjust query options directly from the footer. When you’re working with many items, select several at once to hide, delete, or change their data source in bulk, or switch to the stacked view to scroll through the entire pipeline. Grafana remembers your stacked view preference between panel edits.
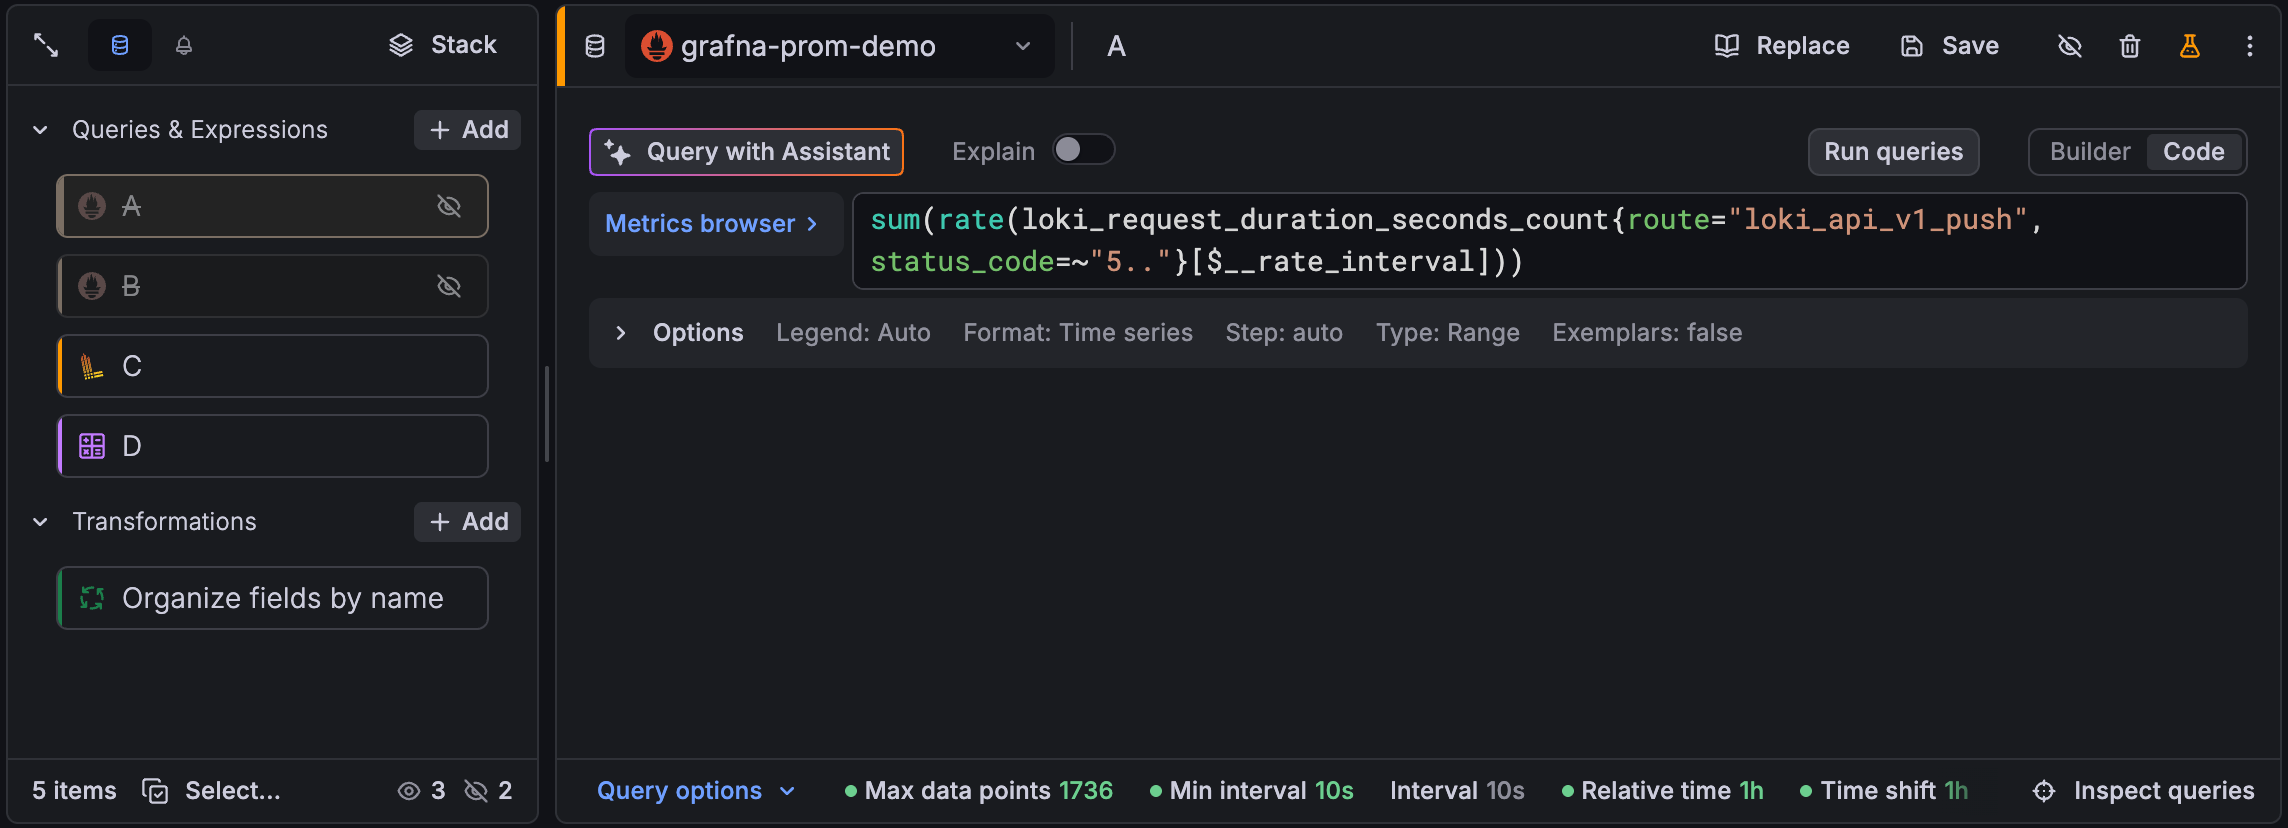
For a full tour of the sidebar, per-query data sources, the Alerts tab, multi-select, and the stacked view, refer to the original announcement and the public preview announcement.
