Grafana Managed Sandboxes: from root cause to pull request, without leaving Grafana

Grafana Managed Sandboxes: from root cause to pull request, without leaving Grafana
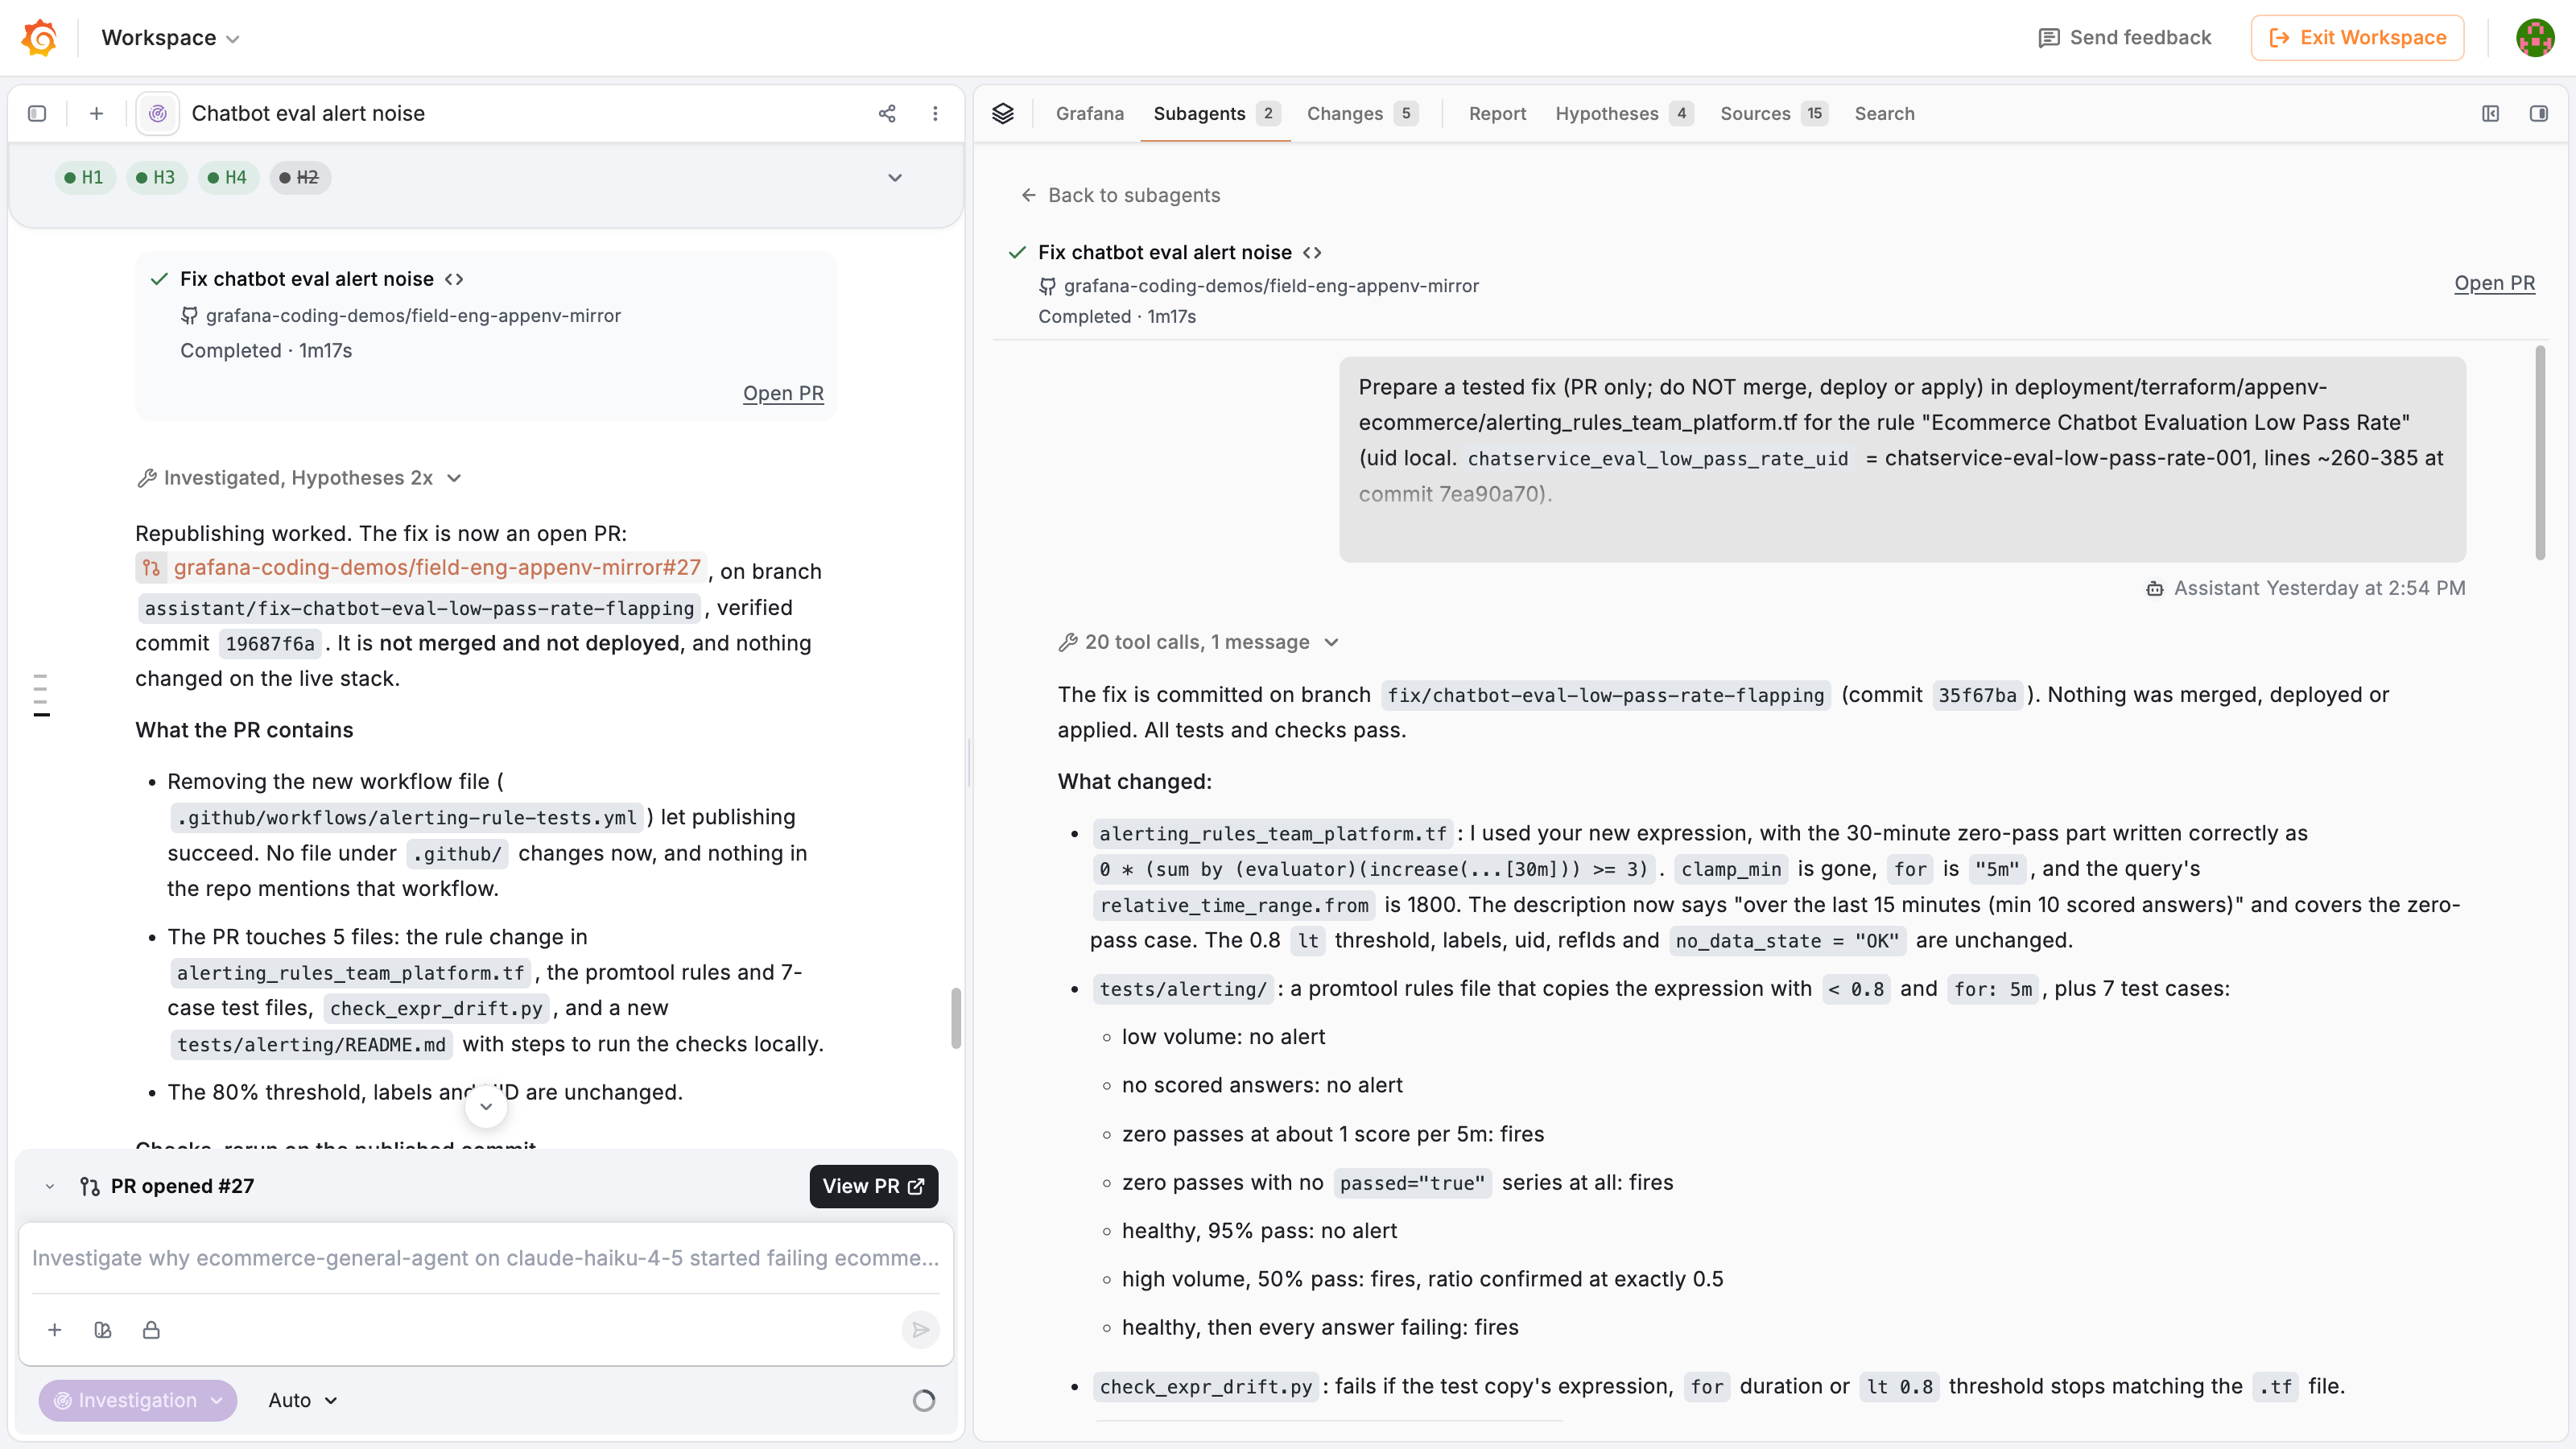
Observability usually stops at telling you what’s wrong. With Managed Sandboxes, now in public preview, Grafana Assistant can hand its diagnosis to a coding agent and get you to a fix. The agent gets the full context: the alert, the log lines, the traces, and the suspected commit. It runs within a sandbox in the cloud, so the work keeps going after you close your laptop.
In the sandbox, the agent reads your repository, edits the code, runs tests and builds, and commits to a branch. The diff shows up in Grafana next to the investigation, with a Create PR button. You stay in control, and Grafana never merges or deploys.
With Managed Sandboxes, you can:
- Start wherever the problem shows up: from an Assistant chat, an investigation, a Slack thread, an
@grafanacomment on a GitHub issue or PR, or a scheduled automation. - Choose who writes the code: use the Grafana sandbox, an isolated environment limited to the repositories you connect in Grafana. Or bring Cursor Cloud or Claude Managed Agents on your existing account. The handoff and review work the same way either way.
- Set guardrails per repository: require approval before anything is published, or open draft PRs automatically for verified private repositories. You can also control network access and secrets for each environment.
- Customize the sandbox: add a
.grafana/Dockerfileto install the tools your project needs.
Go to AI > Settings and click GitHub under Connectors to connect a repository, then ask an agent to take a first look.