
 Discover and organize your services in Service Center
Discover and organize your services in Service Center
Service Center in Grafana Cloud brings a service’s SLOs, alerts, incidents, on-call activity, dashboards, and synthetic checks into one view. You now have more ways to get your services into Service Center and keep them organized.
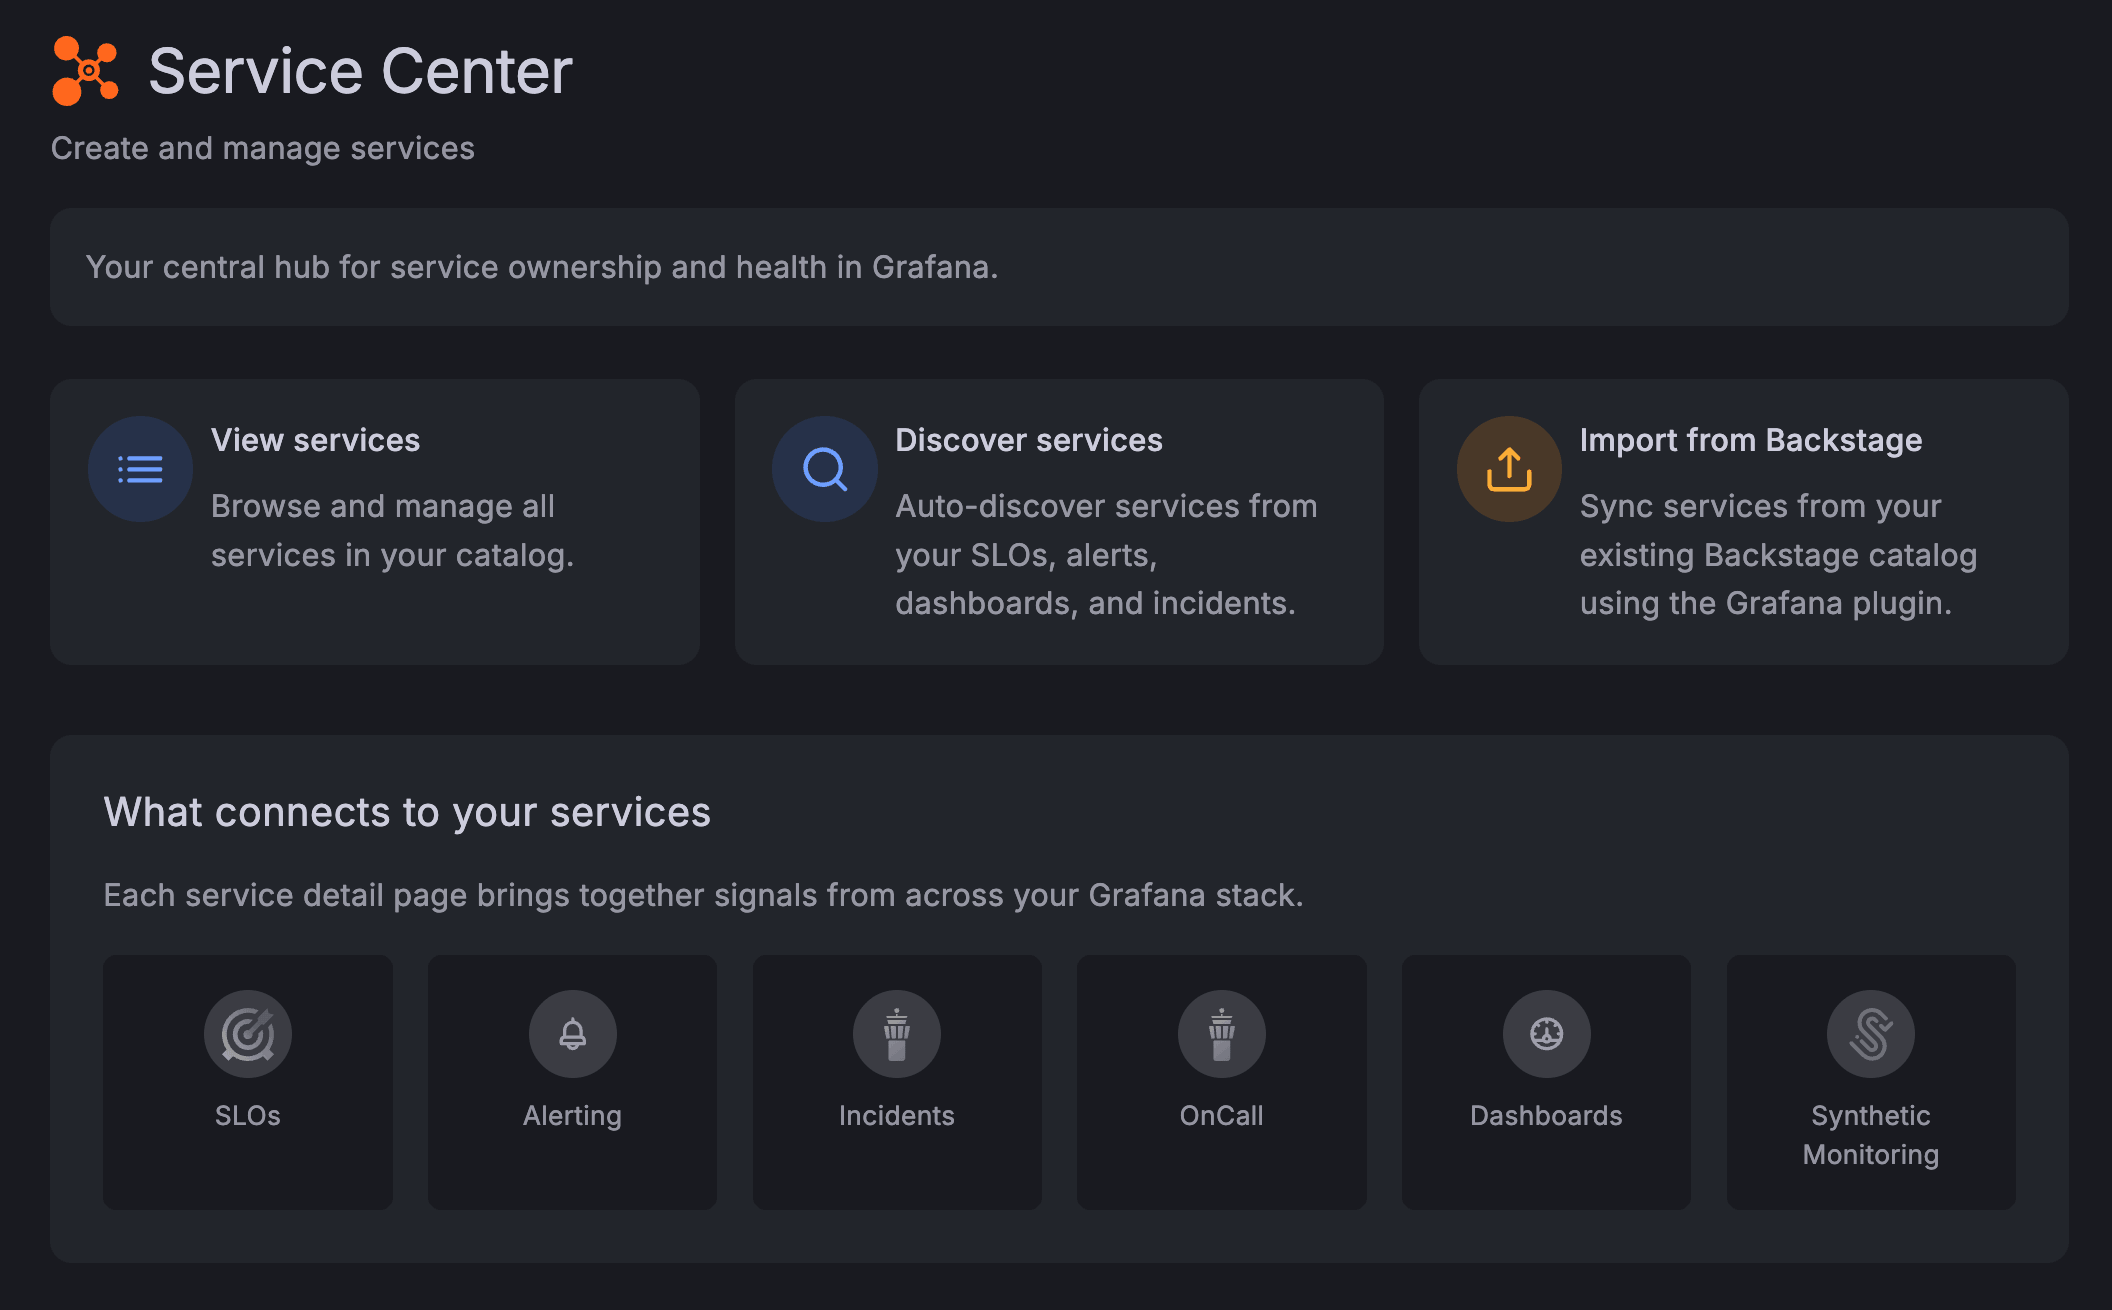
Find your services faster
A new Service Center home page links to the main actions: view services, discover services, or import from Backstage.
In the service list, star your favorite services and filter by name, team, identifier, starred services, or My teams. Recently viewed services are one click away. Filters are saved in the URL, so you can bookmark or share a filtered view.
Discover services automatically
The Discover services page scans your SLOs, alerts, dashboards, incidents, and synthetic checks for services you haven’t added yet. Choose the label that ties them together, such as service_name, service, job, namespace, app, team, or a custom key. Set a naming pattern with a live preview, and create the services you want in bulk.
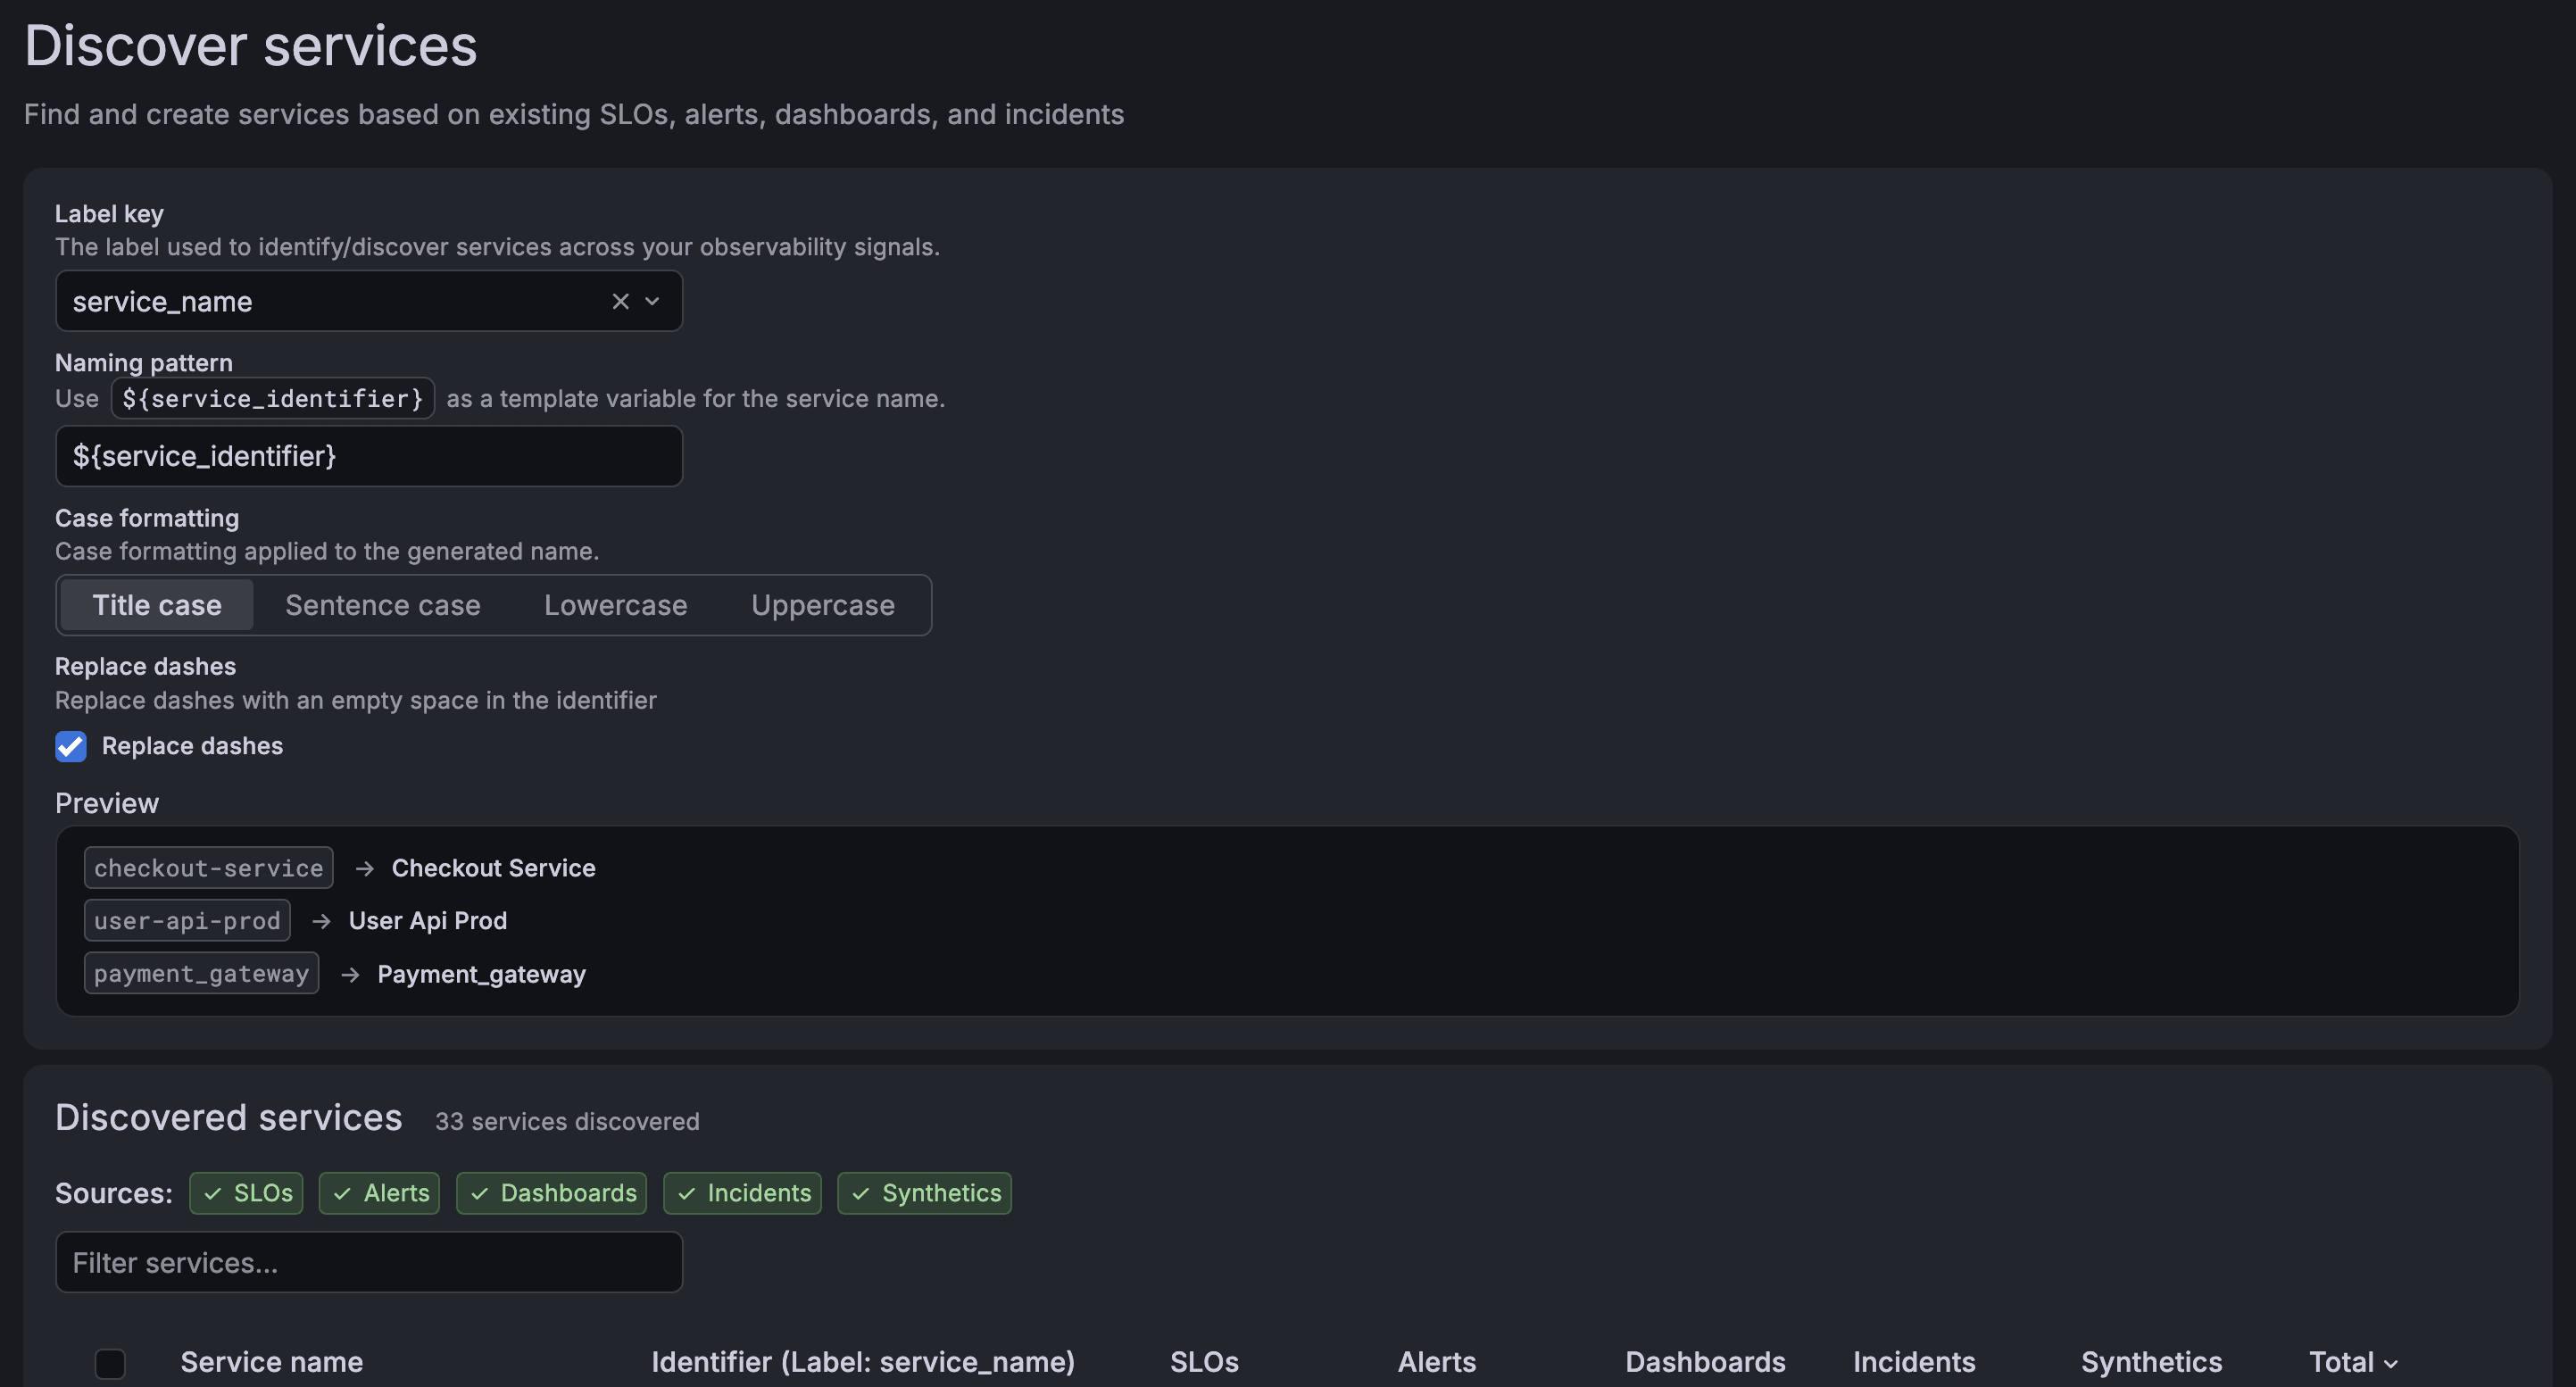
To learn more, refer to Discover services.
Match resources that use different labels
Each service can have up to five additional identifiers, which are label key-value pairs. Resources that follow a different labeling convention still show up on the right service. For details, refer to Create a service.
Matching Synthetic Monitoring checks also appear in a new Synthetic checks panel on the service page, showing their uptime, reachability, and latency.
Manage services as code
Use the grafana_apps_servicemodel_component_v1alpha1 resource in the Grafana Terraform provider (v4.44.0 or later) to manage services, including ownership, identifiers, dependencies, and links.
Service Center labels services that Terraform manages, and warns you before you edit or delete one, because the next terraform apply overwrites manual changes.
