
 Connect Synthetic Monitoring checks to your services with Knowledge Graph
Connect Synthetic Monitoring checks to your services with Knowledge Graph
Grafana Cloud Synthetic Monitoring now integrates with the knowledge graph, available in public preview. When a check fails or slows down, you can see the service it monitors, explore its dependencies, and compare check results with service health to narrow down where to investigate.
Synthetic checks show how your application behaves from the outside. The knowledge graph adds context about the services behind that experience. Bringing these views together helps you investigate whether a failure might involve the monitored service, a downstream dependency, or the path to your application, allowing you to connect end user context to system context
The integration brings two new views to your check dashboard:
- Insights: View the check’s active knowledge graph insights, driven by your existing per-check alerts for failed executions, latency, and TLS certificate expiration.
- Connected services: Explore a graph of the linked service, its callers, and its dependencies. Preview service details and performance metrics, see which services have active insights, or open the full knowledge graph to continue your investigation.
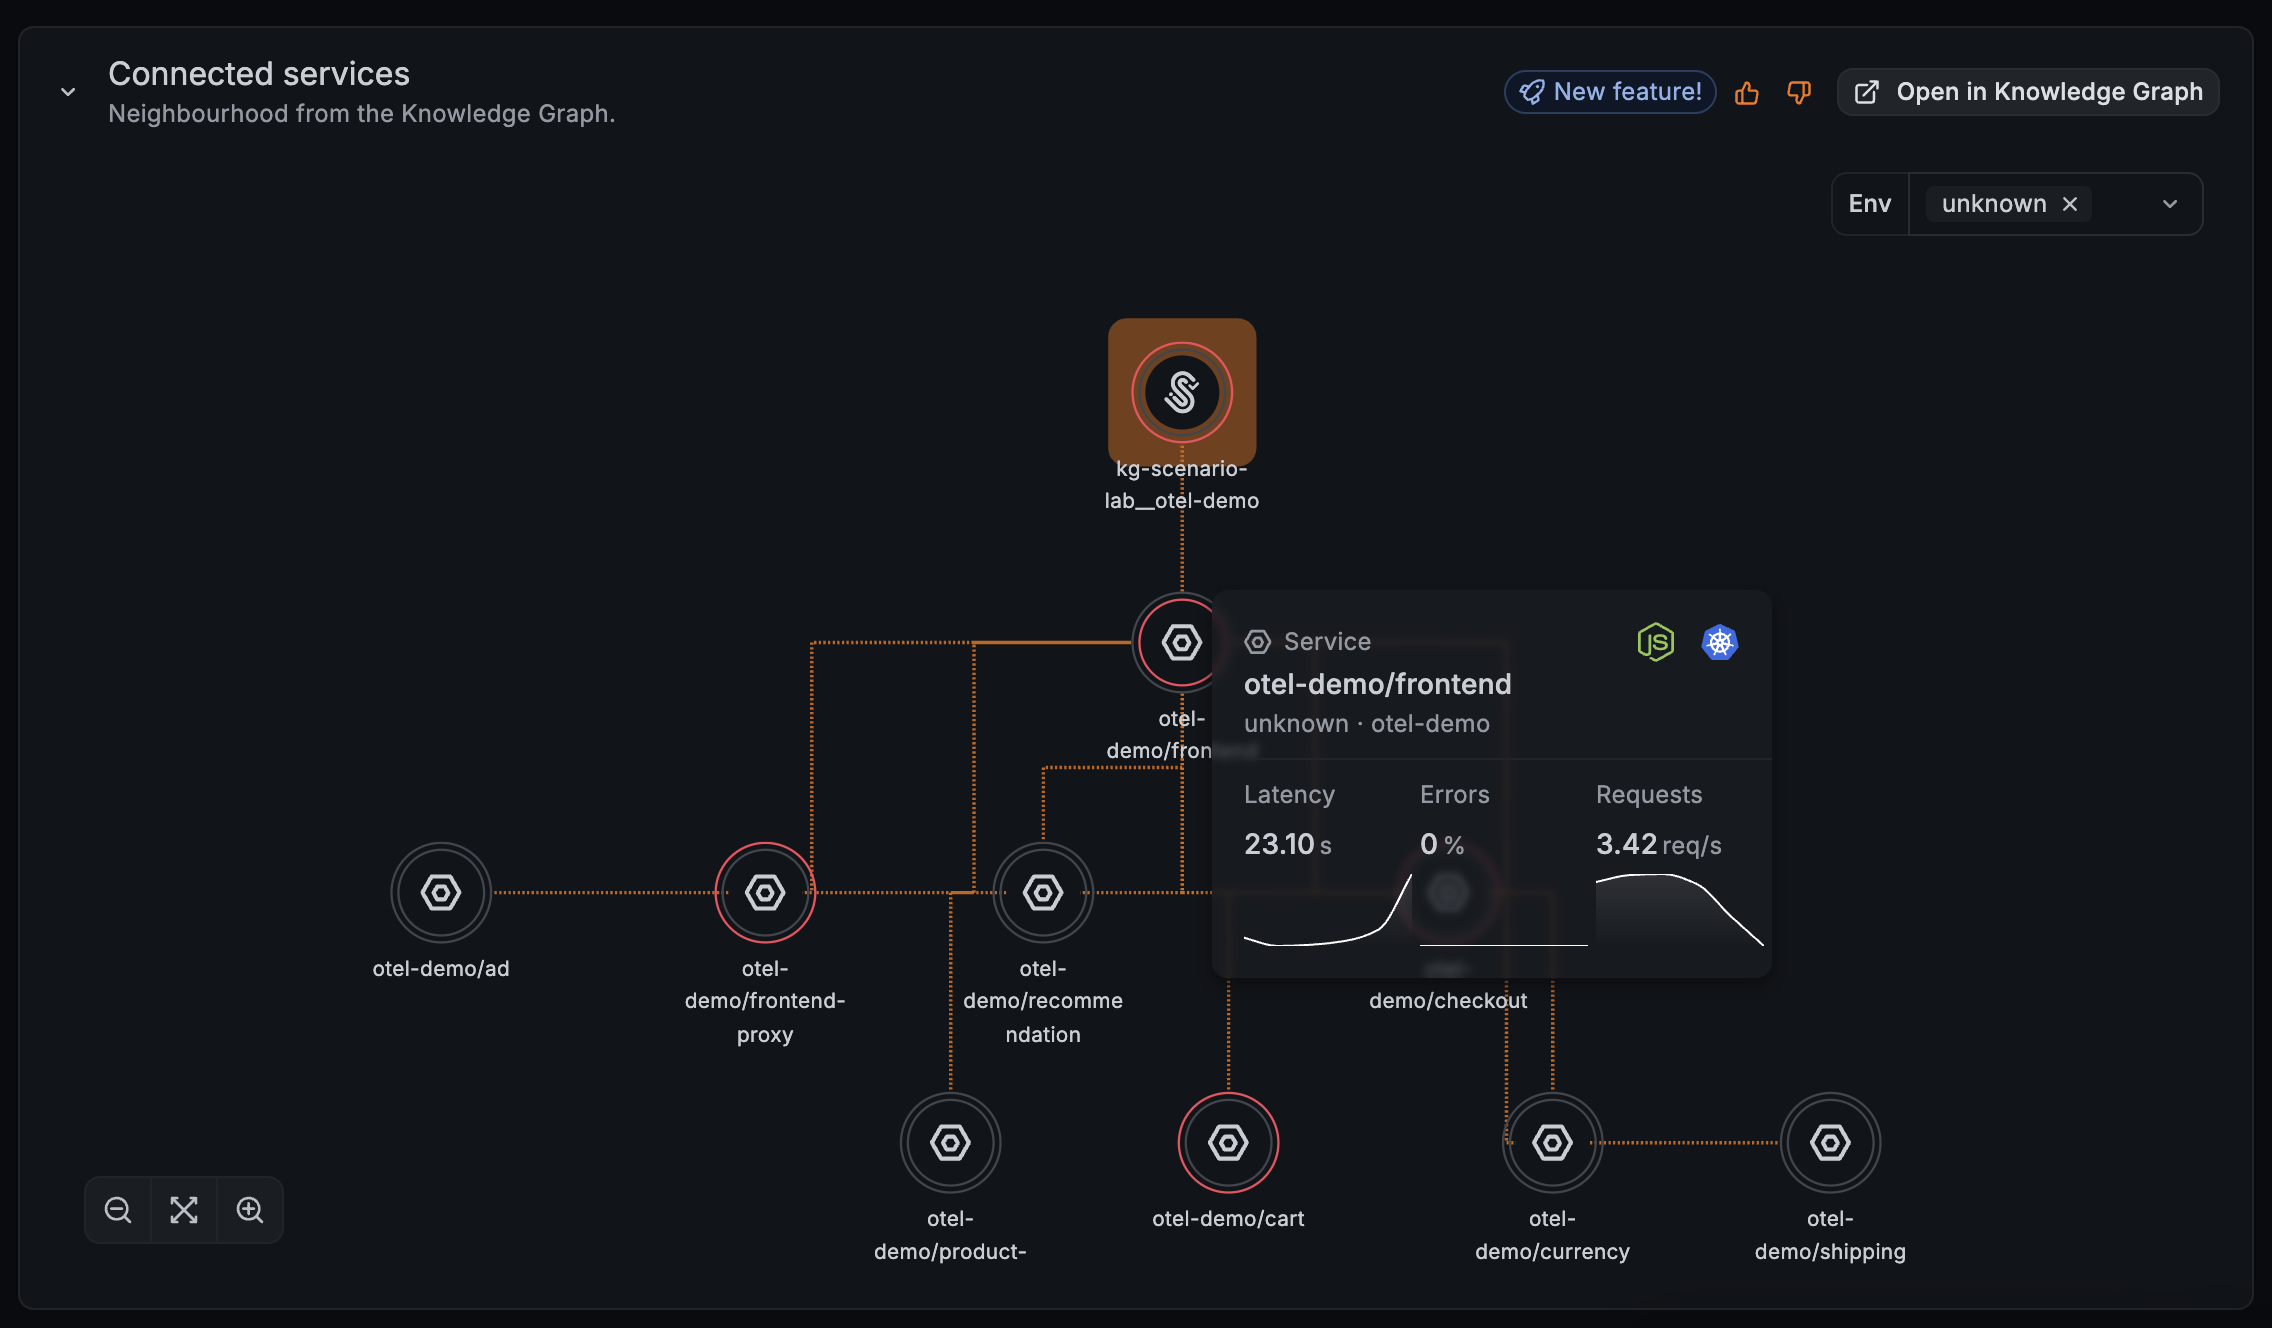
You can also explore your synthetic checks directly in the knowledge graph alongside other entities. Add a check, its linked service, and relevant dependencies to the root cause analysis workbench to investigate them together.
When the knowledge graph is activated on your stack, your checks appear in it automatically. To connect a check to a service, set its service_name and namespace labels to match the service in the knowledge graph. You can configure these labels in the check editor, through the API, or with Terraform.
To learn more, refer to Connect Synthetic Monitoring checks to the Knowledge graph.
