
 Build data-driven dashboards with the updated Text visualization
Build data-driven dashboards with the updated Text visualization
Text visualizations are useful for adding context to dashboards, but the core visualization has traditionally been limited to static Markdown, HTML, and dashboard variables. If you wanted to create a table from query results, display a status summary, or change text based on a value, you often had to use custom code or another visualization type.
The updated text visualization connects text to your query data, allowing you to build data-driven tables, cards, lists, and status summaries directly in Grafana.
Edit content and preview it in one place
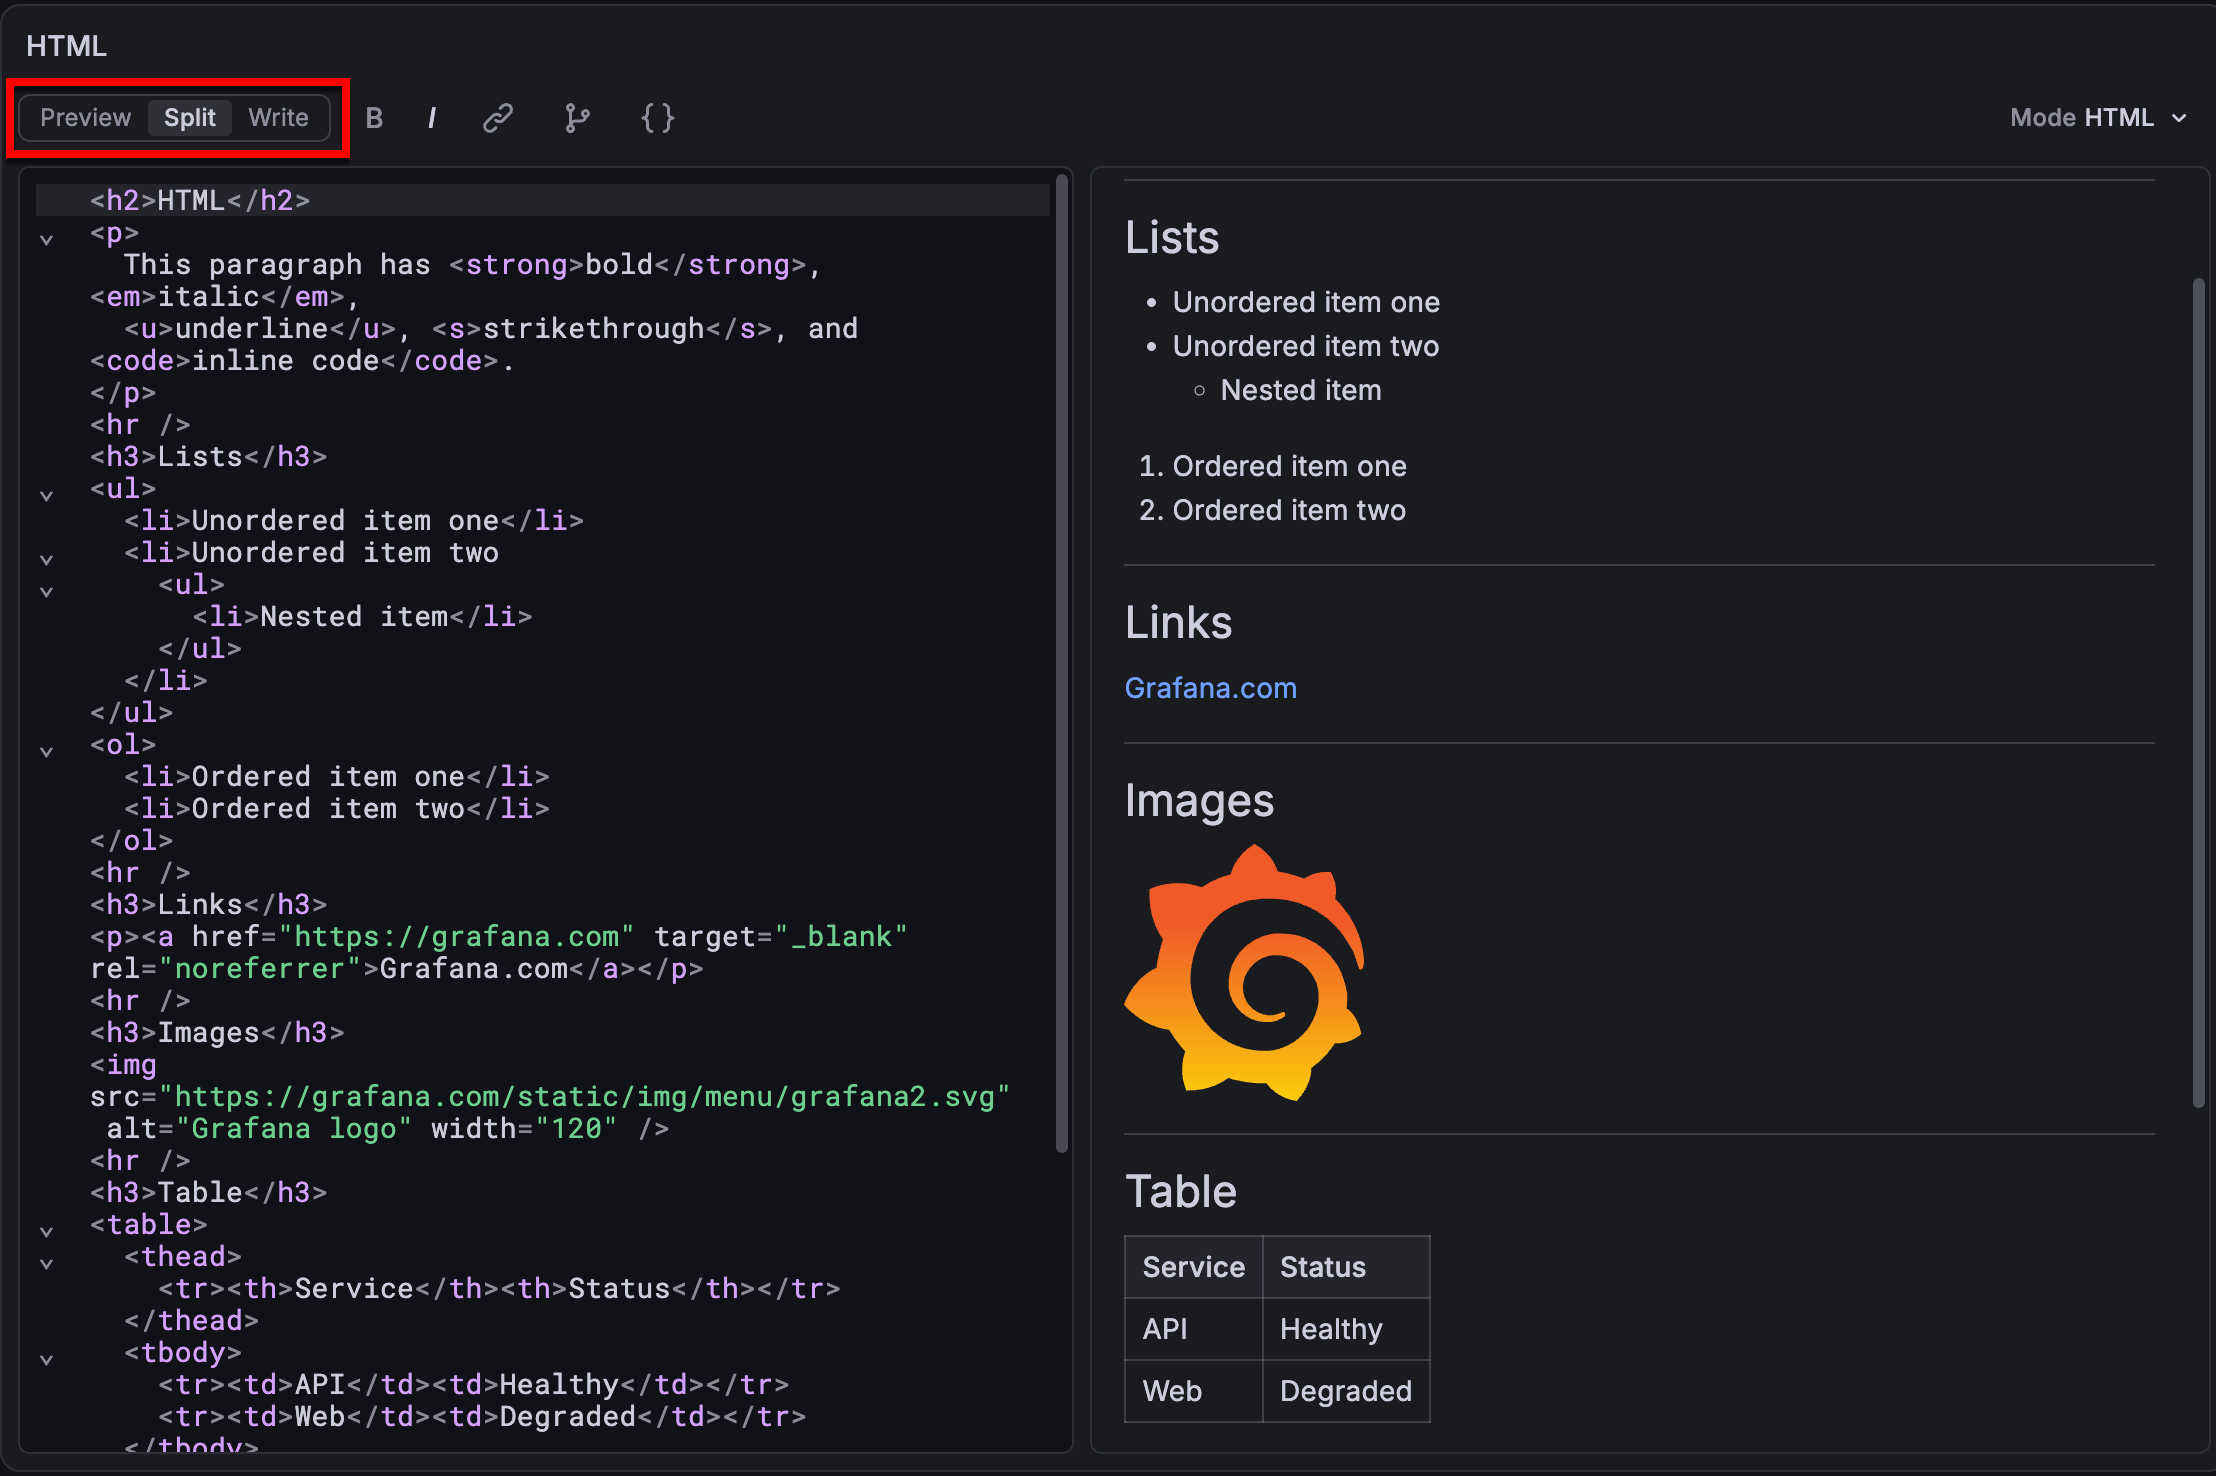
The redesigned editor keeps authoring and preview together, by letting you switch between Preview, Split, and Write views. Use the formatting toolbar for common Markdown and HTML operations and get autocomplete for dashboard variables. The editor also provides syntax highlighting for Markdown, HTML, and code.
Turn query results into text with Handlebars templates
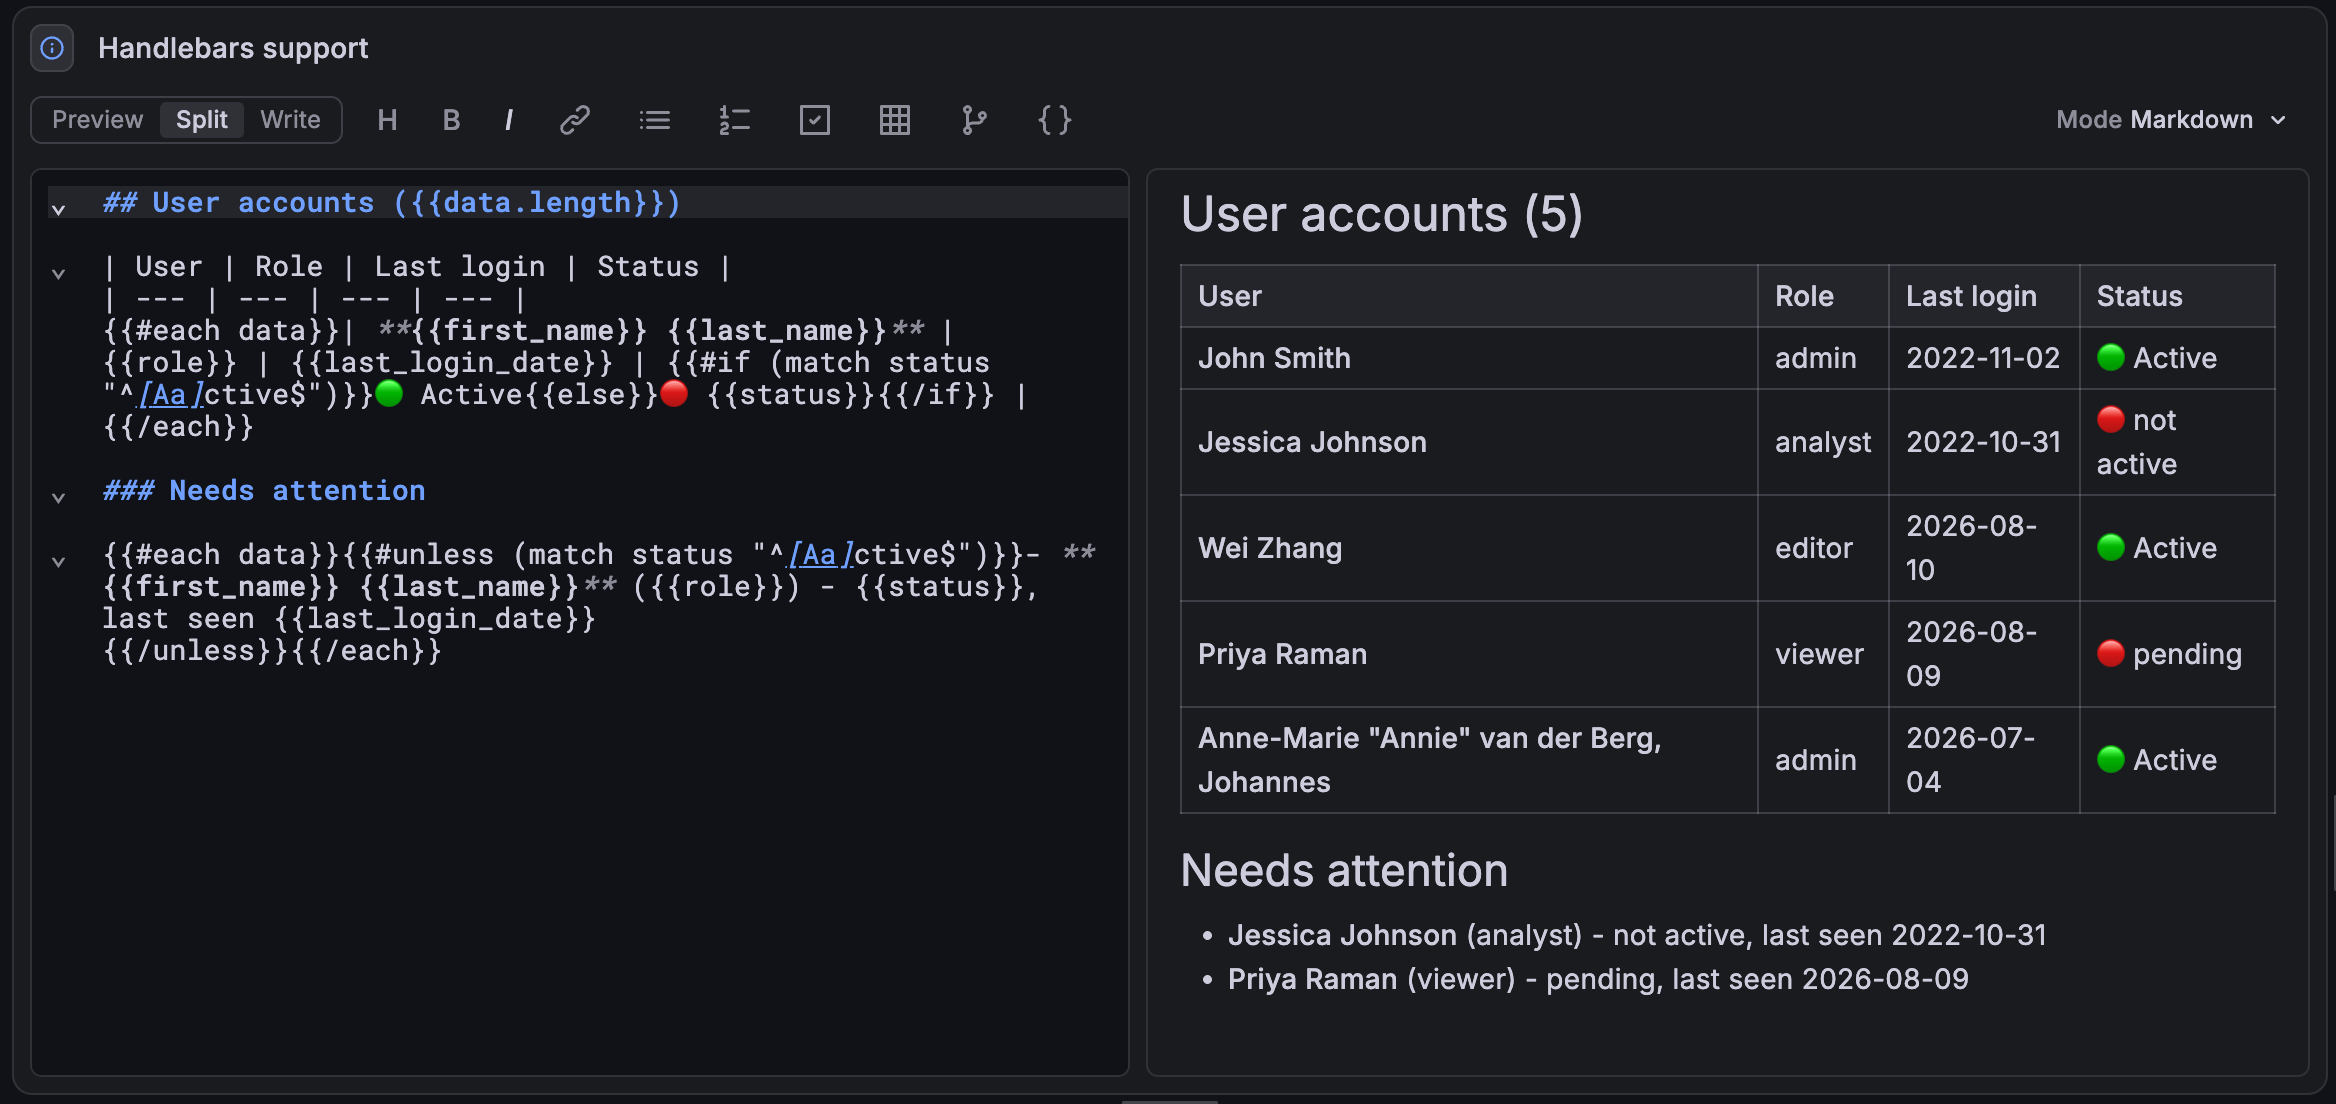
Use ${__value}, ${__field}, ${__series}, and ${__data} macros to reference query results in your content, and Handlebars templating for more control. Choose what data to display, repeat content for each row with {{#each}}, and add simple if/then logic with {{#if}} helpers.
Choose how content renders
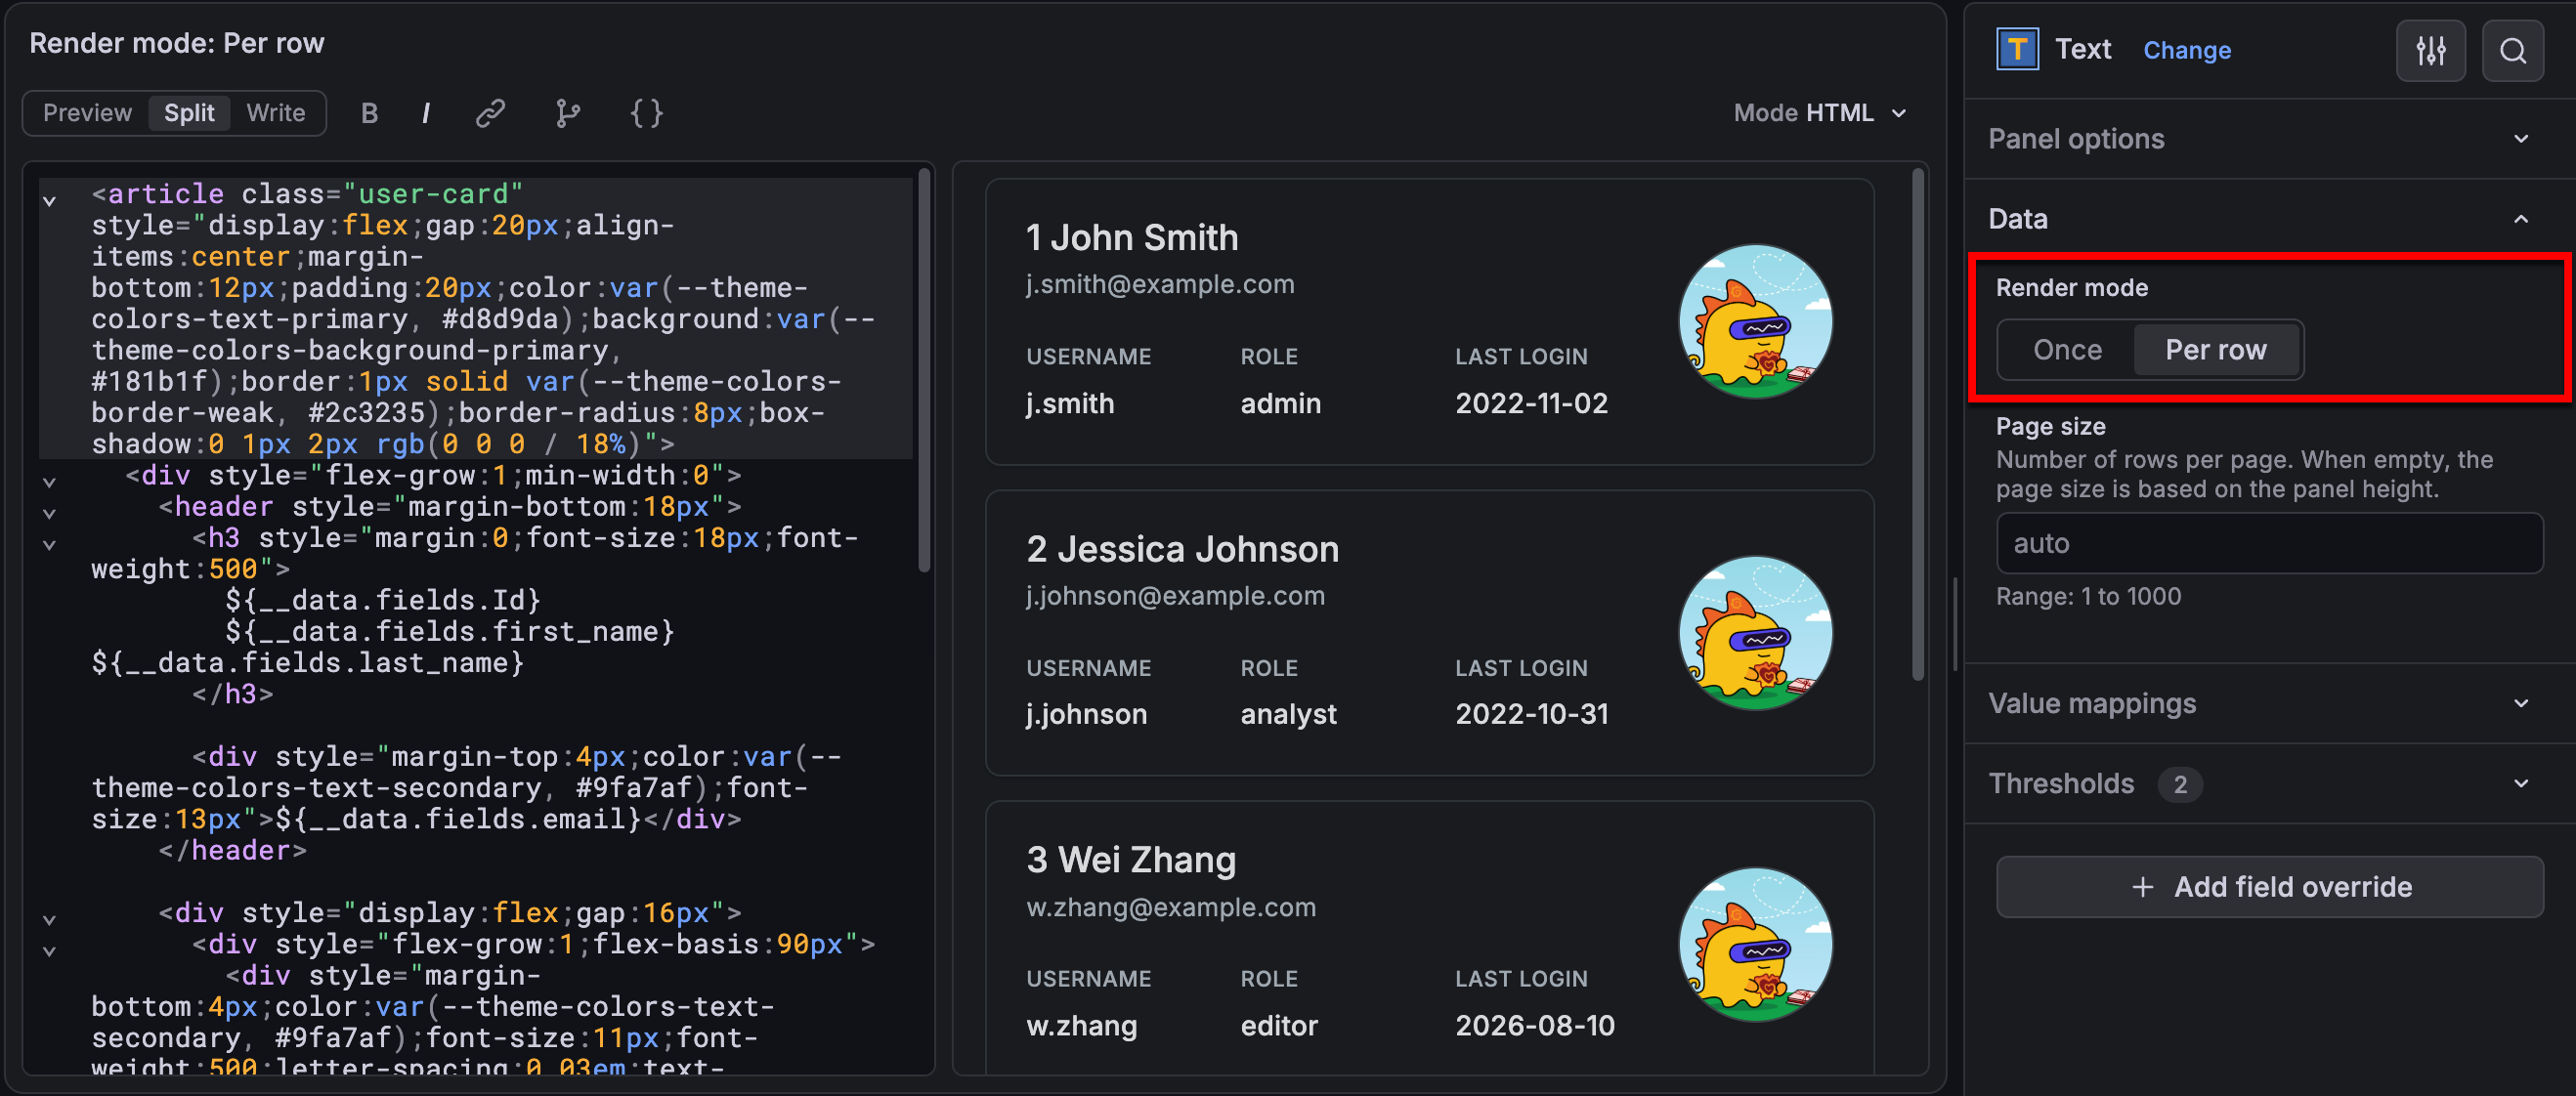
Select a render mode to control how your template is applied: render once for the whole result, or once per row so each row in your data gets its own repeated block of content. You can also select which data frame to display.
Format data with value mappings and thresholds
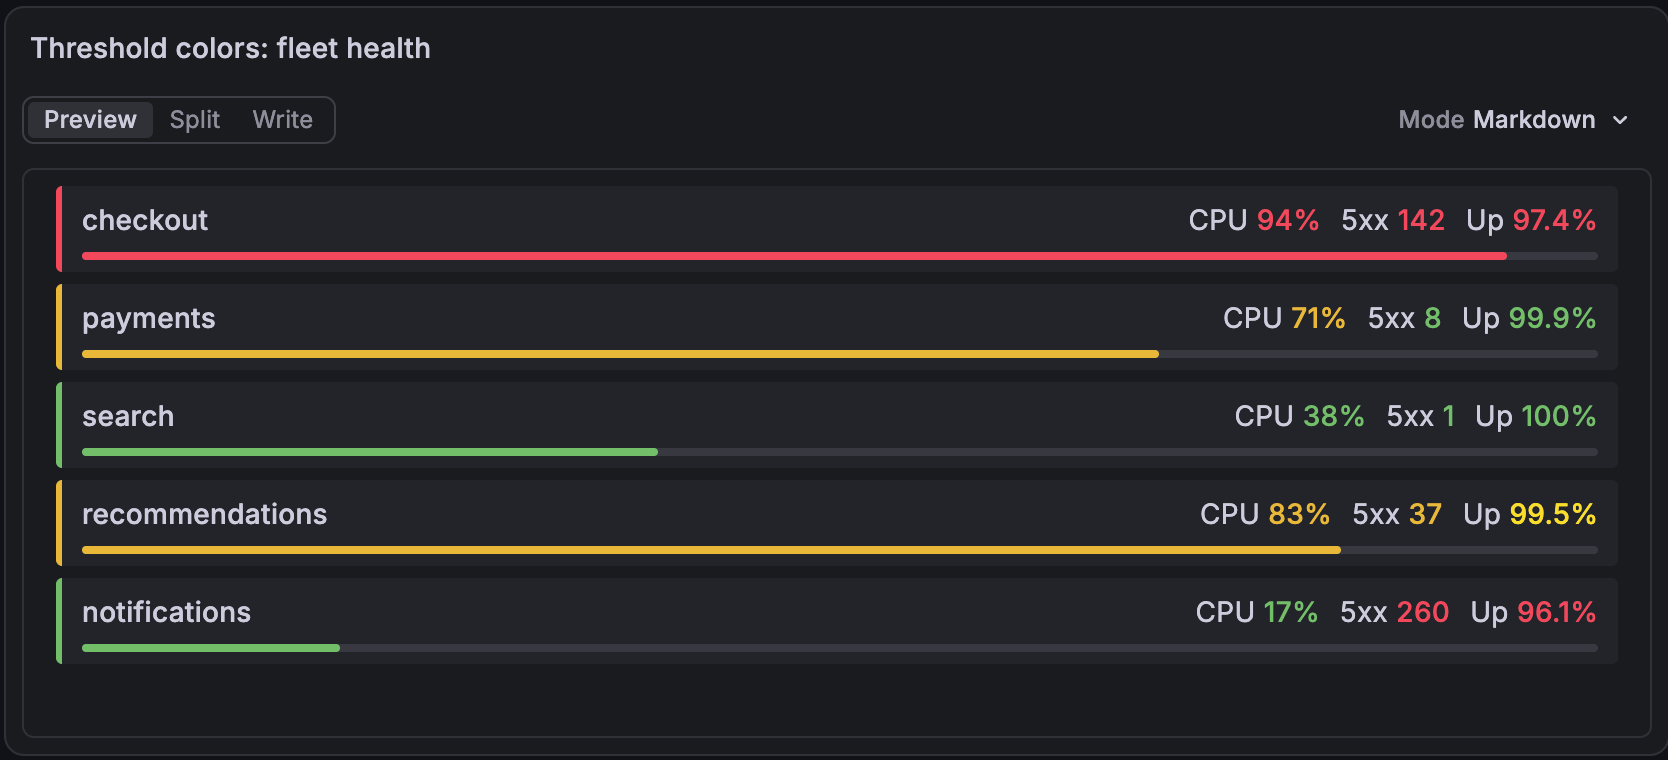
The text visualization now supports value mappings and thresholds, using the same field configuration tools available in other Grafana visualizations. Define how values are represented, then use the resulting text and colors in your templates. HTML and Markdown are sanitized by default.
Create richer content and handle larger results
Add Mermaid diagrams to your text visualizations alongside Markdown and HTML content.
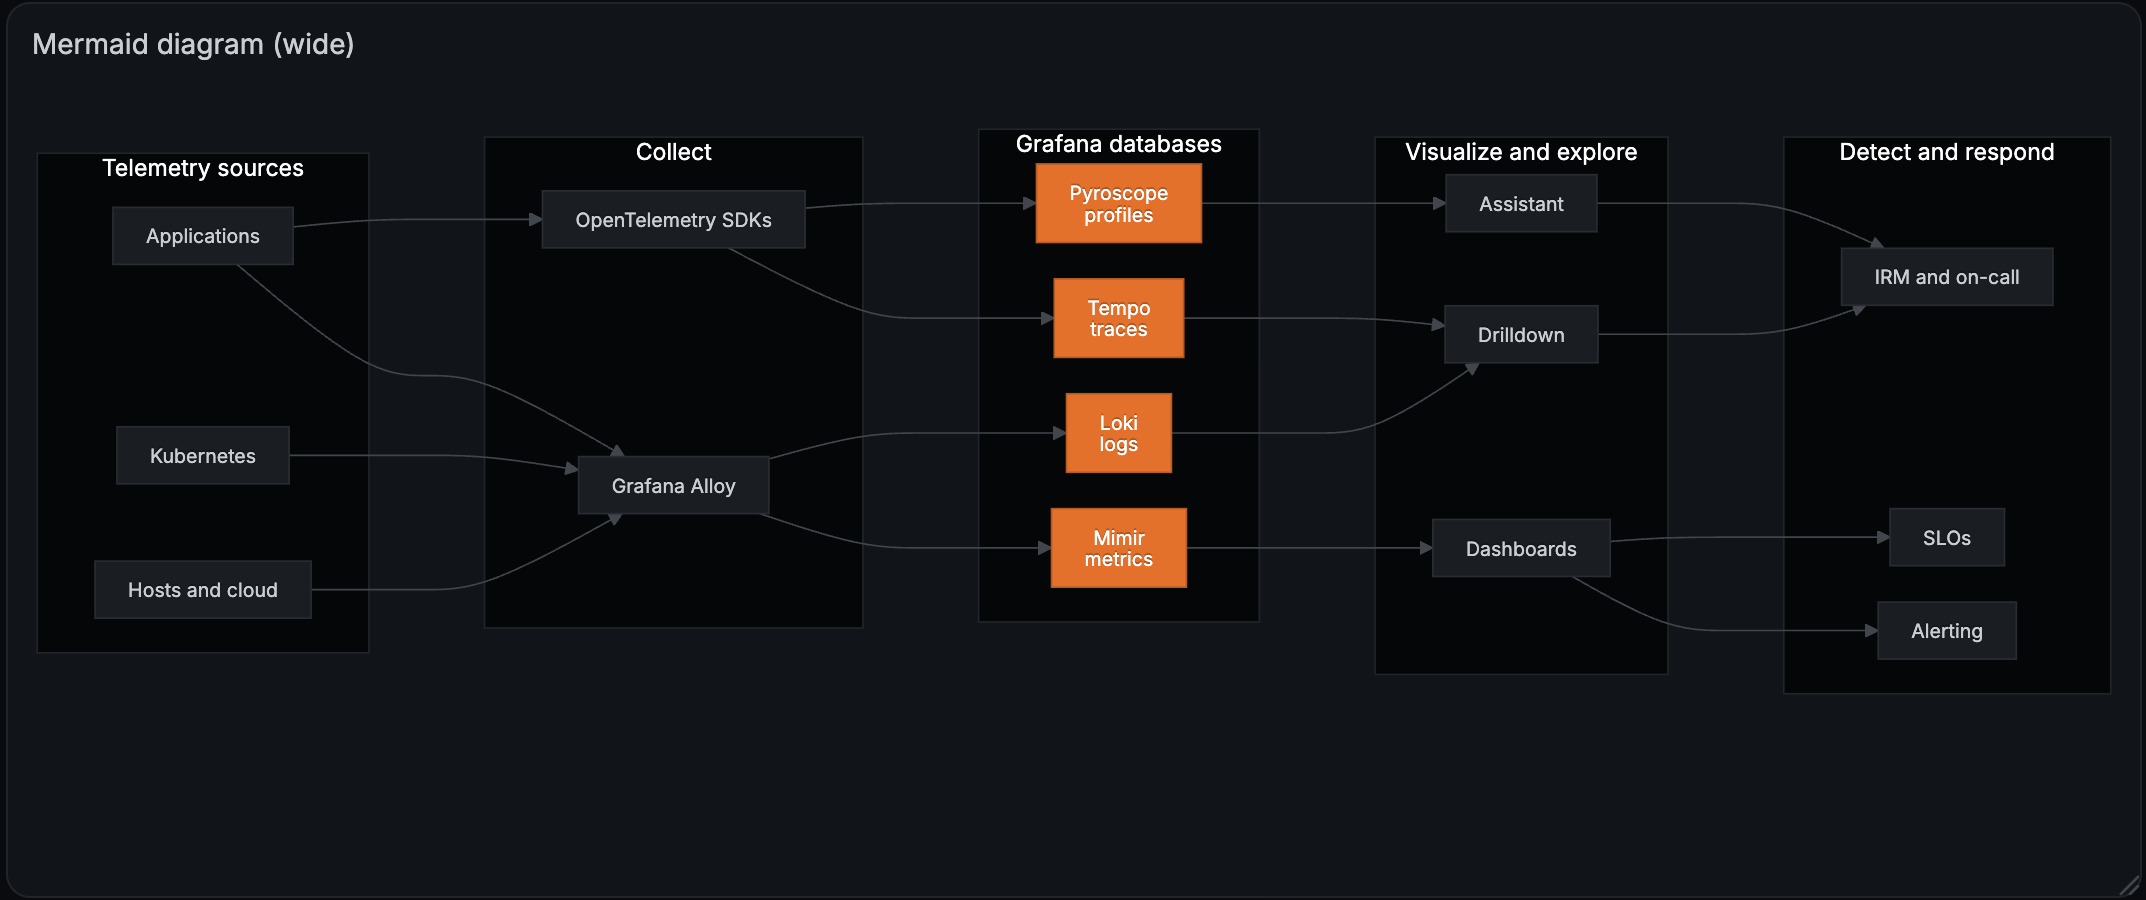
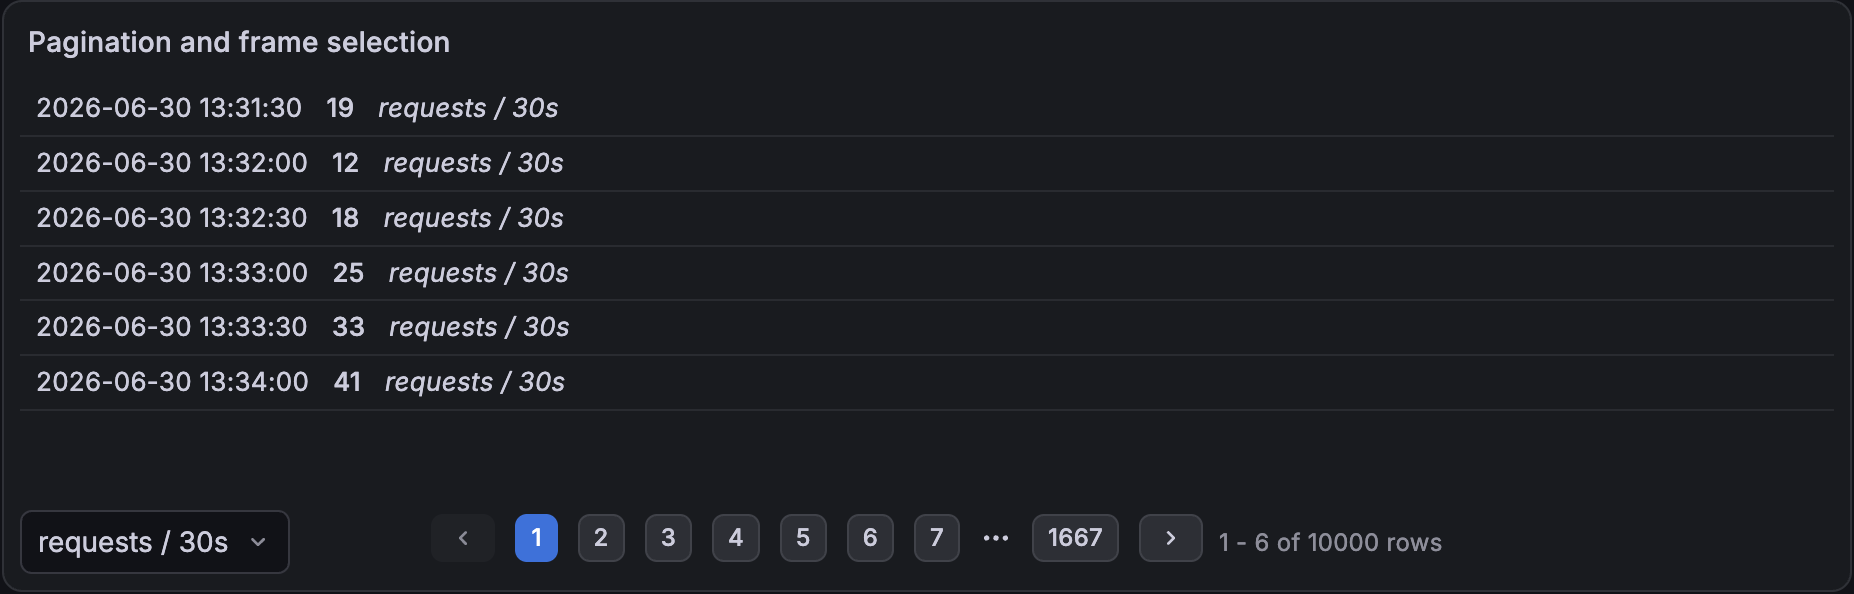
Also, when a query returns many rows, pagination lets you move through the full result instead of showing only a limited number of rows. Grafana can automatically adjust the number of rows on each page to fit the panel.
To try out the new text visualization, enable the grafana.newTextPanel and text.newFeatures feature toggles.
