
 Query k6 test result metrics with PromQL in your own stack
Query k6 test result metrics with PromQL in your own stack
Query Grafana Cloud k6 test result metrics with PromQL and compare load test behavior with your application’s metrics, logs, and traces. Test result metrics are stored in Grafana Cloud Metrics, powered by Mimir, in your own Grafana Cloud stack.
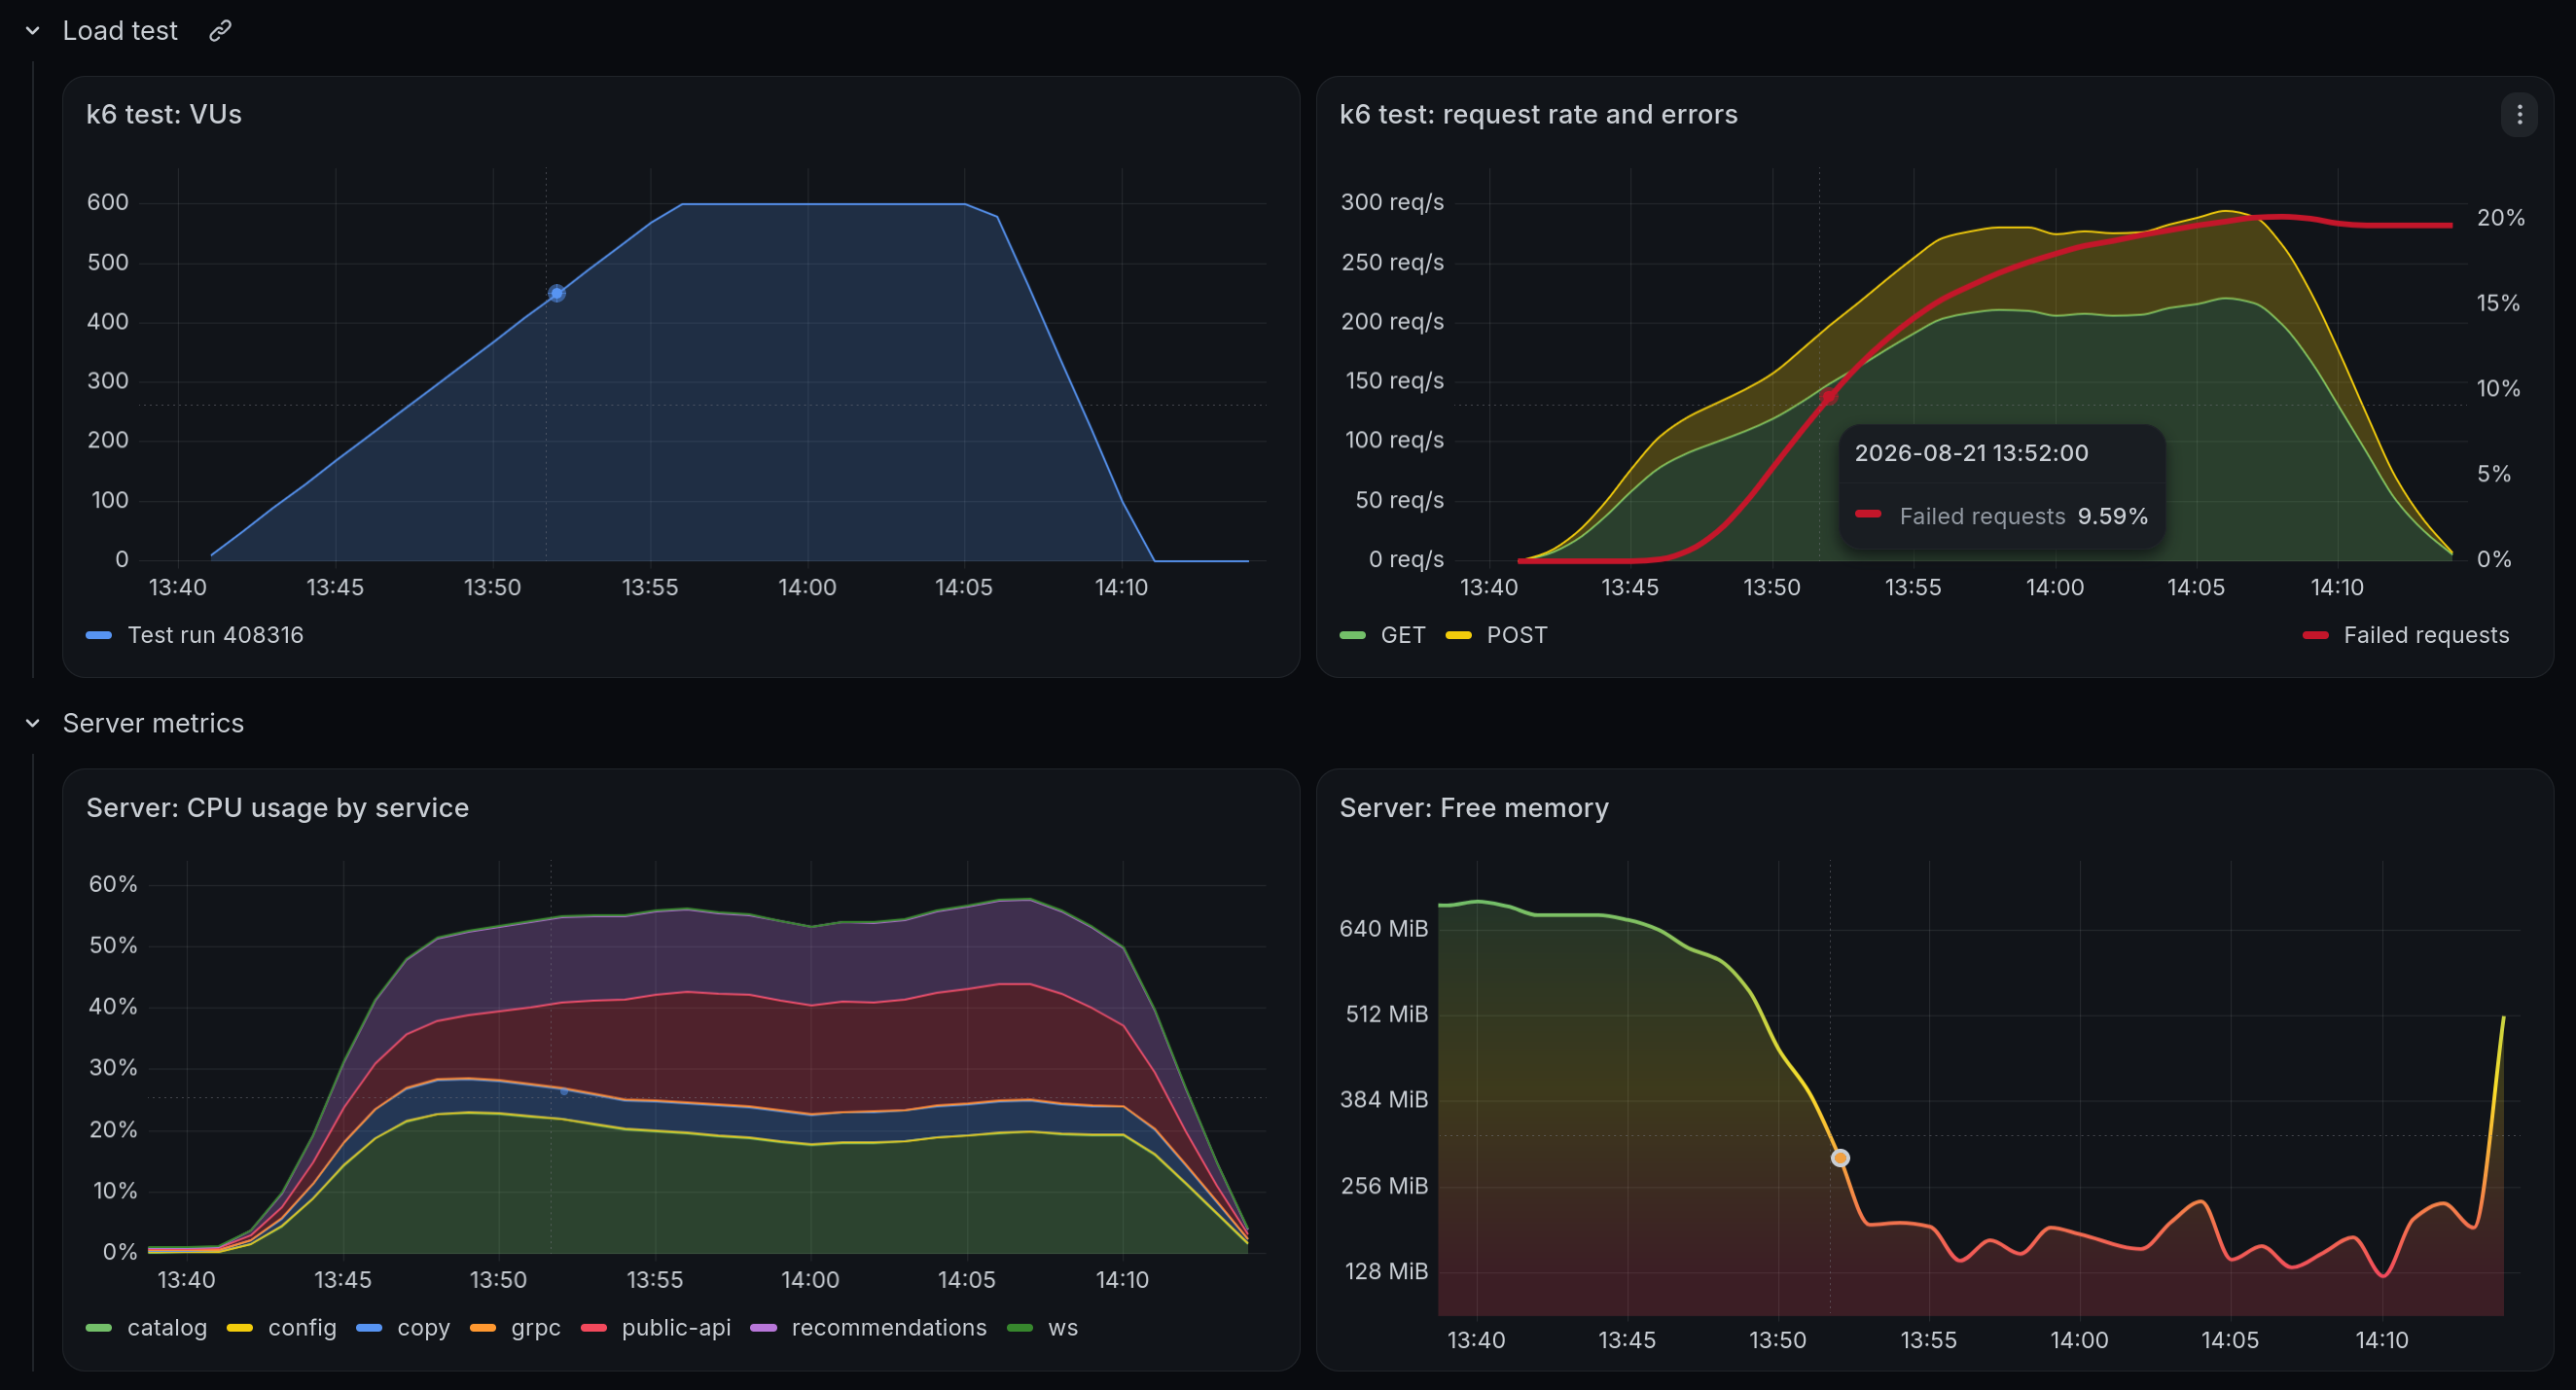
Use your stack’s Prometheus data source in Explore, custom dashboards, and Grafana Alerting. Labels identify the project, test, and test run, so you can compare runs of the same test or track metrics across releases. You can also query from the command line to read test results in CI pipelines without exporting them.
These metrics count toward your Grafana Cloud Metrics usage. For billing details and ways to manage cardinality, refer to Reduce Grafana Cloud Performance Testing costs.
By default, test result metrics are visible to all users with query access to your stack’s Prometheus data source. To restrict access along project boundaries, refer to Configure LBAC.
