
 Explore busy panels with the new View panel sidebar
Explore busy panels with the new View panel sidebar
When a graph packs in dozens of series, understanding which ones share an anomaly means visually tracing overlapping lines. Plus, if you’re a viewer, you can’t toggle the legend or stacking to get a clearer look, because those options live in edit mode.
Now, the View panel sidebar provides controls to explore it on the spot. You don’t need edit permissions, and nothing you change touches the saved dashboard.
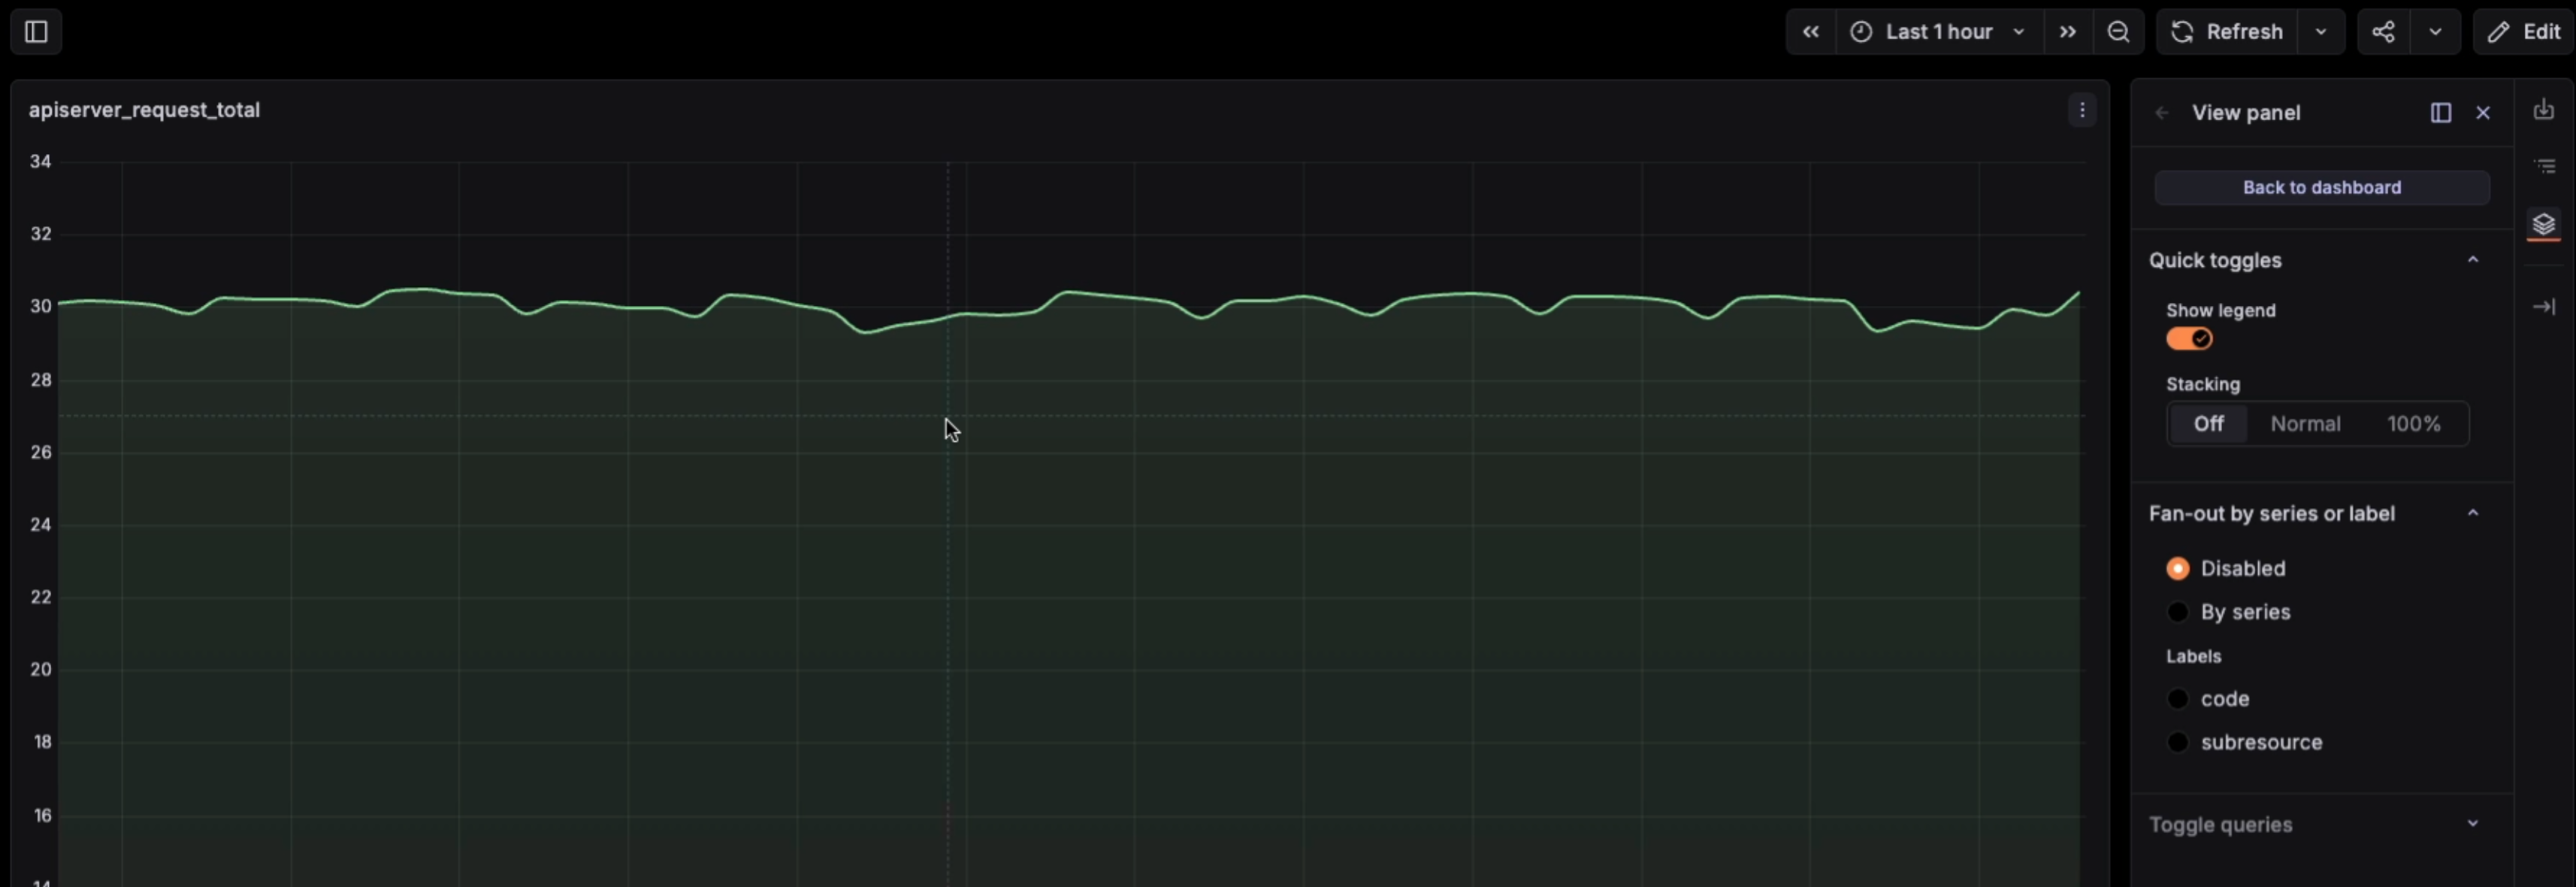
Open any panel in view mode and the View panel sidebar appears alongside it, with two kinds of controls:
- Quick toggles let you update common visualization options, like the legend or stacking, while you read the data.
- Fanout splits one graph into multiple graphs, one per series or label value. If you see a latency spike in a graph with several series, fanning out by label shows you which services are actually causing the graph line to spike.
The available quick toggles and fanout support are defined by each panel plugin, so the controls vary by visualization type.
The View panel sidebar is in public preview and enabled by default. To turn it off, disable the grafana.viewPanelPane feature toggle.
There’s supposed to be a video here, but for some reason there isn’t. Either we entered the id wrong (oops!), or Vimeo is down. If it’s the latter, we’d expect they’ll be back up and running soon. In the meantime, check out our blog!
For more details, check out the documentation.
