
What's new from Grafana Labs Triage your cloud environment faster with the Cloud Provider home page
Triage your cloud environment faster with the Cloud Provider home pageWhat's new from Grafana Labs

Triage your cloud environment faster with the Cloud Provider home page
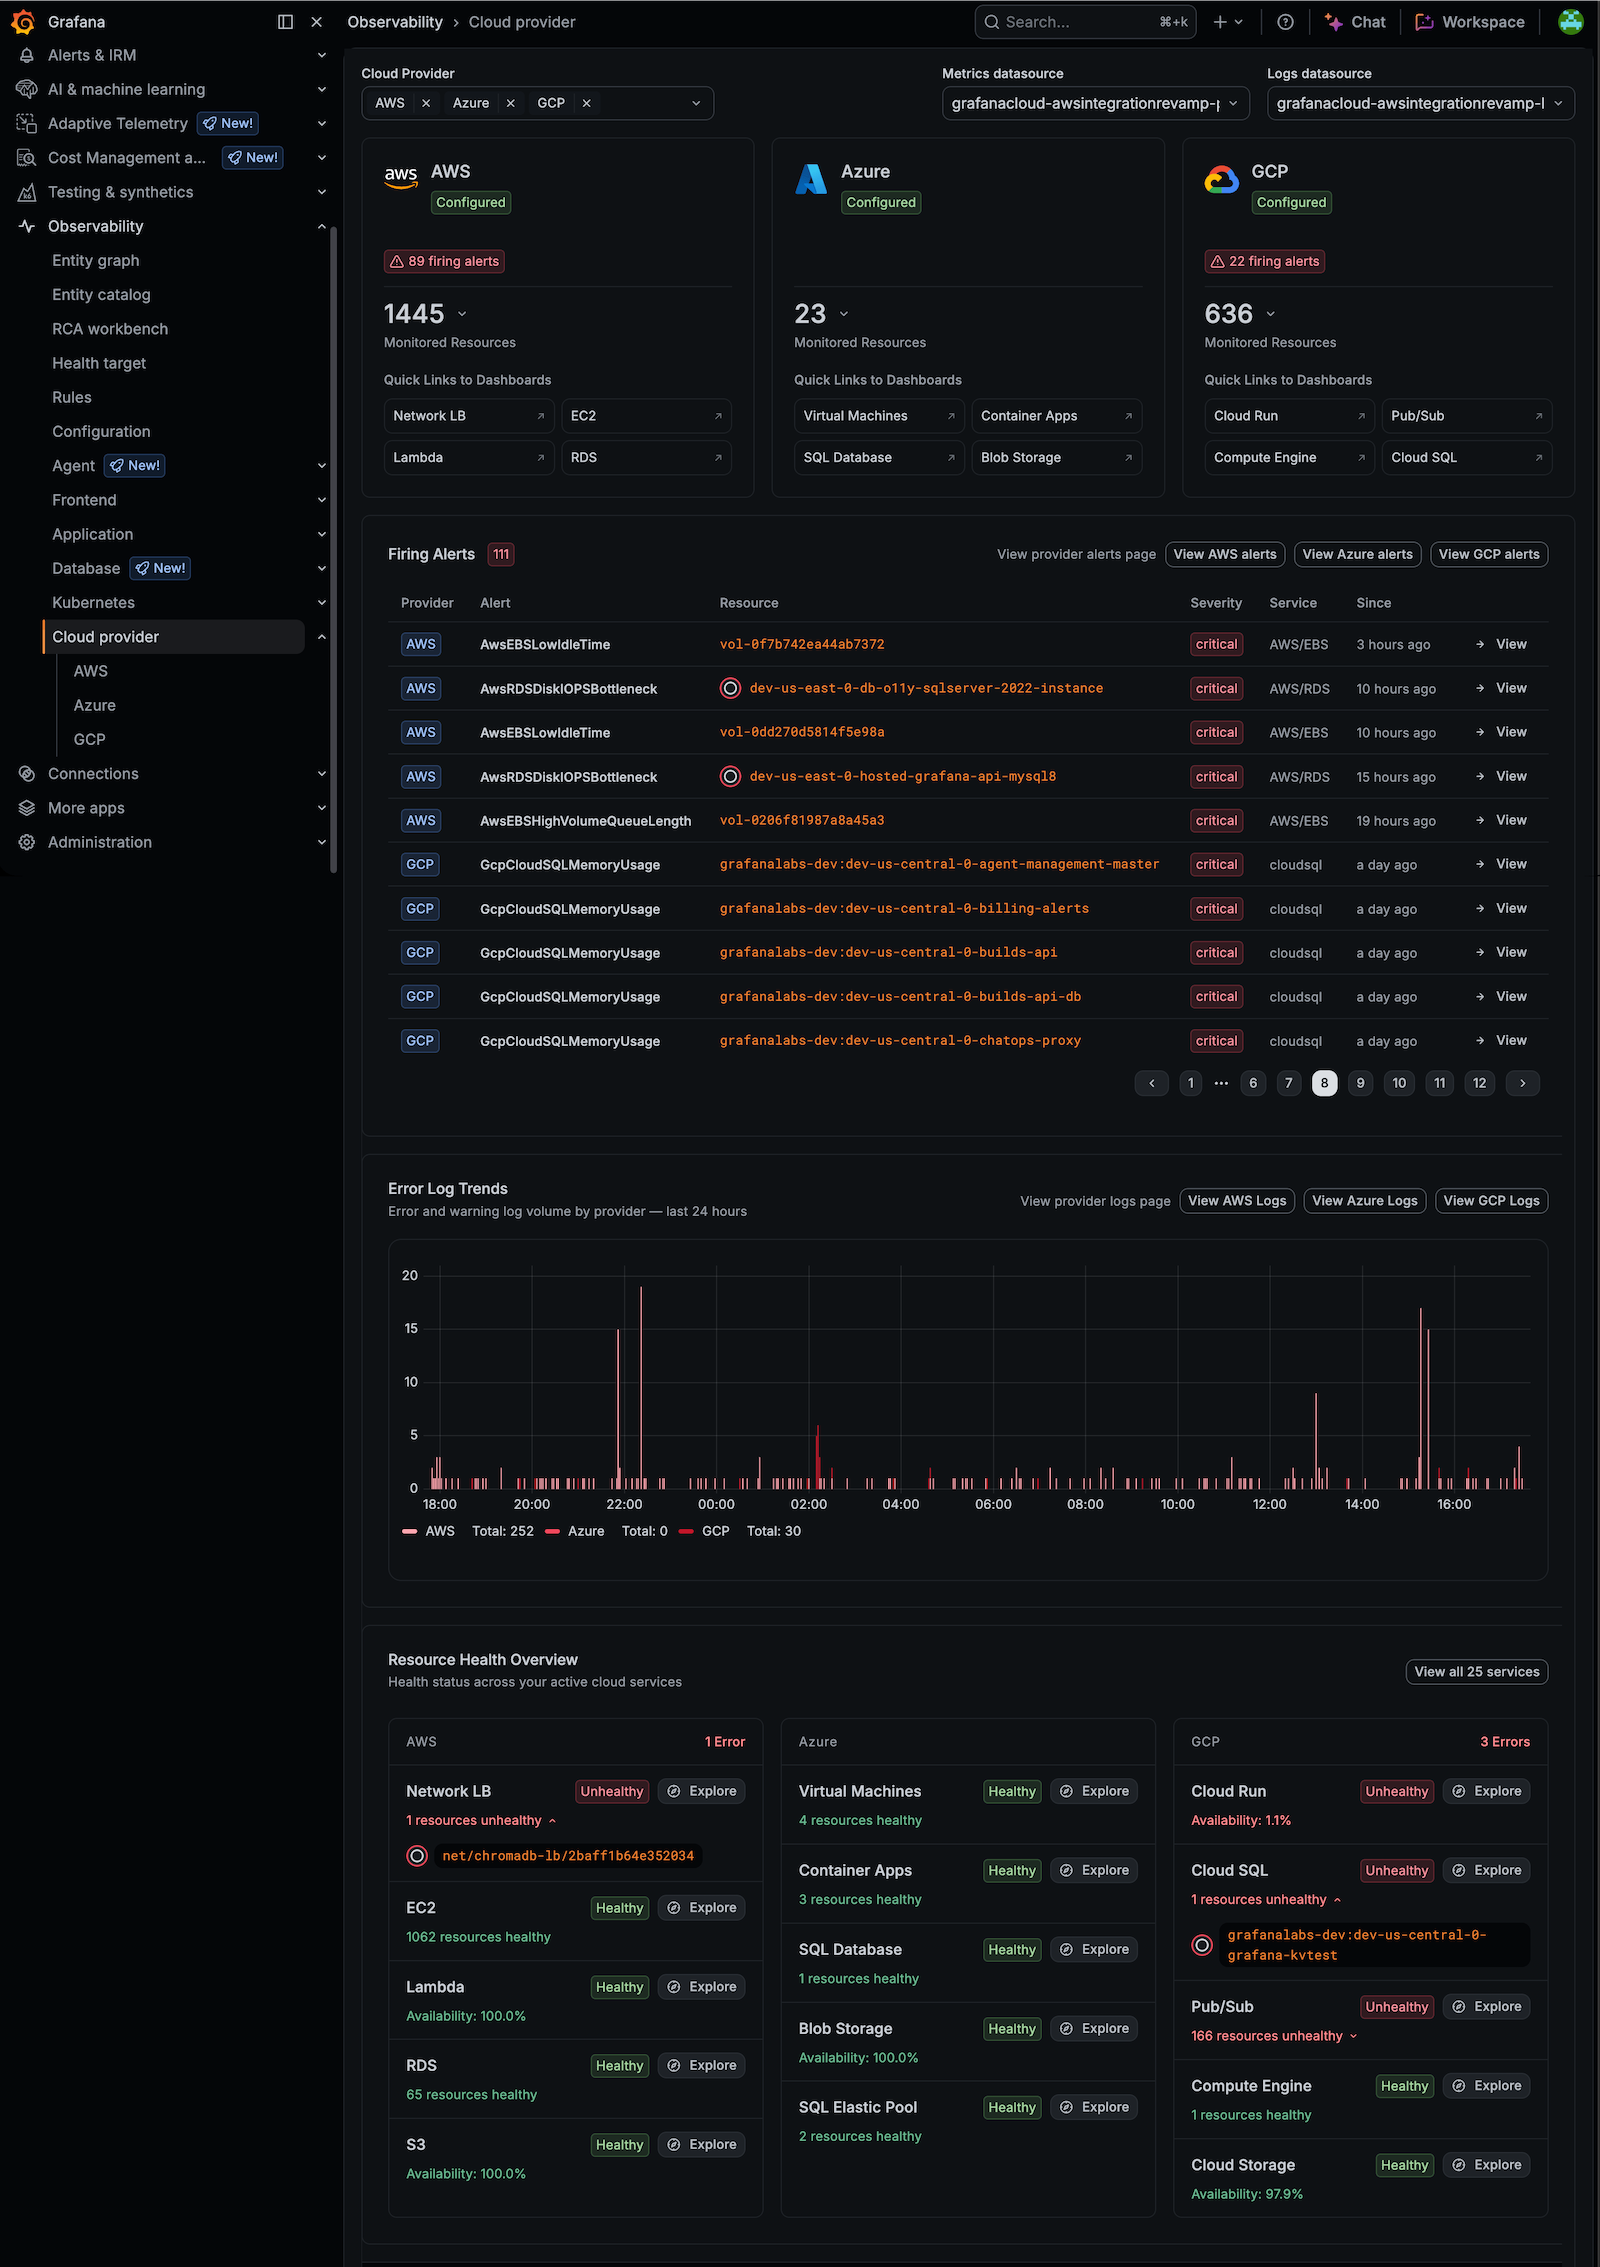
The Cloud Provider Observability home page is now a live summary of your environment instead of static introductory content. Once you configure at least one provider, the page brings together the signals that need your attention across AWS, Azure, and GCP, so you can triage from one place and decide where to look next.
From the home page, you can:
- Get a bird’s-eye view of resource counts, alerts, error logs, and health for every configured provider at a glance.
- Review firing alerts across all selected providers in a single table, then jump straight to an alert or a provider’s alerts page.
- Spot error trends with error and warning log volume by provider over the last 24 hours.
- Check resource health for compute, storage, and database services, with an at-a-glance status badge and a summary that tells you the scope and severity behind it.
- Focus on what you use by filtering to specific providers, with your selection saved to the URL so you can bookmark and share a filtered view.
Related What's new posts
