
What's new from Grafana Labs New panel query errors and notices UI
New panel query errors and notices UIWhat's new from Grafana Labs

New panel query errors and notices UI
We’ve enhanced the panel errors icon to provide more information around query errors and notices.
This update brings three significant updates. First, the icon is dynamic reflecting the highest severity notice on a panel. Second, when you hover your cursor over the icon, there’s a new tooltip showing all the panel errors, sorted by severity. Lastly we’ve added a new Errors and Notices tab in the panel inspector drawer to better view the results.
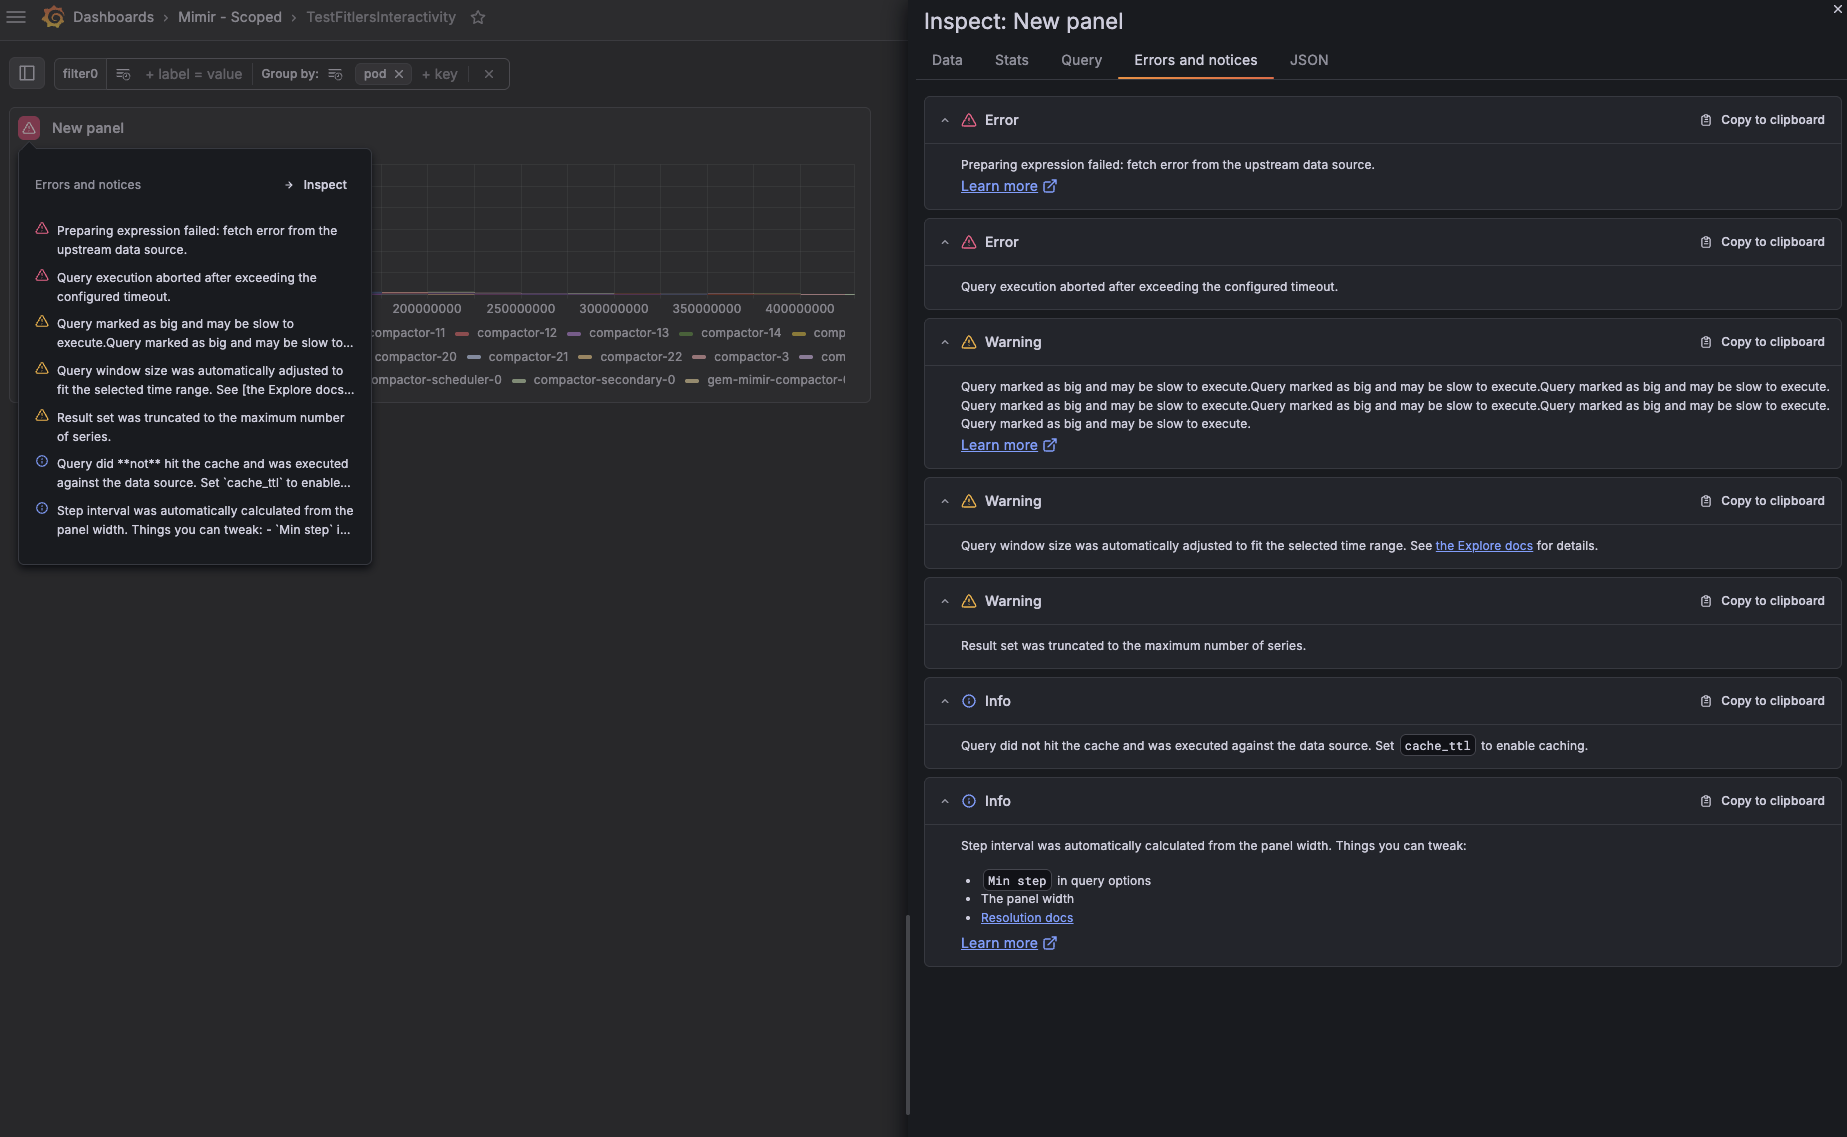
To try out these changes, enable the grafana.newPanelQueryErrorsUI feature toggle.
Related What's new posts
