Organize your Synthetic Monitoring checks in folders
Grafana Cloud Synthetic Monitoring now lets you organize your checks into Grafana Folders. As you create more checks or onboard new teams, a single flat list becomes hard to scan. With folders, you can group checks by team, service, or environment so the right checks are always easy to find and act on a whole group at once instead of one check at a time.
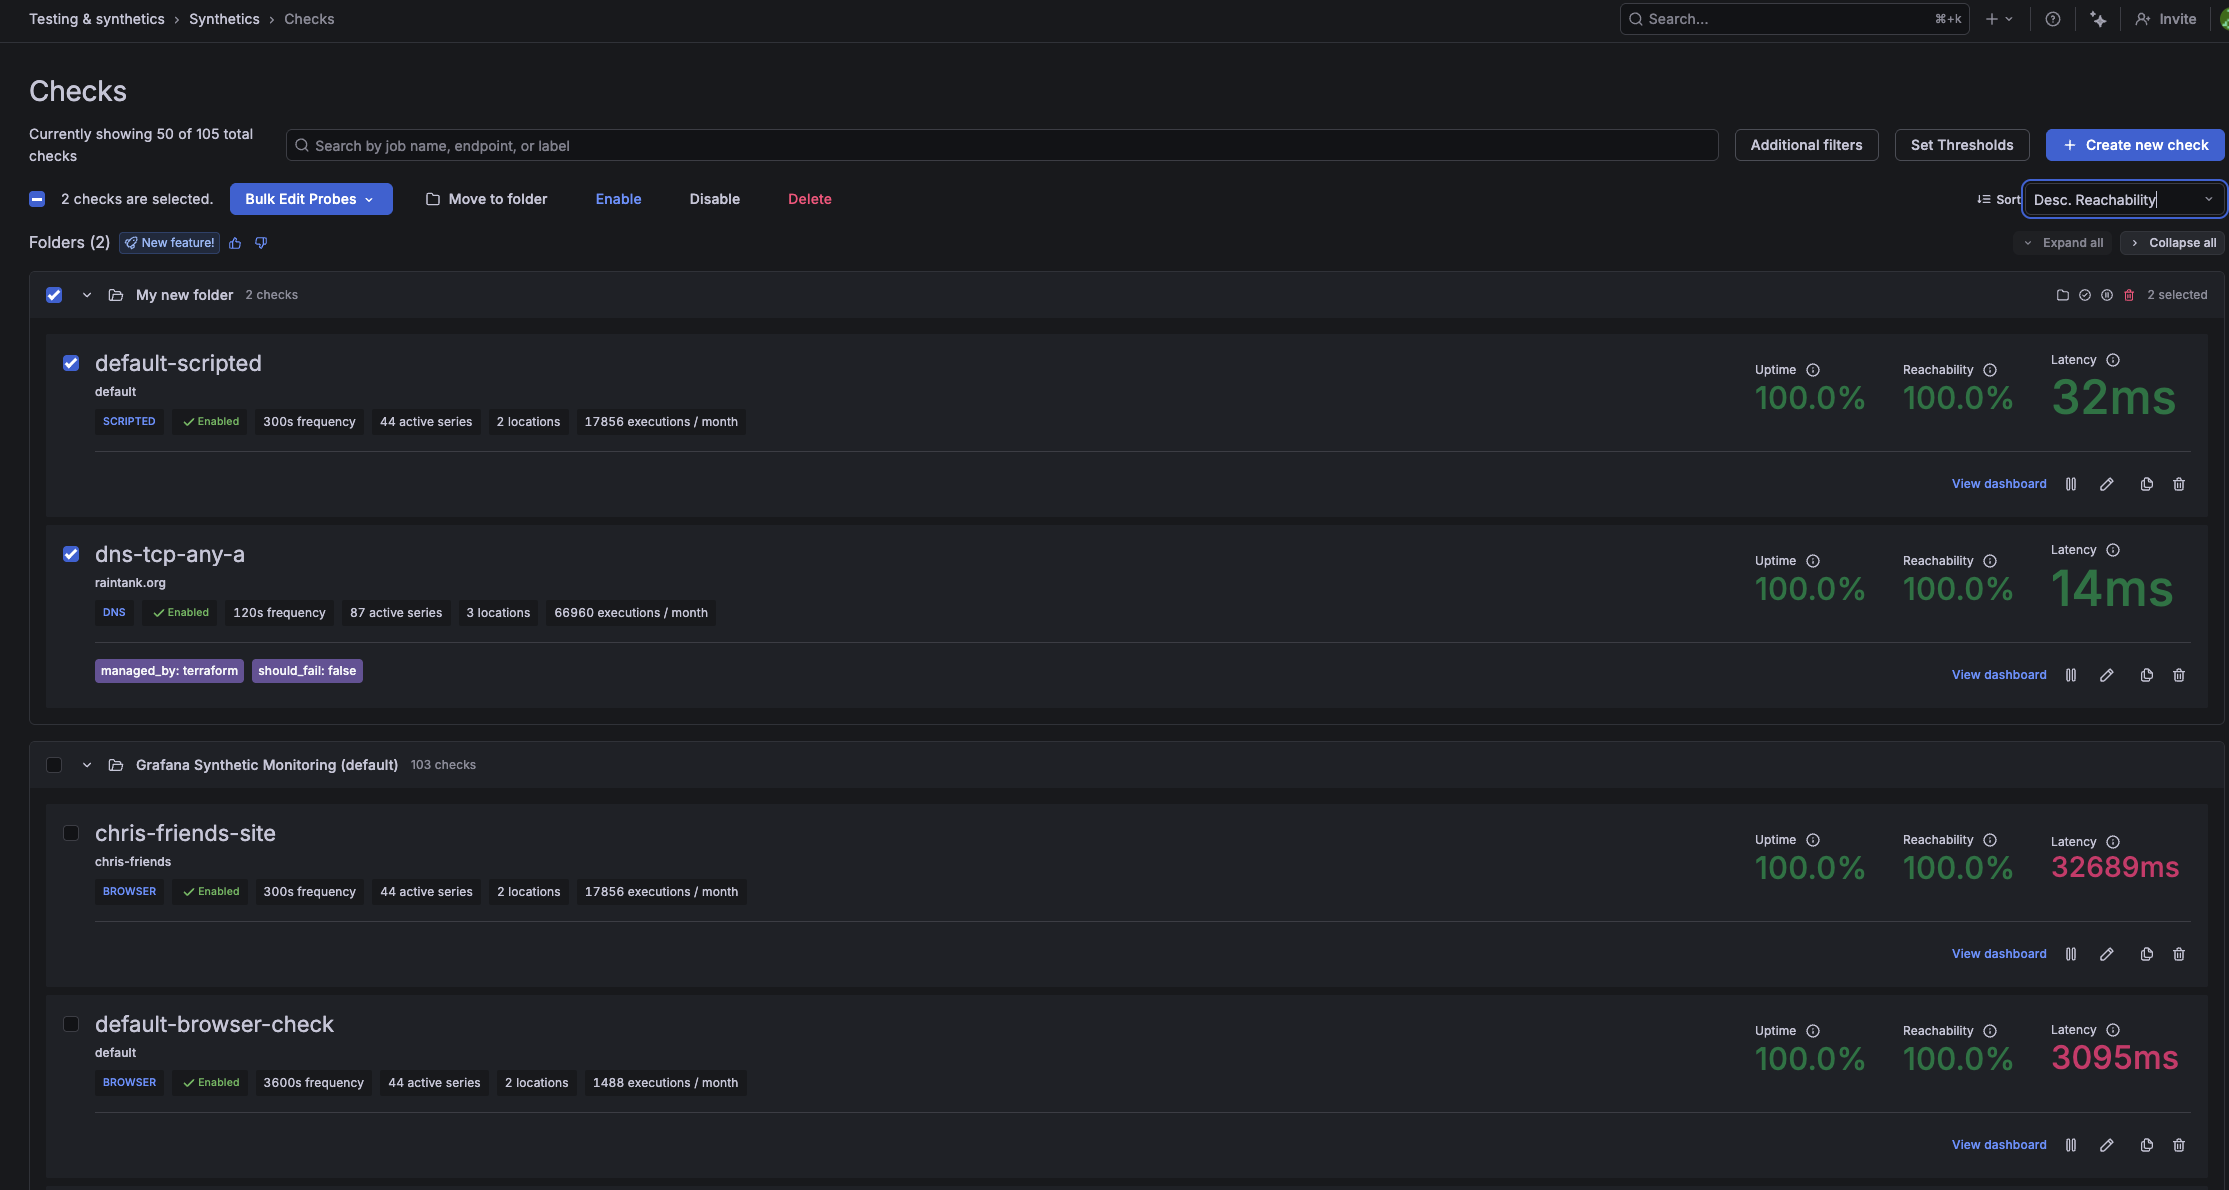
Every check belongs to a folder, organized as a tree under the default Grafana Synthetic Monitoring folder. You can assign a check to a folder when you create or edit it, move one or more checks between folders at any time, and browse your checks in a dedicated folder view. At the folder level, you can enable, disable, move, or delete every check in a folder in a single operation. If a folder is ever deleted, its checks are automatically moved to the default folder and keep running without interruption.
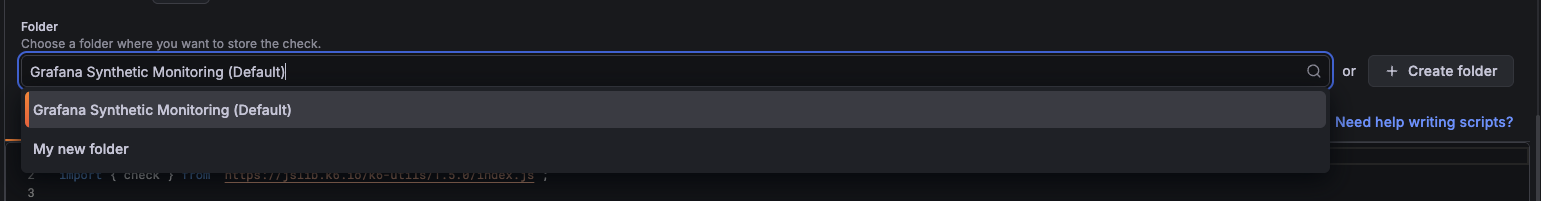
To assign a folder, open any check, go to the Folder field, and select a folder or create a new one. To browse your checks by folder, open Checks in the Synthetics app. The Folder view is shown by default. To browse your checks by folder, open Checks in the Synthetics app. The Folder view is shown by default.
Note: To see the checks in a folder, use the folder view in the Synthetics app. Checks aren’t listed when browsing a folder from the Dashboards page.
To learn more, refer to the Organize checks in folders documentation.