Faster dashboard exploration with quick filters and grouping
Drilling down into your data across a dashboard has traditionally meant working with basic filter controls, re-entering the same filters you used yesterday, and losing track of which filters are active when many are applied. Introducing the new Filter and Group by dashboard control to tackle all of these friction points and make dashboard exploration faster and more intuitive.
This feature replaces ad hoc variables, and extends them by adding grouping for Prometheus and Loki data sources.
One control for filtering and grouping
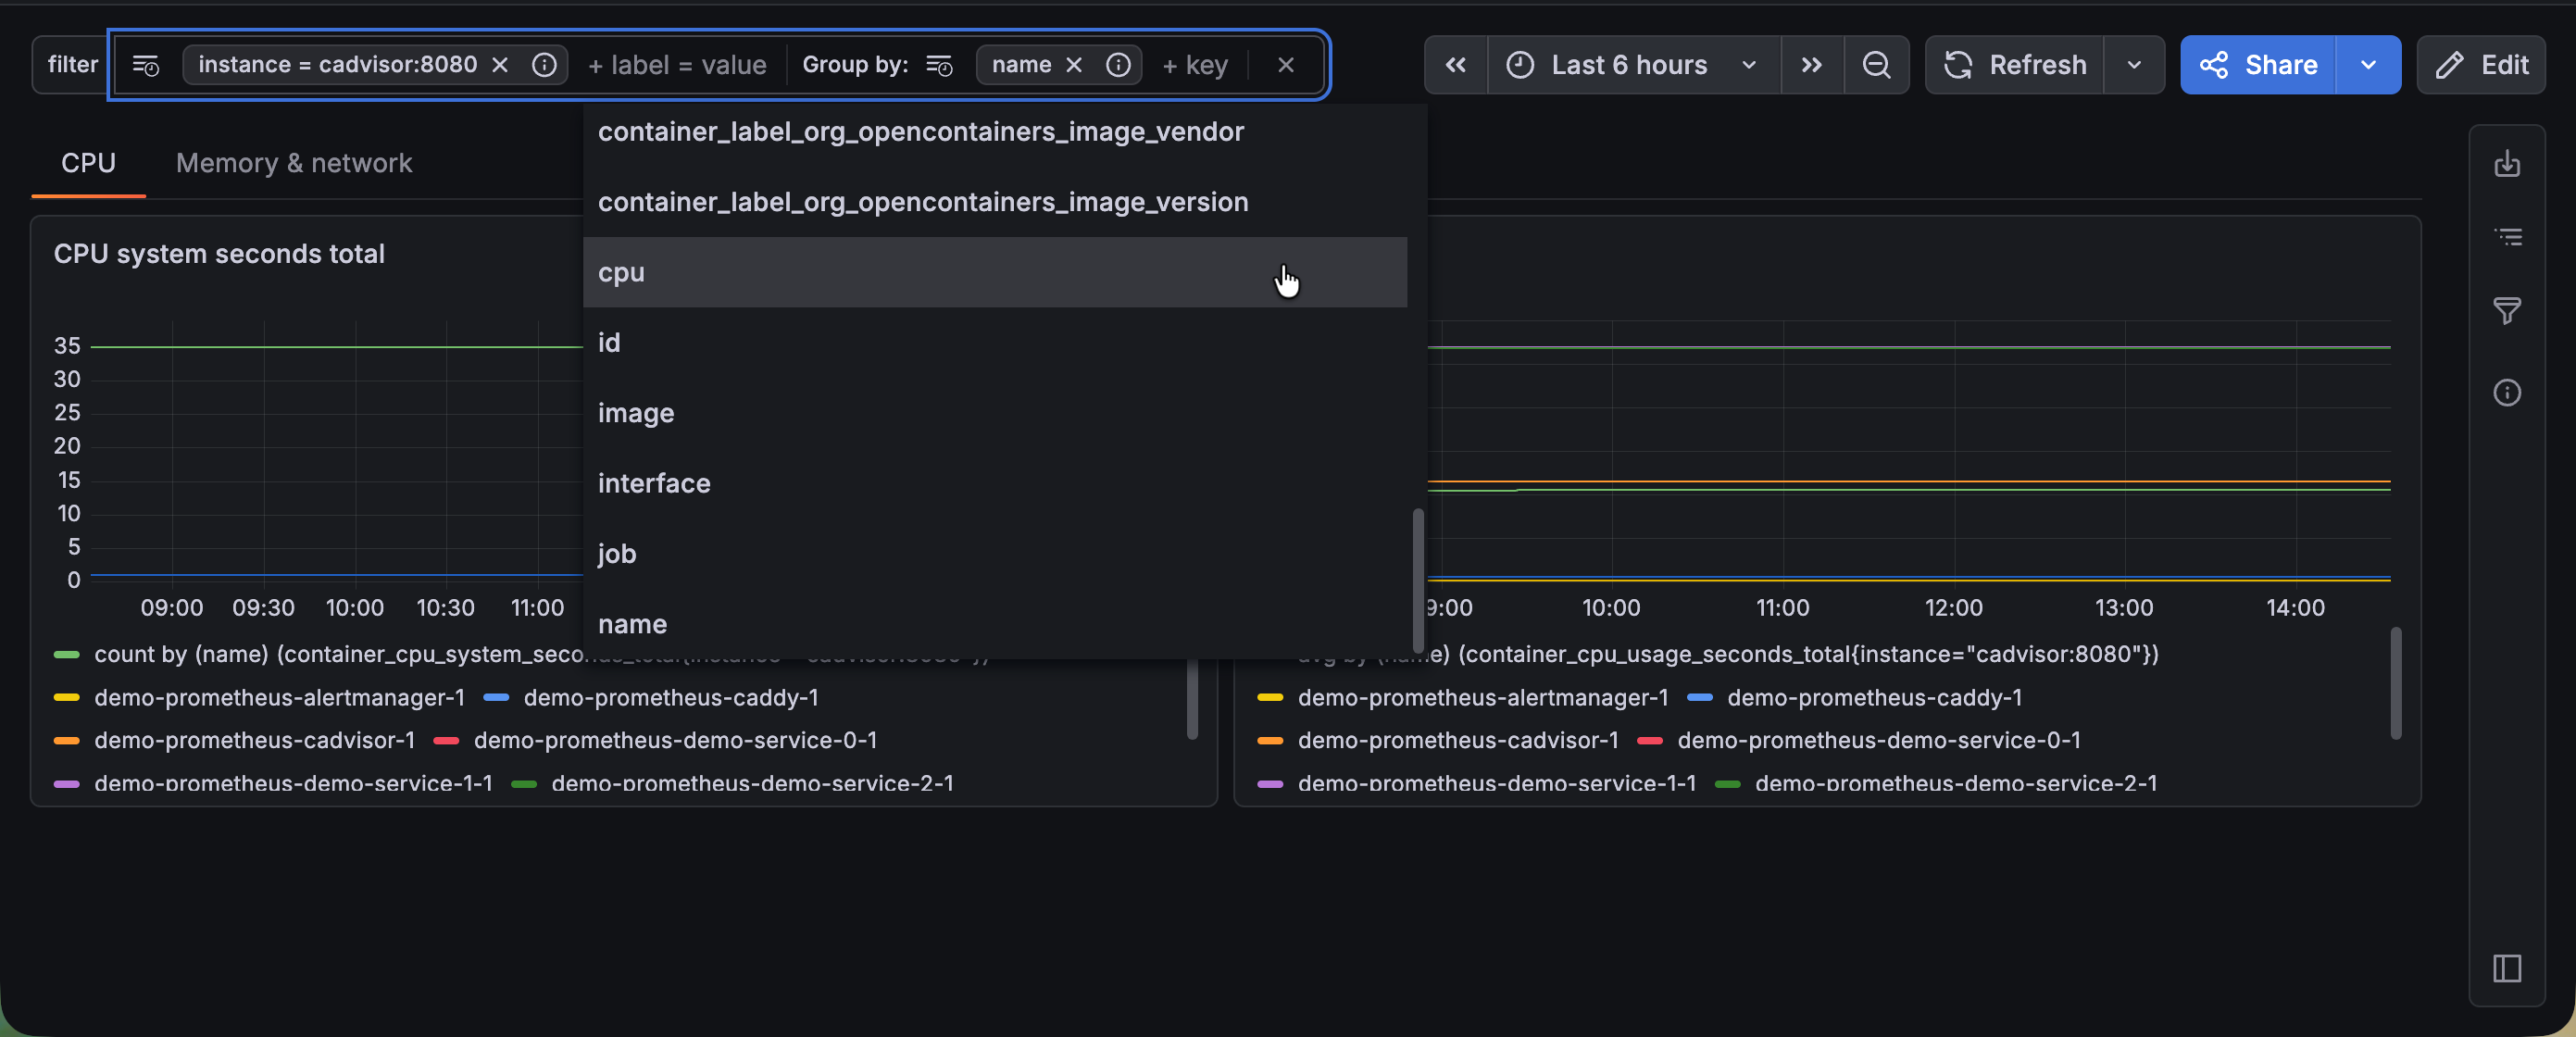
Dashboard filters now support group-by dimensions directly alongside your existing filters, all within a single unified control. This means you can filter your data and choose how to break it down from the same place without the need for separate controls or extra configuration. Want to filter to production traffic and group by region? Do it all in one step. The collapsible pill layout keeps your toolbar clean even when many filters are active, so dashboards stay readable regardless of how deep you drill.
Group by is supported for Prometheus and Loki data sources.
Start from the right context with default values
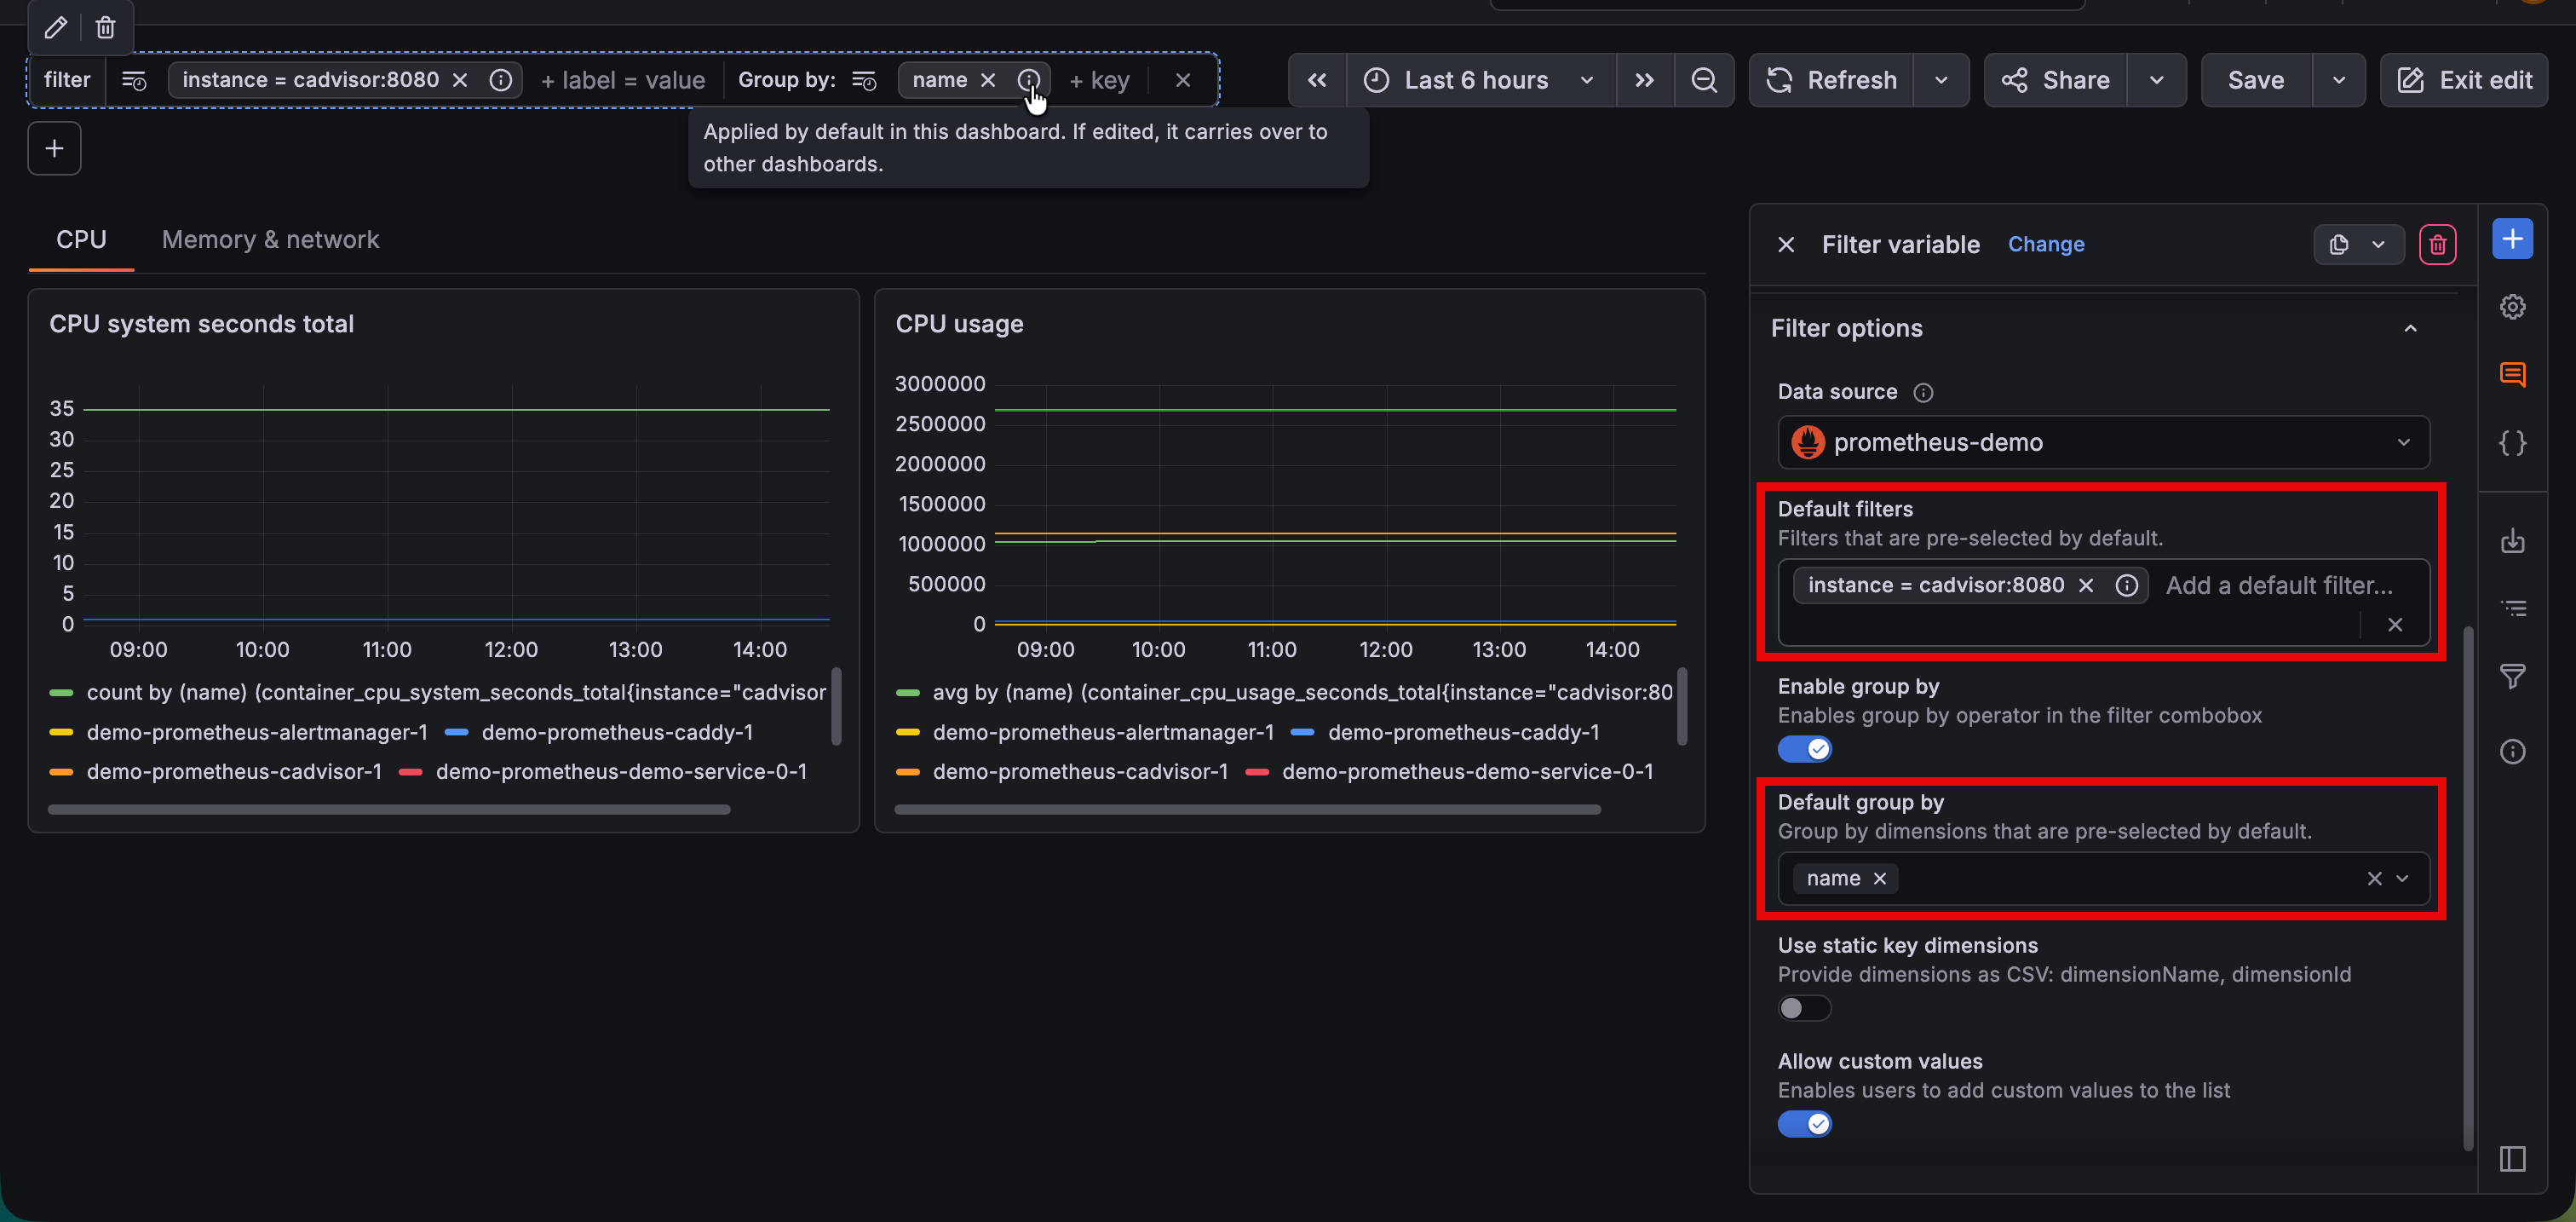
Dashboard authors can now set default filters and group-by dimensions that viewers land on when opening a dashboard. This is especially valuable for teams with agreed-upon starting points—for example, always filtering to production and grouping by region—so every viewer begins their investigation from a meaningful baseline rather than a blank slate. Users can edit these values to further their search and can easily restore to the initial default setup.
Never lose track with filters overview
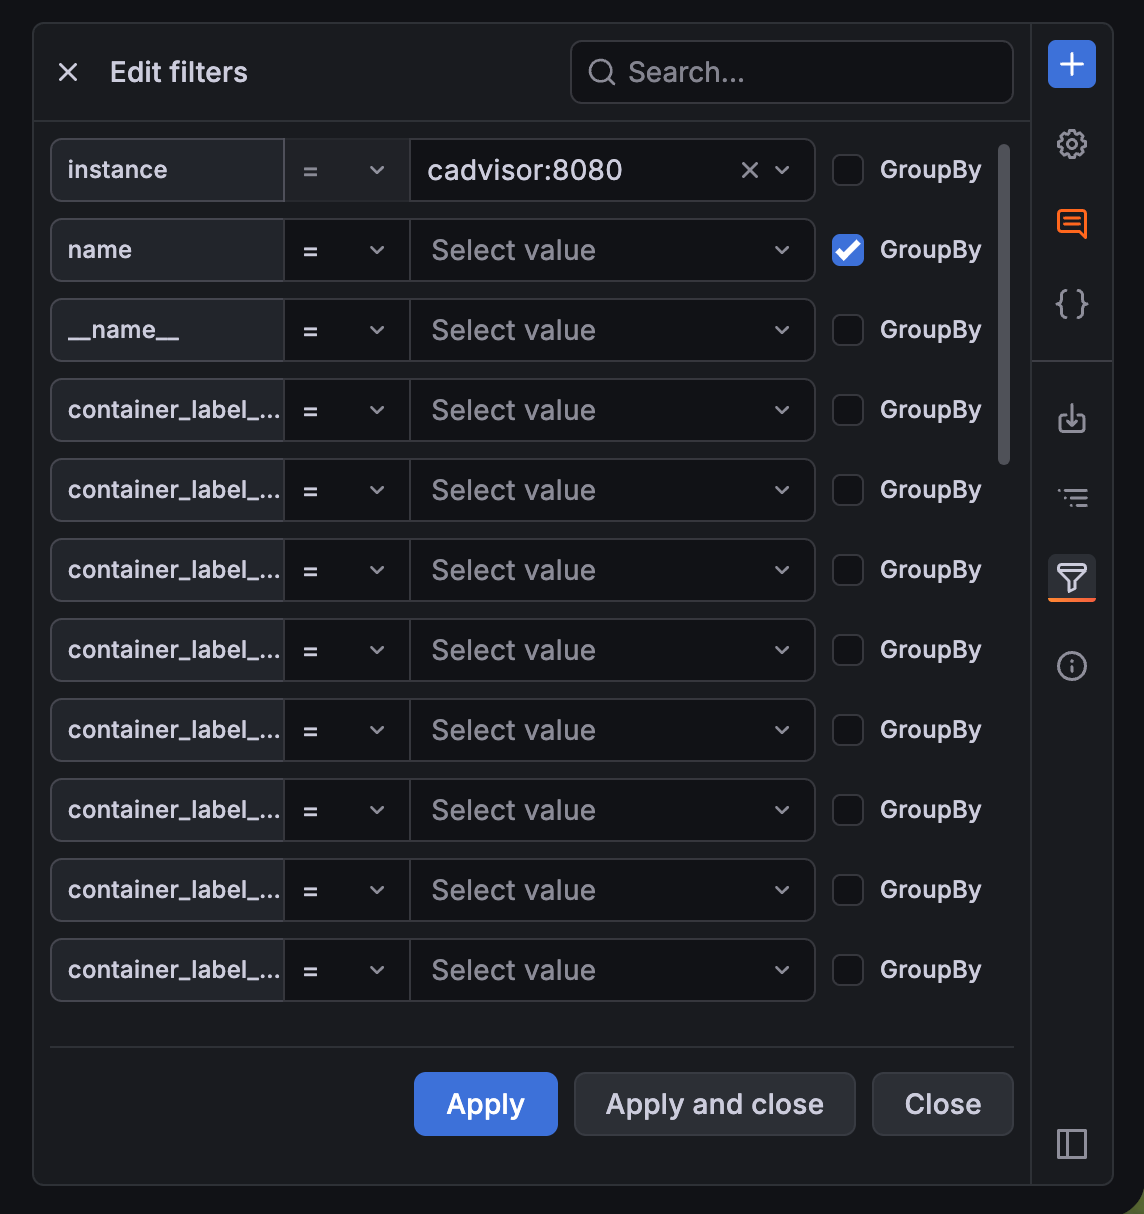
As filters accumulate during an investigation, it becomes easy to forget what’s applied. The new Filters overview gives you a way see every active filter and grouping across the dashboard at a glance, making it simple to understand the current scope of your data and quickly adjust without scrolling through controls.
Pick up where you left off with recent filters
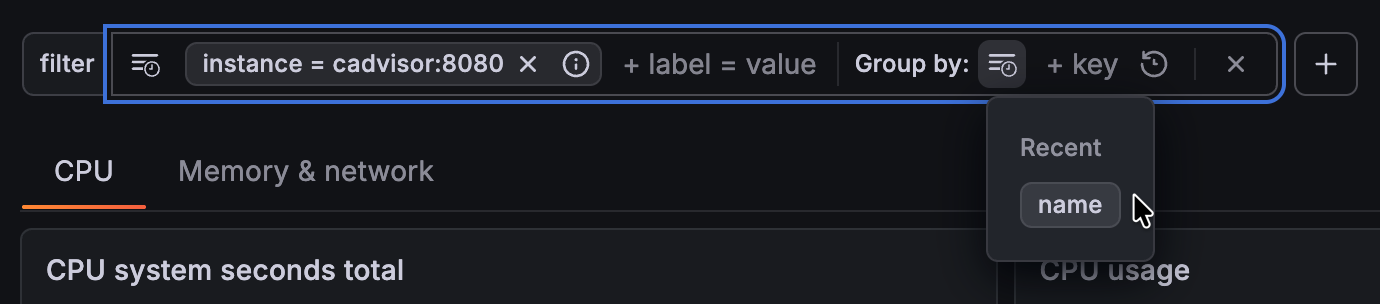
Grafana now remembers your recently used filters and groupings. Instead of re-entering the same labels and keys every session, your most frequent explorations are a single click away.
Drill down from any panel
Previously, drilling down meant going back to the dashboard-level controls. Now you can filter directly from panel tooltips. In time series visualizations, just click a series label to instantly filter in or out by that value. A group-by action in panel headers lets you break down a specific panel’s data by a new dimension on the spot, with this new grouping being reflected in the rest of the dashboard panels. This turns every panel into a starting point for investigation, making exploration feel natural rather than disruptive.
Quick filters and grouping will be rolled out to Cloud instances over the coming weeks.
To try out this feature in self-managed Grafana, enable the dashboardUnifiedDrilldownControls feature flag.
Note
In the dashboard schema, the Filter and Group by control is still referred to as
"kind": "AdhocVariable".