What's new from Grafana Labs Custom tabs in Frontend Observability (Experimental)
What's new from Grafana Labs
Custom tabs in Frontend Observability (Experimental)
Add custom tabs in Frontend Observability that link directly to any Grafana dashboard, so your team can jump to the dashboards without losing context.
Whether it’s a custom performance dashboard, a business metrics view, or a team-specific RUM report, custom tabs let you surface the right context exactly where you need it. Tabs are configured from the Settings page and appear alongside existing navigation tabs once added, making it easy for every team member to access shared dashboards consistently.
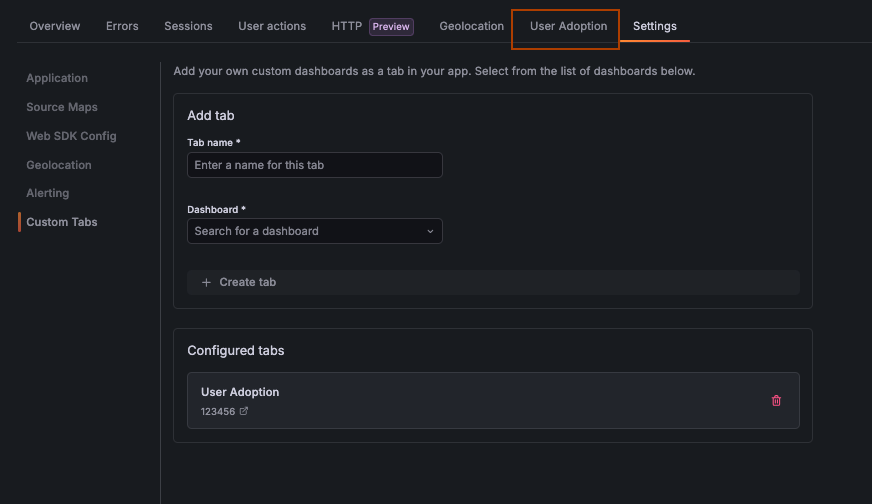
How to use it
Pre-Requisite: You must have Editor or Admin permissions to configure custom tabs.
- Navigate to Frontend Observability in Grafana Cloud.
- Open the Settings page.
- Under Custom tabs, add a tab name and select the Grafana dashboard by name.
- Save. The tab appears immediately in the Frontend Observability navigation.
Note: This is an experimental feature. Functionality may change as we gather feedback.
Related What's new posts