Revamped query editor experience
We’ve redesigned the query editor to make complex panels easier to build and manage. The new experience provides a unified view of your entire data pipeline—queries, expressions, transformations, and related alerts—with clearer visual feedback and faster access to the settings that matter.
Easier pipeline management with the new sidebar
A sidebar displays queries, expressions, and transformations as color-coded cards with visual indicators for state (error, hidden, and disabled), while a footer tracks your total item count at a glance. For pipelines with many queries, expressions, or transformations, you can expand the sidebar to full height to see everything at once.
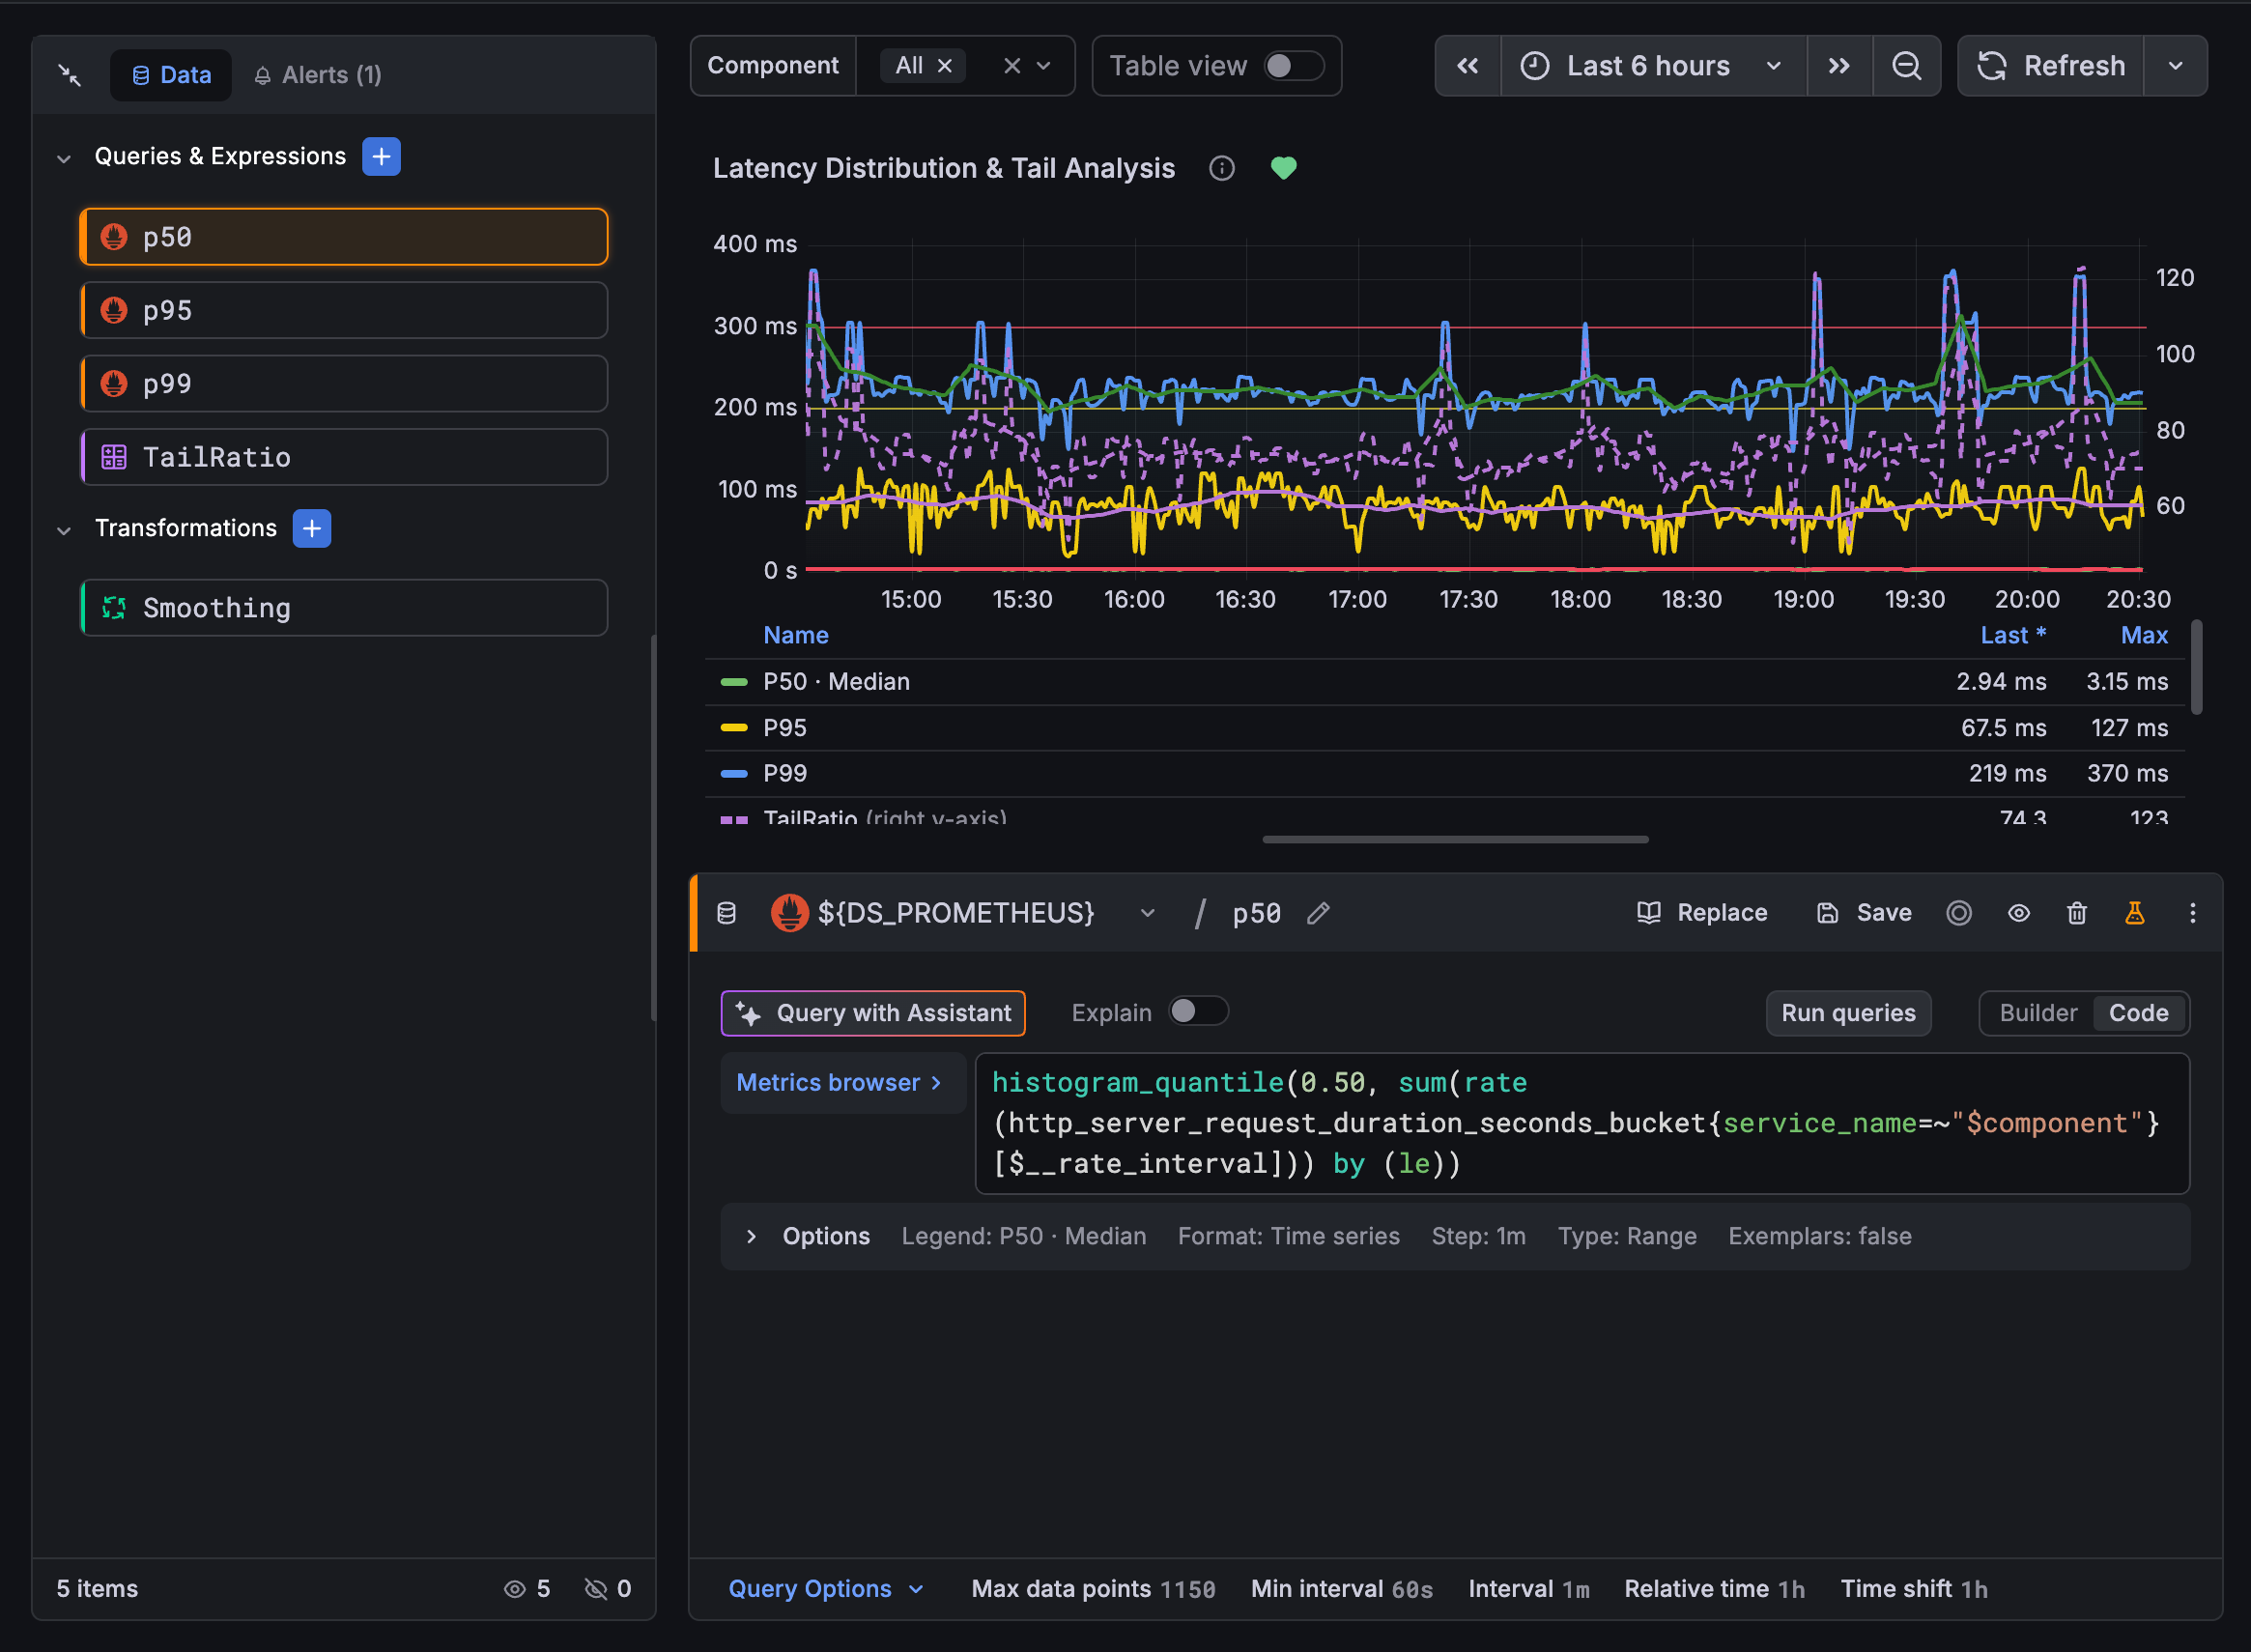
Adding items is easier too. Use the section header buttons or insert them inline with a ghost card preview, then drag and drop to reorder.
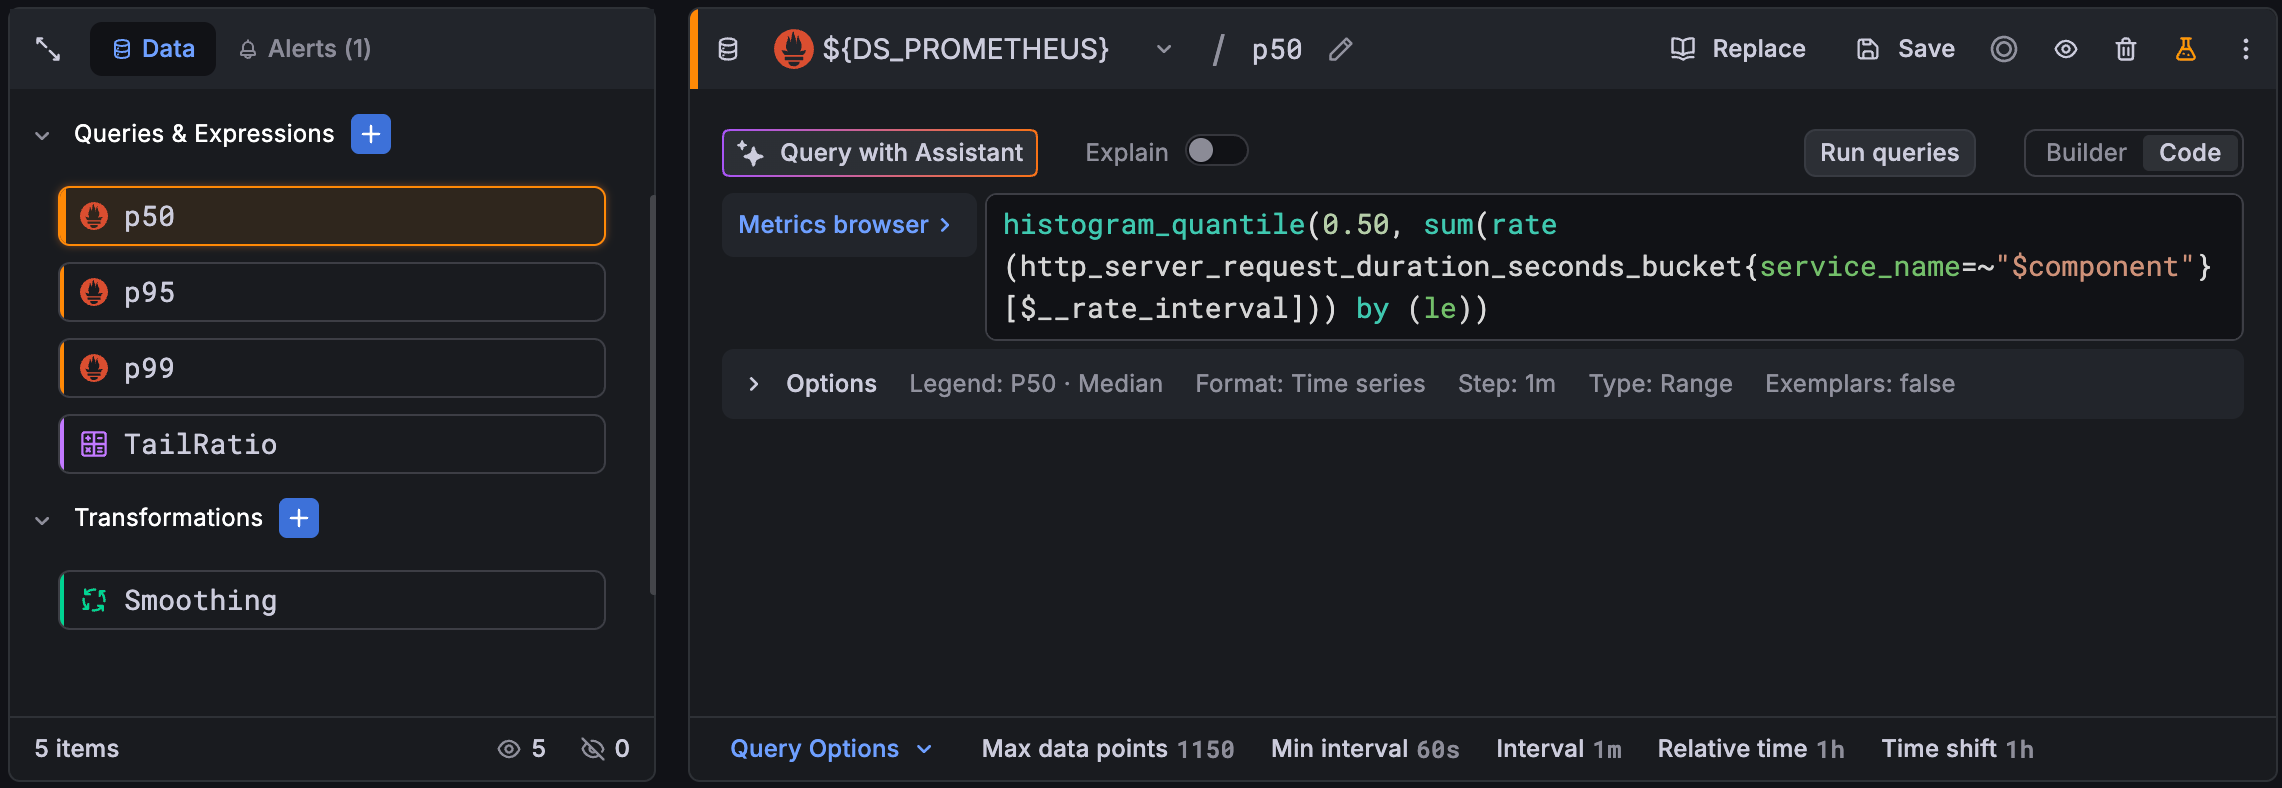
Per-query data source selection
Each query now has its own data source picker. This replaces the previous panel-level selector and makes building multi-source panels more intuitive. Add a Prometheus query, add a Loki query, and the panel automatically switches to “Mixed” mode behind the scenes with no extra steps required.
Inline alert visibility
Alert rules tied to the panel appear in a dedicated Alerts tab, so you can see which rules depend on your panel’s data without navigating away. Each alert is displayed as a card that’s color-coded by its current state (such as firing, pending, or normal) so you can quickly assess alert health.
Query options content footer
The footer surfaces panel-level query options such as max data points, min interval, and time overrides. Clicking any option opens the sidebar with that field already in focus. When query overrides are active, green indicators appear inline, so you can easily spot which settings deviate from the defaults.