No results.
There was an error with your request.
What’s new: Grafana 13 release, the latest in AI, OSS project updates, and more from GrafanaCON2026
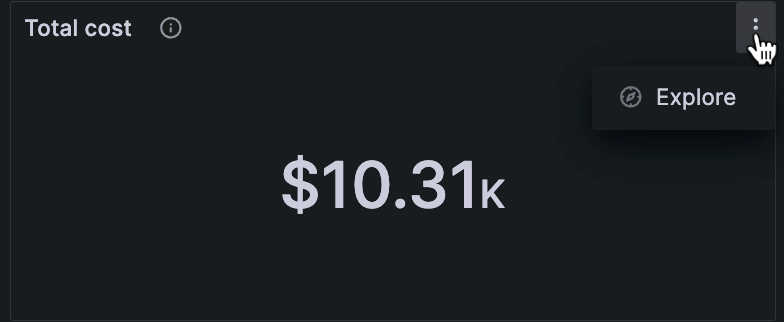
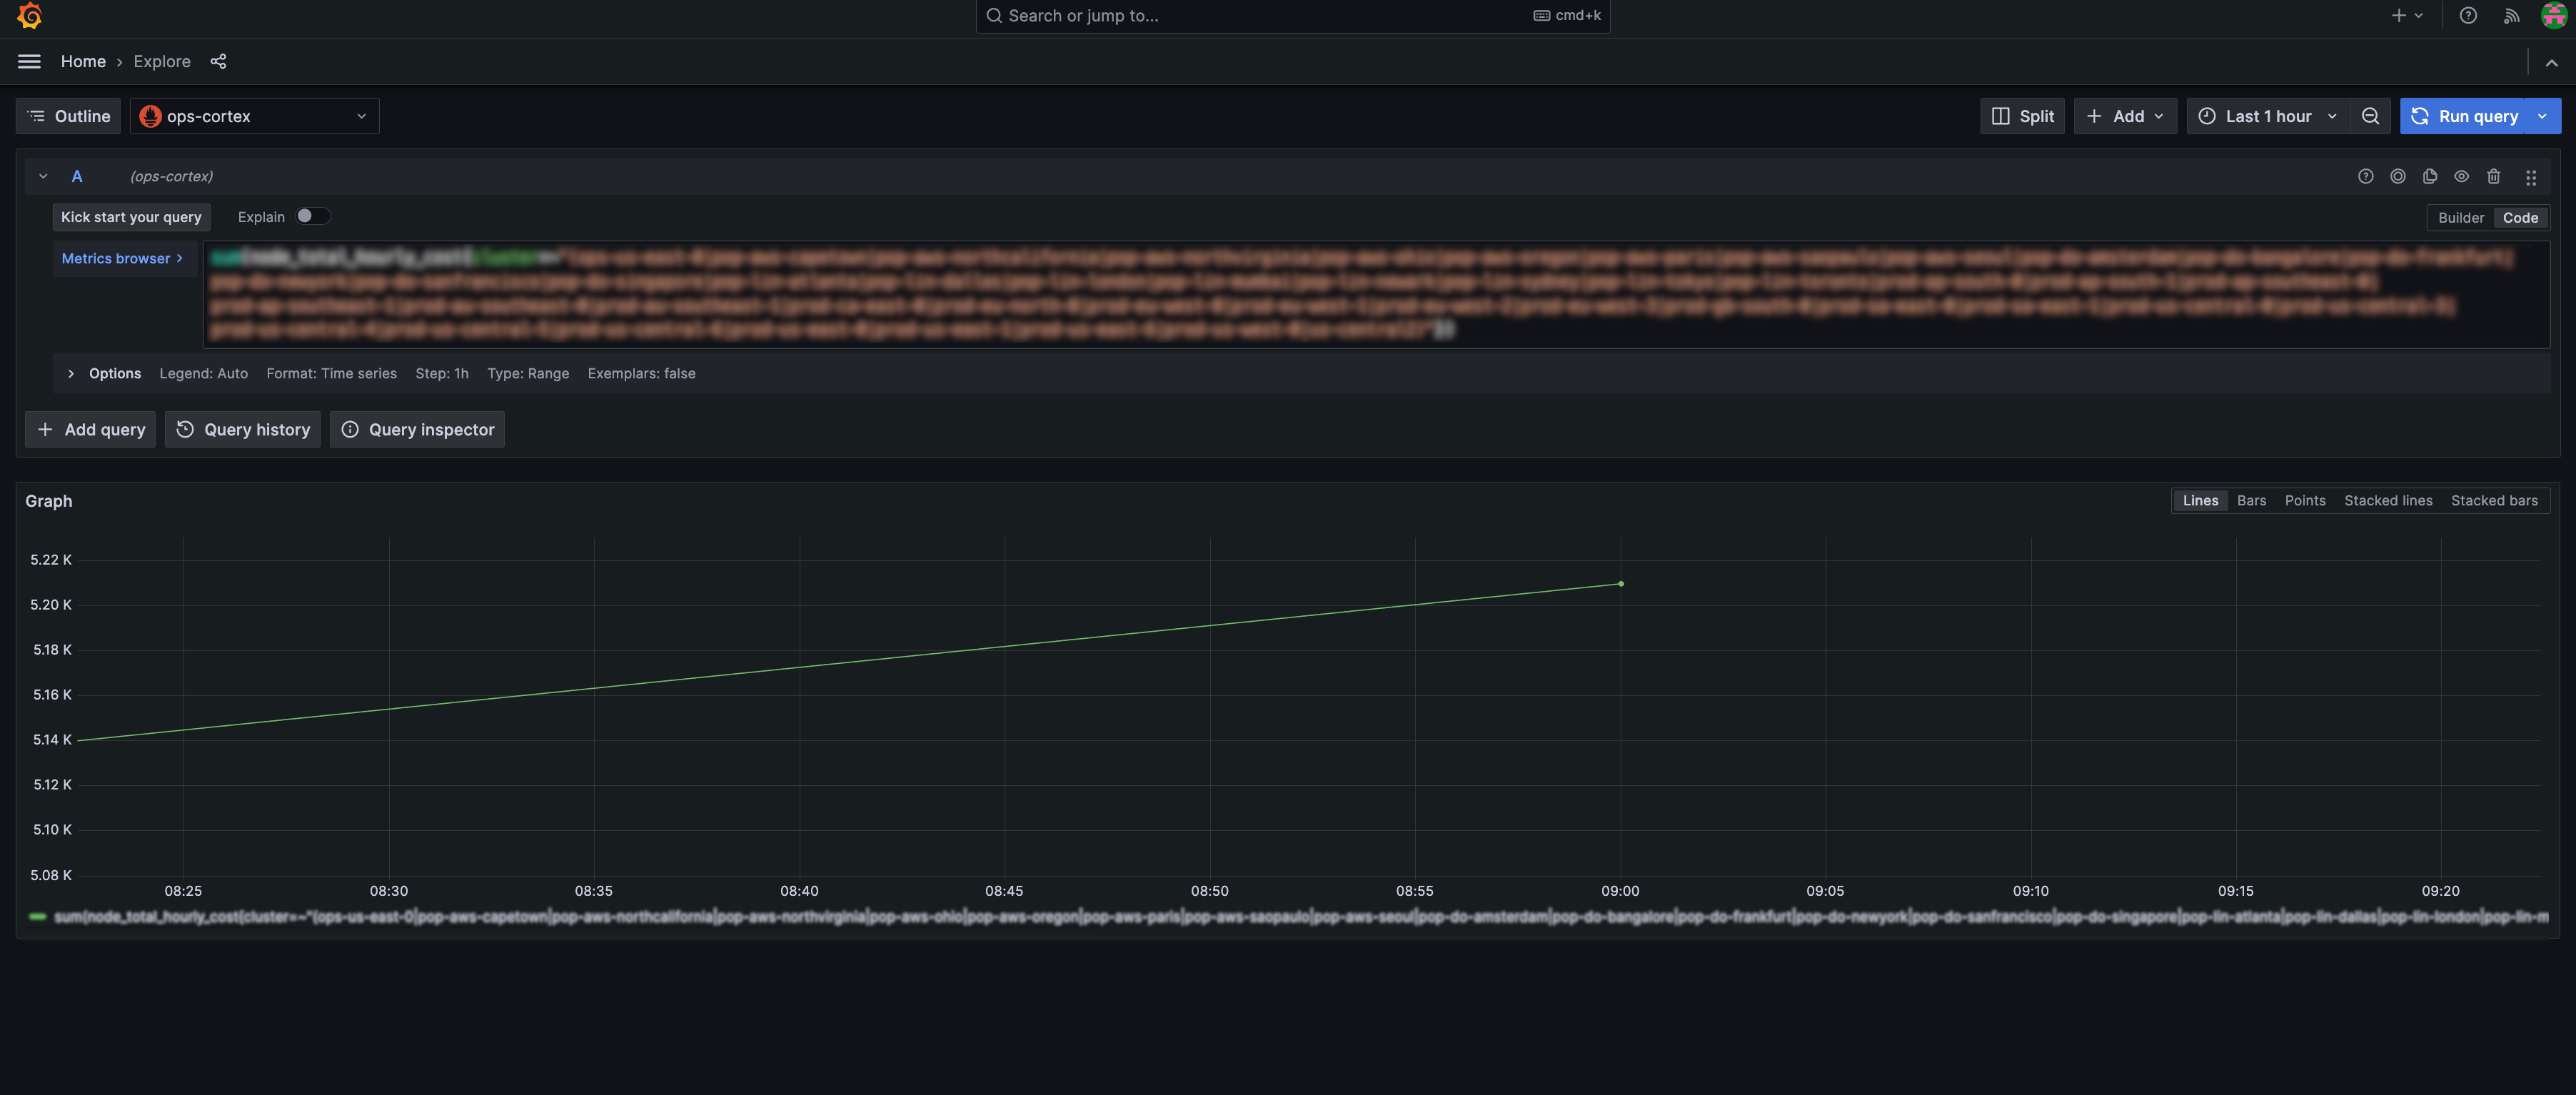
On any panel of the Cost page in Kubernetes Monitoring, click the Explore button.
This launches the query details, where you can debug or create your own dashboard.
 Explore cost queries in Kubernetes Monitoring