Webinars and videos
Premium content at no additional cost.

Upcoming live webinars
Real insights from real experts in real time.

31 Jul
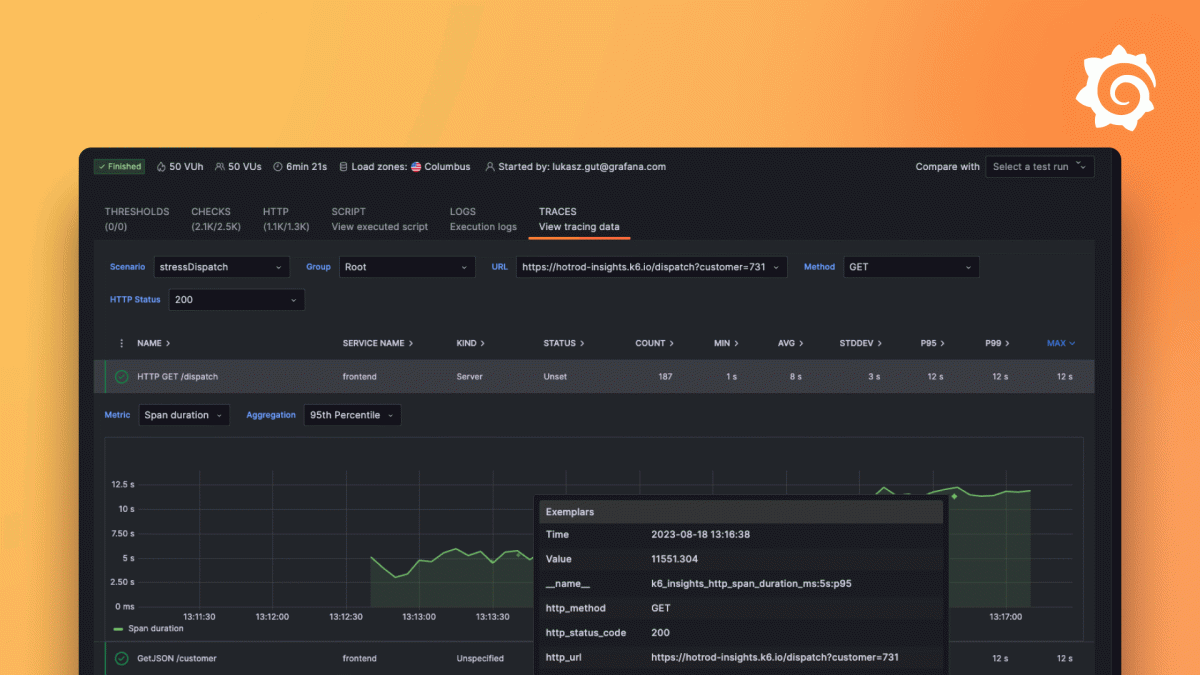
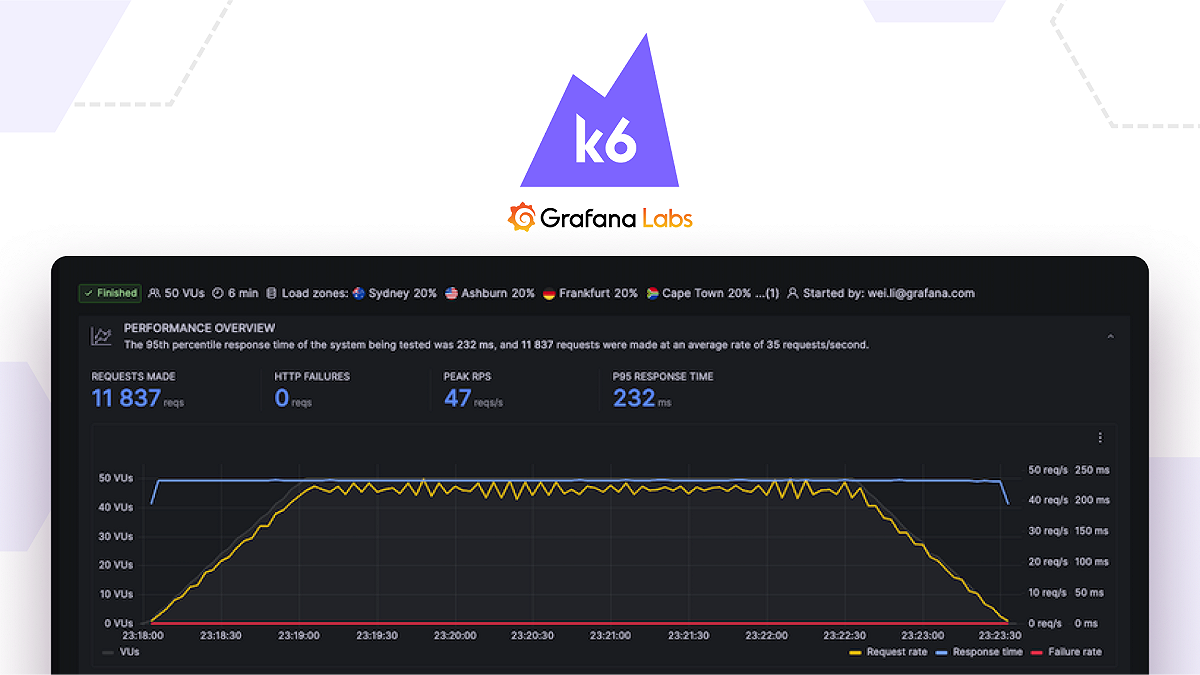
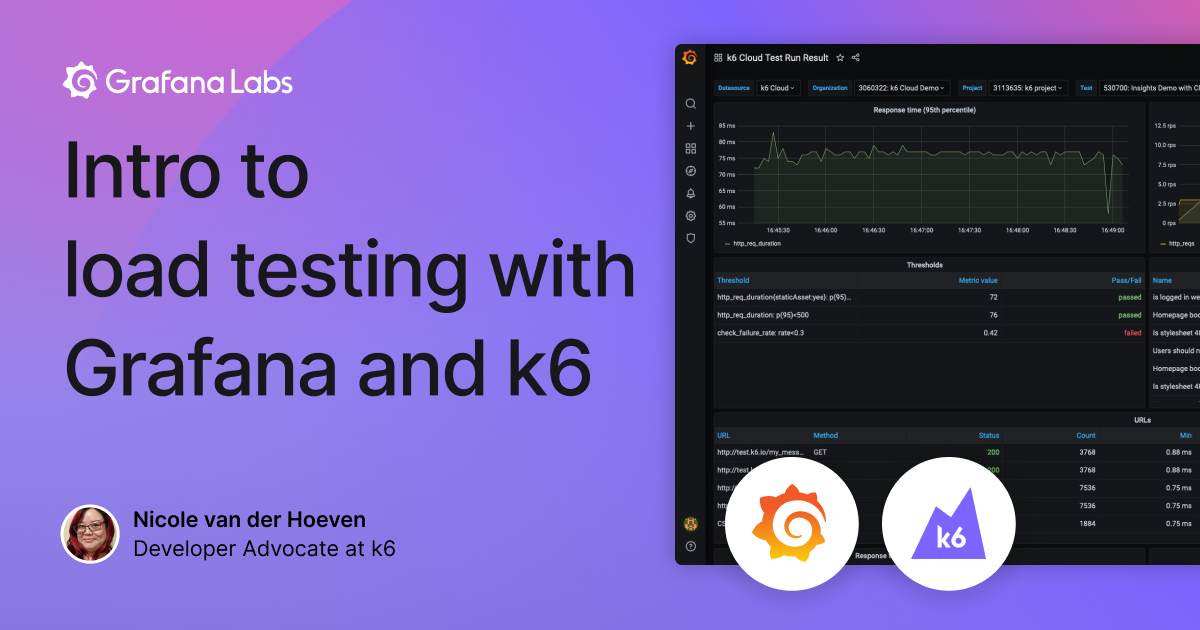
Performance testing and observability in Grafana Cloud
Register

7 Aug
How to get started with OpenTelemetry and Grafana
Register

14 Aug
Mastering code-based instrumentation with OpenTelemetry and Grafana
Register

21 Aug
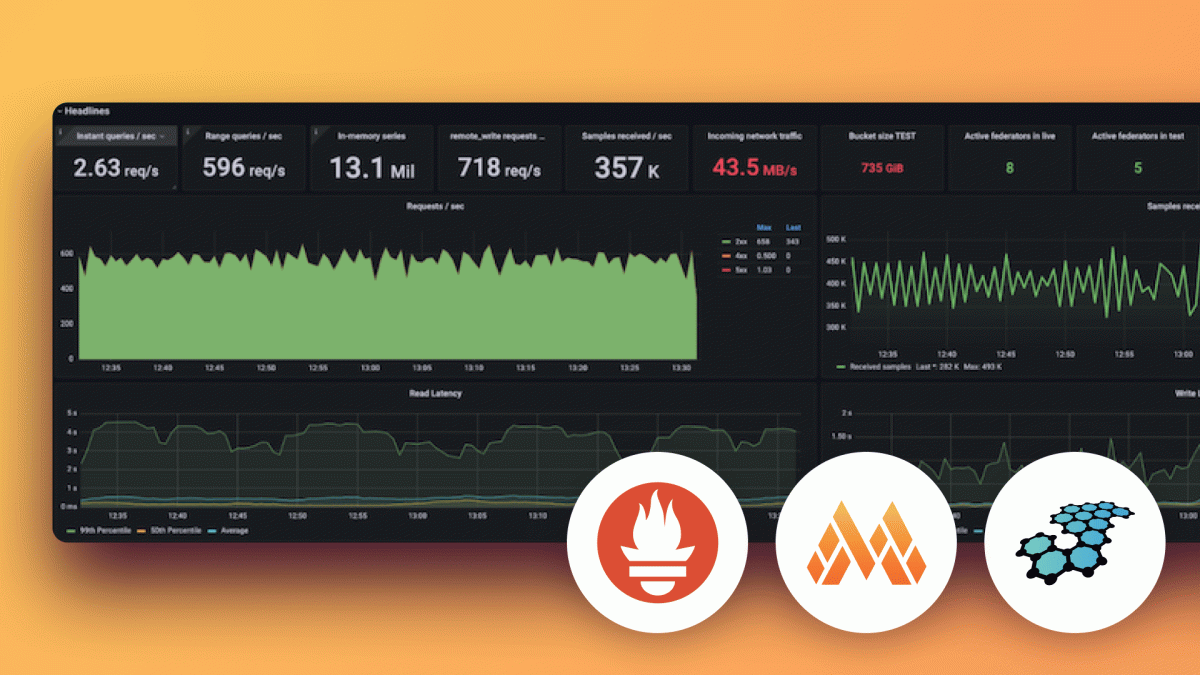
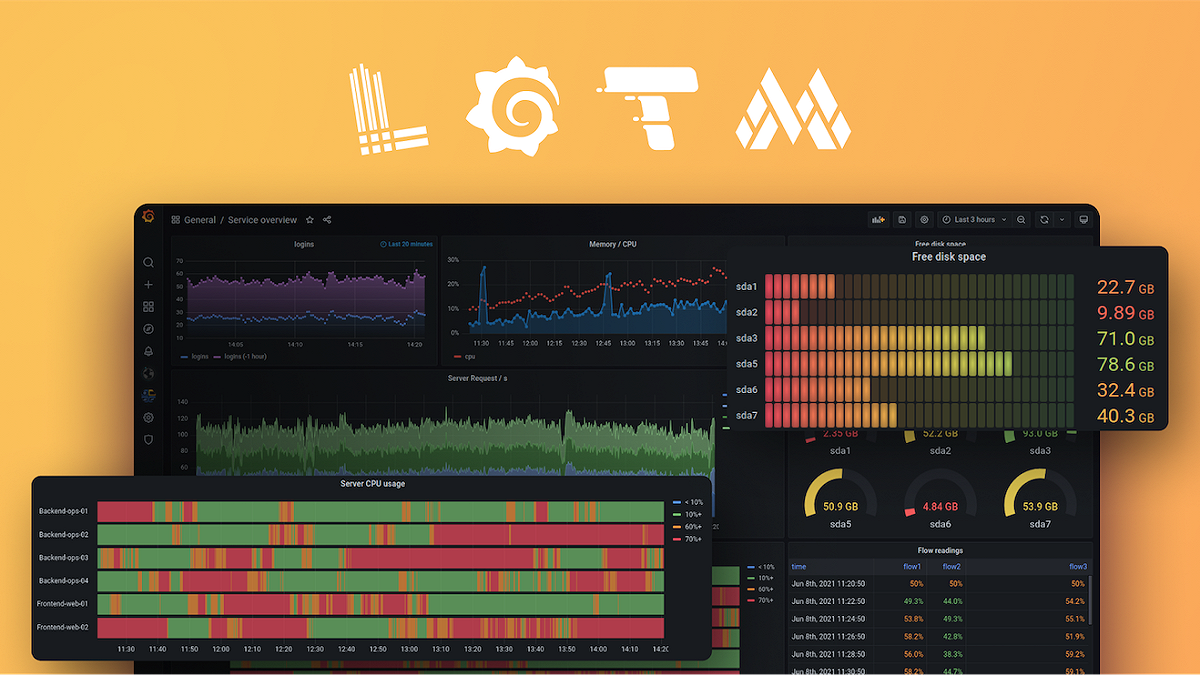
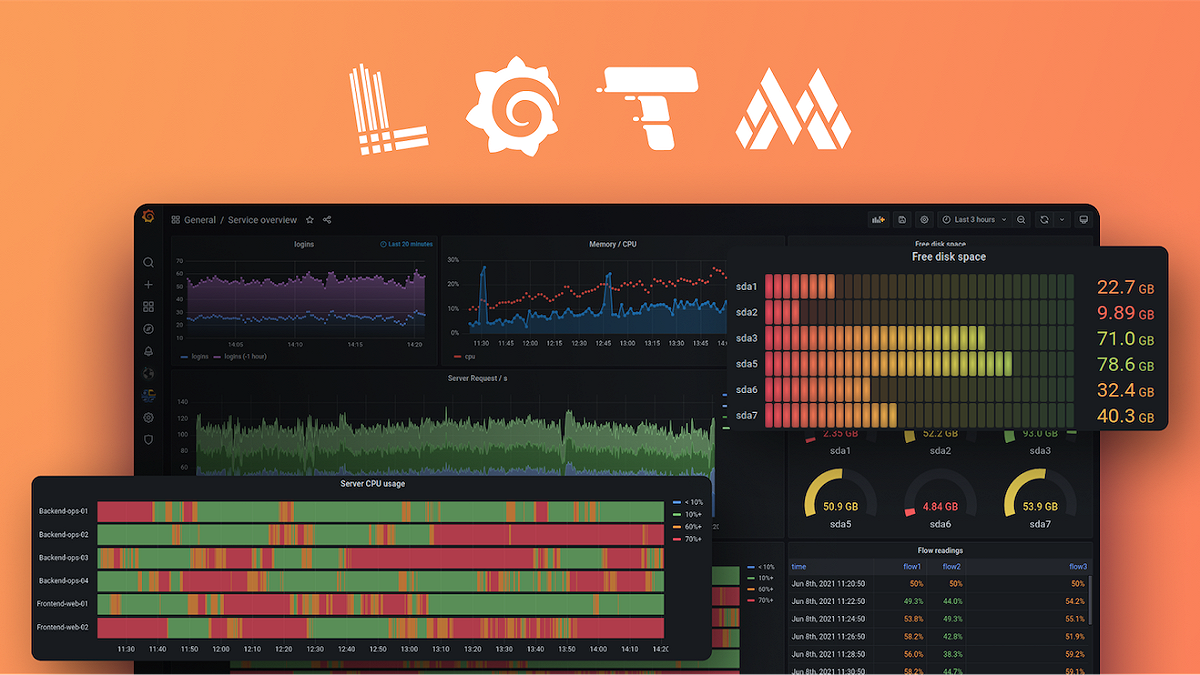
Getting started with the Grafana LGTM Stack
Register

28 Aug
Getting started with Grafana dashboard design
Register

4 Sep
Building advanced Grafana dashboards
Register
On-demand videos
Use the filters, or scroll to learn more about the LGTM Stack.
Upcoming live webinars
Real insights from real experts in real time.
All videos and webinars
Use the filters, or scroll to learn more about the LGTM Stack.
No results found. Please clear one or more filters.
Find A Video
Filter by