Play with Mimir
Play with Mimir
Grafana Mimir is a distributed, horizontally scalable, and highly available long term storage for Prometheus.
In this tutorial, you’ll:
- Run Grafana Mimir locally with Docker Compose
- Run Prometheus to scrape some metrics and remote write to Grafana Mimir
- Run Grafana to explore Grafana Mimir dashboards
- Configure a testing recording rule and alert in Grafana Mimir
Note
This tutorial runs Grafana Mimir using classic architecture. For more information about the supported architectures in Grafana Mimir, refer to Grafana Mimir architecture.
Prerequisites
- Git
- Docker and Docker Compose
- Availability of both ports
9000and9009on your host machine
Tip
Alternatively, you can try out this example in our interactive learning environment: Play with Mimir.
It’s a fully configured environment with all dependencies already installed.
Download tutorial configuration
- Create a copy of the Grafana Mimir repository using the Git command line:
git clone https://github.com/grafana/mimir.git cd mimir - Navigate to the tutorial directory:
cd docs/sources/mimir/get-started/play-with-grafana-mimir/
Note
The instructions in this tutorial assume that your working directory is
docs/sources/mimir/get-started/play-with-grafana-mimir/.
Start Grafana Mimir and dependencies
Start running your local setup with the following Docker command:
docker compose up -dThis command starts:
- Grafana Mimir
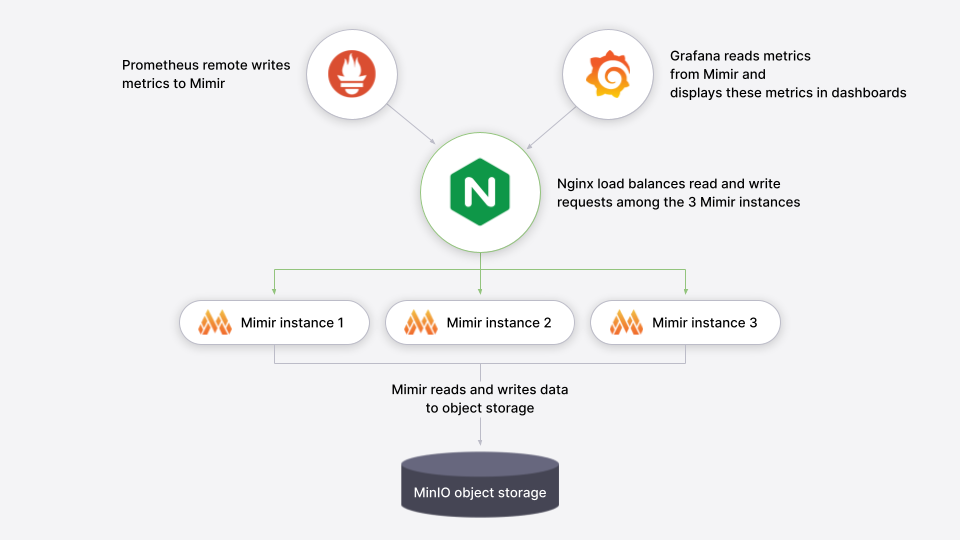
- Three instances of monolithic-mode Mimir to provide high availability
- Multi-tenancy enabled (tenant ID is
demo)
- Minio
- S3-compatible persistent storage for blocks, rules, and alerts
- Prometheus
- Scrapes Grafana Mimir metrics, then writes them back to Grafana Mimir to ensure availability of ingested metrics
- Grafana
- Includes a preinstalled datasource to query Grafana Mimir
- Includes preinstalled dashboards for monitoring Grafana Mimir
- Load balancer
- A simple NGINX-based load balancer that exposes Grafana Mimir endpoints on the host
The diagram below illustrates the relationship between these components:
The following ports will be exposed on the host:
- Grafana on
http://localhost:9000 - Grafana Mimir on
http://localhost:9009
To learn more about the Grafana Mimir configuration, you can review the configuration file config/mimir.yaml.
Explore Grafana Mimir dashboards
Open Grafana on your local host http://localhost:9000 and view dashboards showing the status
and health of your Grafana Mimir cluster. The dashboards query Grafana Mimir for the metrics they display.
To start, we recommend looking at these dashboards:
A couple of caveats:
- It typically takes a few minutes after Grafana Mimir starts to display meaningful metrics in the dashboards.
- Because this tutorial runs Grafana Mimir without any query-scheduler, or memcached, the related panels are expected to be empty.
The dashboards installed in the Grafana are taken from the Grafana Mimir mixin which packages up Grafana Labs’ best practice dashboards, recording rules, and alerts for monitoring Grafana Mimir. To learn more about the mixin, check out the Grafana Mimir mixin documentation. To learn more about how Grafana is connecting to Grafana Mimir, review the Mimir datasource.
Configure your first recording rule
Recording rules allow you to precompute frequently needed or computationally expensive expressions and save their result as a new set of time series. In this section you’re going to configure a recording rule in Grafana Mimir using tooling offered by Grafana.
- Open Grafana Alerting.
- Click New recording rule, which also allows you to configure recording rules.
- Configure the recording rule:
- Give the rule a name, such as
sum:up. - Choose Mimir in the Select data source field.
- Choose Code in the Builder | Code field on the right.
- Type
sum(up)in the Metrics browser query field. - Type
example-namespacein the Namespace field. - Type
example-groupin the Group field. - From the upper-right corner, click the Save and exit button.
- Give the rule a name, such as
Your sum:up recording rule will show the number of Mimir instances that are up, meaning reachable to be scraped. The
rule is now being created in Grafana Mimir ruler and will be soon available for querying:
- Open Grafana Explore
and query the resulting series from the recording rule, which may require up to one minute to display after configuration:
sum:up - Confirm the query returns a value of
3which is the number of Mimir instances currently running in your local setup.
Configure your first alert rule
Alerting rules allow you to define alert conditions based on PromQL expressions and to send notifications about firing alerts to Grafana Mimir Alertmanager. In this section you’re going to configure an alerting rule in Grafana Mimir using tooling offered by Grafana.
- Open Grafana Alerting.
- Click New alert rule.
- Configure the alert rule:
- Type
MimirNotRunningin the Rule name field. - Choose Mimir in the Select data source field.
- Type
count(up == 0)in the Metrics browser query field. This currently showsno datasince all instances are running.
- Type
- Scroll down to Set evaluation behavior:
- Select
New folderand typeexample-folderin the Folder name field. - Select
New evaluation groupand typeexample-groupin the Group name field. Set the evaluation interval to30s.
- Select
- Scroll down to Configure labels and notifications:
- Select the
Contract pointdropdown and choosegrafana-default-email.
- Select the
- Click the Save rule and exit button.
Your MimirNotRunning alert rule is now being created in Grafana Mimir ruler and is expected to fire when the number of
Grafana Mimir instances is less than three. You can check its status by opening the Grafana Alerting
page and expanding the “example-namespace > example-group” row. The status should be “Normal” since all three instances are currently running.
To see the alert firing we can introduce an outage in the Grafana Mimir cluster:
- Abruptly terminate one of the three Grafana Mimir instances:
docker compose kill mimir-3 - Open Grafana Alerting and check out the state of the alert
MimirNotRunning, which should switch to “Pending” state in about one minute and to “Firing” state after another minute. Note: since we abruptly terminated a Mimir instance, Grafana Alerting UI may temporarily show an error when querying rules: the error will auto resolve shortly, as soon as Grafana Mimir internal health checking detects the terminated instance as unhealthy.
Grafana Mimir Alertmanager has not been configured yet to notify alerts through a notification channel. To configure the Alertmanager you can open the Contact points page in Grafana and set your preferred notification channel. Note the email receiver doesn’t work in this example because there’s no SMTP server running.
Before adding back our terminated Mimir instance to resolve the alert, go into the Grafana Explore page and query your sum:up
recording rule. You should see that value of sum:up should have dropped to 2, now that one instance is down. You’ll also notice
that querying for this rule and all other metrics continues to work even though one instance is down. This demonstrates that highly
available Grafana Mimir setups like the three instance deployment in this demo are resilient to outages of individual nodes.
To resolve the alert and recover from the outage, restart the Grafana Mimir instance that was abruptly terminated:
- Start the Grafana Mimir instances:
docker-compose start mimir-3 - Open Grafana Alerting and check out the state of the alert
MimirNotRunning, which should switch to “Normal” state in about 30 seconds.
Summary
In this tutorial you started Grafana Mimir locally in a high-available setup as well as a Prometheus instance that remote wrote some metrics to Grafana Mimir. You then queried those metrics stored in Mimir using Grafana, and visualized them in some Grafana dashboards. Lastly, you configured a recording rule and an alert via the Grafana Alerting UI and verified that the alert fired as expected when the condition was met.
Once you’ve completed the tutorial, release all Docker resources by running this Docker command:
docker-compose down -v