Grafana security release: New Grafana versions with security fixes for CVE-2023-2183 and...
Read more
Open Source
Community resources
Dashboard templates
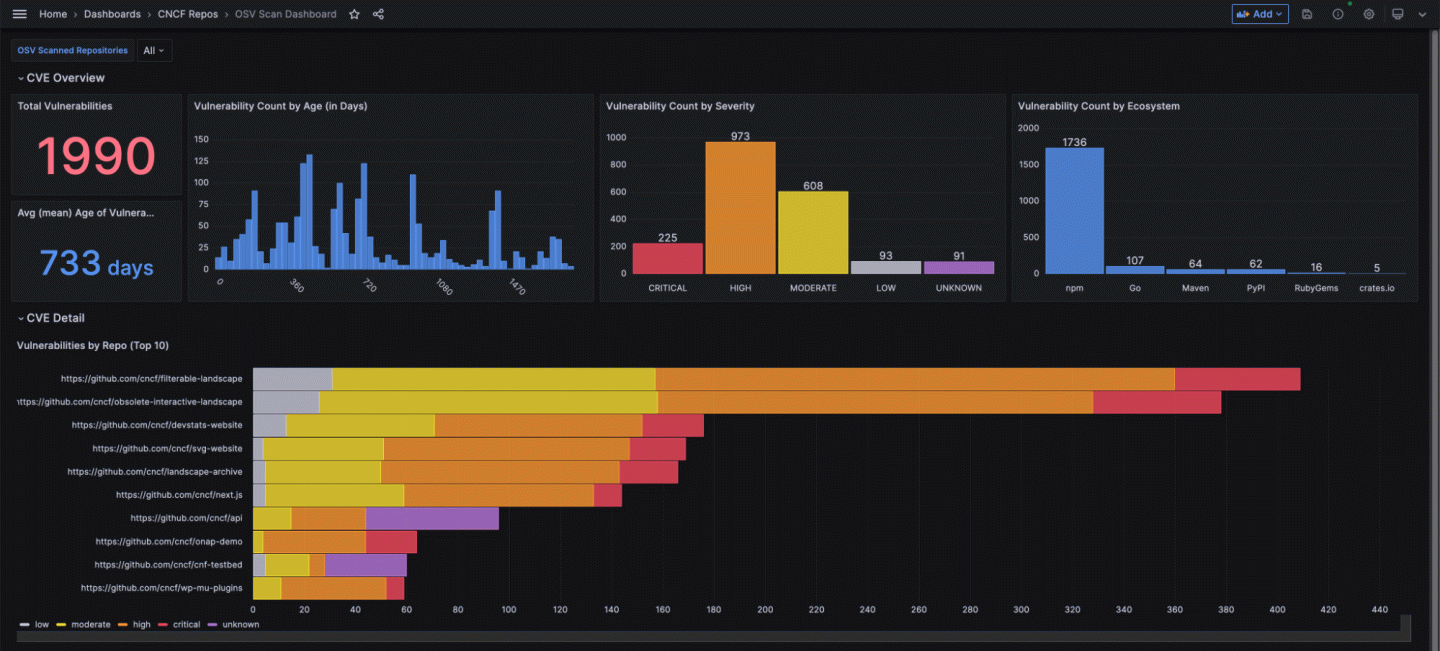
Try out and share prebuilt visualizations
Prometheus exporters
Get your metrics into Prometheus quickly
end-to-end solutions
Opinionated solutions that help you get there easier and faster
monitor infrastructure
Out-of-the-box KPIs, dashboards, and alerts for observability
visualize any data
Instantly connect all your data sources to Grafana
Docs
Get started
Get started with Grafana
Build your first dashboard
Get started with Grafana Cloud
What's new / Release notes
Opinionated solutions that help you get there easier and faster
Instantly connect all your data sources to Grafana
Getting started with the Grafana LGTM Stack
We’ll demo how to get started using the LGTM Stack: Loki for logs, Grafana for visualization, Tempo for traces, and Mimir for metrics.
I am Grot. Ask me anything
Write a short description about your experience with Grot, our AI Beta.
Rate your experience (required)
Read more
Read more
Read more
Read more
Today we are releasing Grafana 9.4.7, 9.3.11, 9.2.15, and 8.5.22, which include security fixes. If you are affected, we recommend that you install...
Read more
Read more
Read more
As a precautionary measure resulting from the recent CircleCI security alert, we are rotating some Grafana GPG keys.
Read more
Read more
Read more
Read more
Read more
Read more
Read more
Read more