

You should know about... these useful Prometheus alerting rules

Intro to exemplars, which enable Grafana Tempo’s distributed tracing at massive scale

How we're graduating Grafana Agent experiments into the official Prometheus project

How we responded to a 2-hour outage in our Grafana Cloud Hosted Prometheus service

2021: The year of Cortex for IoT?

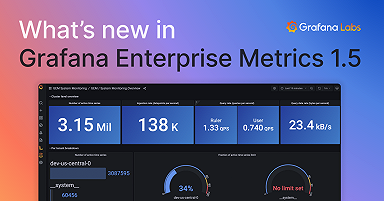
What’s new in Grafana Enterprise Metrics for scaling Prometheus: enhanced access control and a...

The basics of IoT, and why Prometheus works so well with it

Don't miss our new series of live demo webinars kicking off March 4: Getting started with Grafana...

The 3 major benefits that Grafana Cloud customers get from our hosted Prometheus service

How I monitor my OpenWrt router with Grafana Cloud and Prometheus

How the FourthDown NFL play-by-play API measures its performance with Prometheus, Jaeger, and...

Grafana 7.4 released: Next-generation graph panel with 30 fps live streaming, Prometheus exemplar...

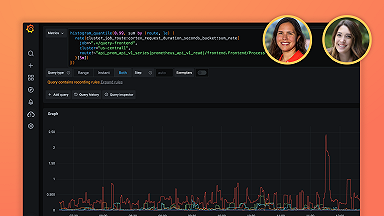
Basics and best practices for getting started with PromQL