
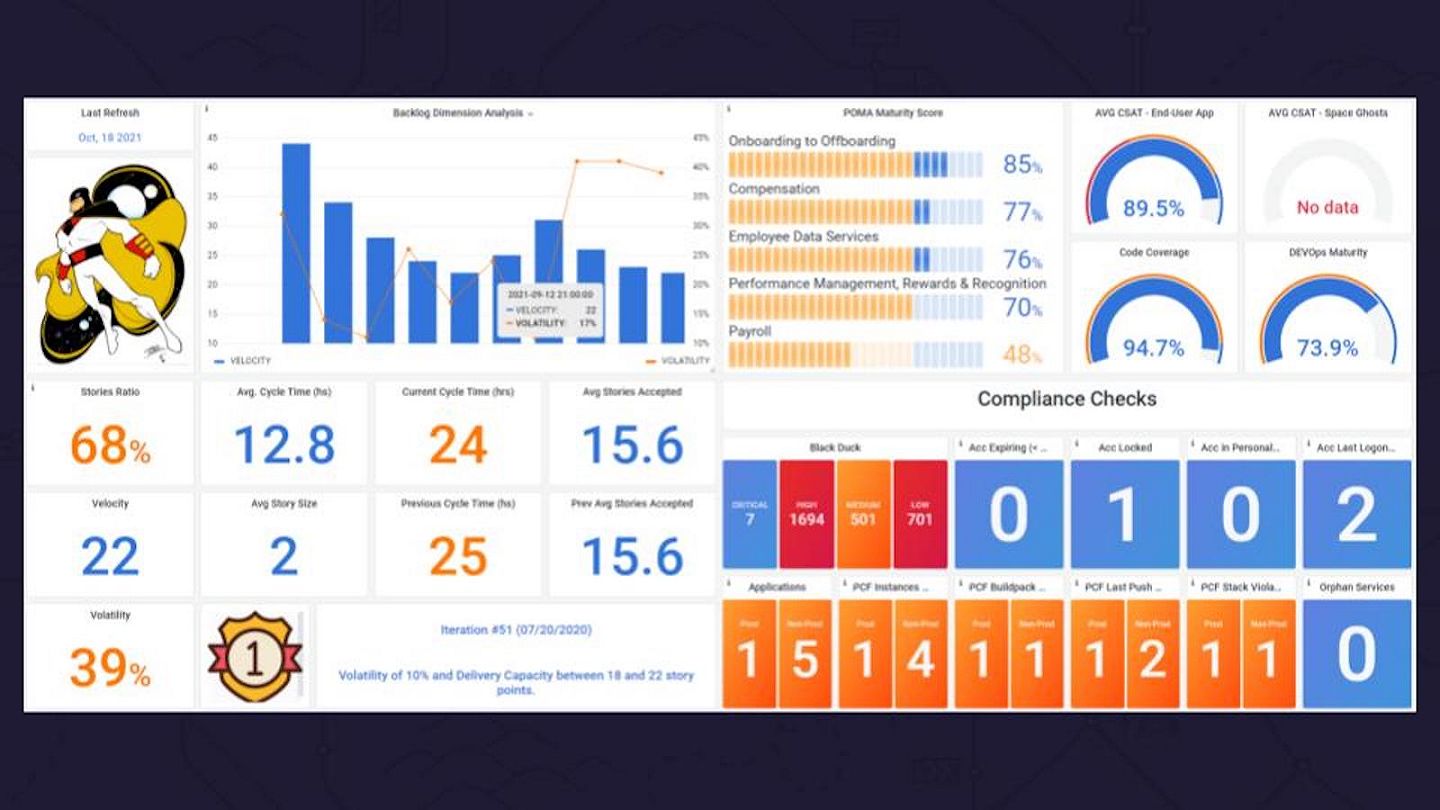
How product teams can manage their performance using Grafana, Prometheus, and Oracle metrics
Learn how observability helped one company develop a data-driven mindset that saved time and increased efficiency.
Read more
Open Source
Community resources
Dashboard templates
Try out and share prebuilt visualizations
Prometheus exporters
Get your metrics into Prometheus quickly
end-to-end solutions
Opinionated solutions that help you get there easier and faster
monitor infrastructure
Out-of-the-box KPIs, dashboards, and alerts for observability
visualize any data
Instantly connect all your data sources to Grafana
Docs
Get started
Get started with Grafana
Build your first dashboard
Get started with Grafana Cloud
What's new / Release notes
Opinionated solutions that help you get there easier and faster
Instantly connect all your data sources to Grafana
Getting started with the Grafana LGTM Stack
We’ll demo how to get started using the LGTM Stack: Loki for logs, Grafana for visualization, Tempo for traces, and Mimir for metrics.
I am Grot. Ask me anything
Write a short description about your experience with Grot, our AI Beta.
Rate your experience (required)
Learn how observability helped one company develop a data-driven mindset that saved time and increased efficiency.
Read more
Grafana Labs brought together the EMEA community to discuss observability, monitoring, and load testing.
Read more
Learn how Ocrolus, a fintech automation platform, used existing industry tooling and knowledge to capture meaningful data from its nearly 1,000...
Read more
Read more
How we can use experimental observations and developer narratives as effective storytelling techniques to produce a prediction.
Read more
With browser automation and expanded Prometheus support, k6 improves application performance and observability.
Read more
The Prometheus Agent mode from the Grafana Agent enables easier horizontal scalability.
Read more
New Grafana Labs webinars cover scaling metrics, reducing MTTR, and putting a price tag on your observability strategy.
Read more
Early findings from a prototype show that sparse histograms can reduce index size and result in more efficient coding in Prometheus TSDB.
Read more
Grafana's ObservabilityCON 2021 will feature new talks from TomTom, Unity, TripAdvisor, Snyk, Citibank, and Ocrolus.
Read more
The Prometheus Conformance Program helps determine what software and services are compatible with Prometheus
Read more
Read more
Read more
Read more
Read more


