How many metrics? A guide to estimating the size of your system in Grafana Cloud
Read more
Open Source
Community resources
Dashboard templates
Try out and share prebuilt visualizations
Prometheus exporters
Get your metrics into Prometheus quickly
end-to-end solutions
Opinionated solutions that help you get there easier and faster
monitor infrastructure
Out-of-the-box KPIs, dashboards, and alerts for observability
visualize any data
Instantly connect all your data sources to Grafana
Docs
Get started
Get started with Grafana
Build your first dashboard
Get started with Grafana Cloud
What's new / Release notes
Opinionated solutions that help you get there easier and faster
Instantly connect all your data sources to Grafana
Getting started with the Grafana LGTM Stack
We’ll demo how to get started using the LGTM Stack: Loki for logs, Grafana for visualization, Tempo for traces, and Mimir for metrics.
I am Grot. Ask me anything
Write a short description about your experience with Grot, our AI Beta.
Rate your experience (required)
Read more
Read more
Read more
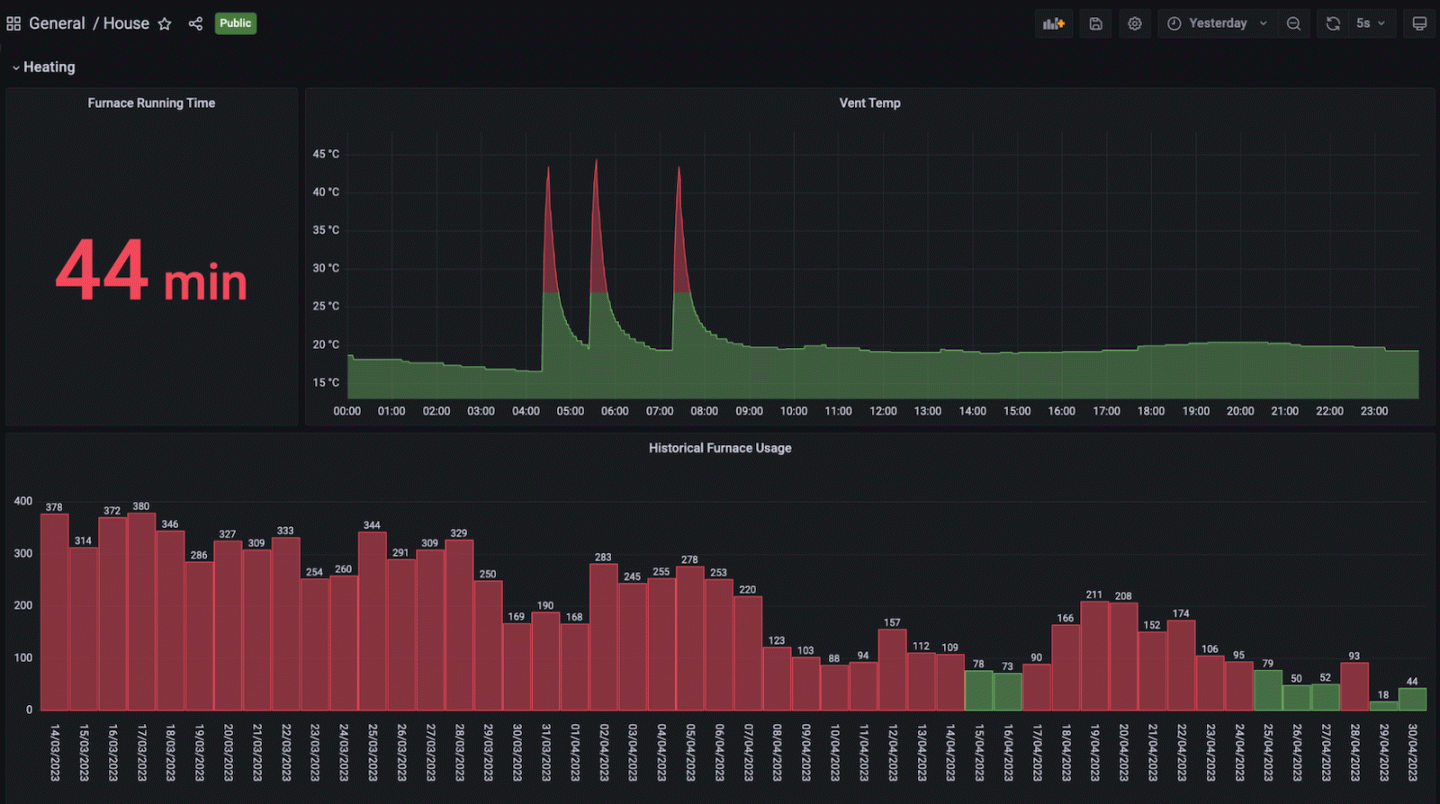
Visualizing xDSL metrics on a Grafana dashboard makes it easy to figure out the cause of short-term internet outages.
Read more
Read more
Read more
Read more
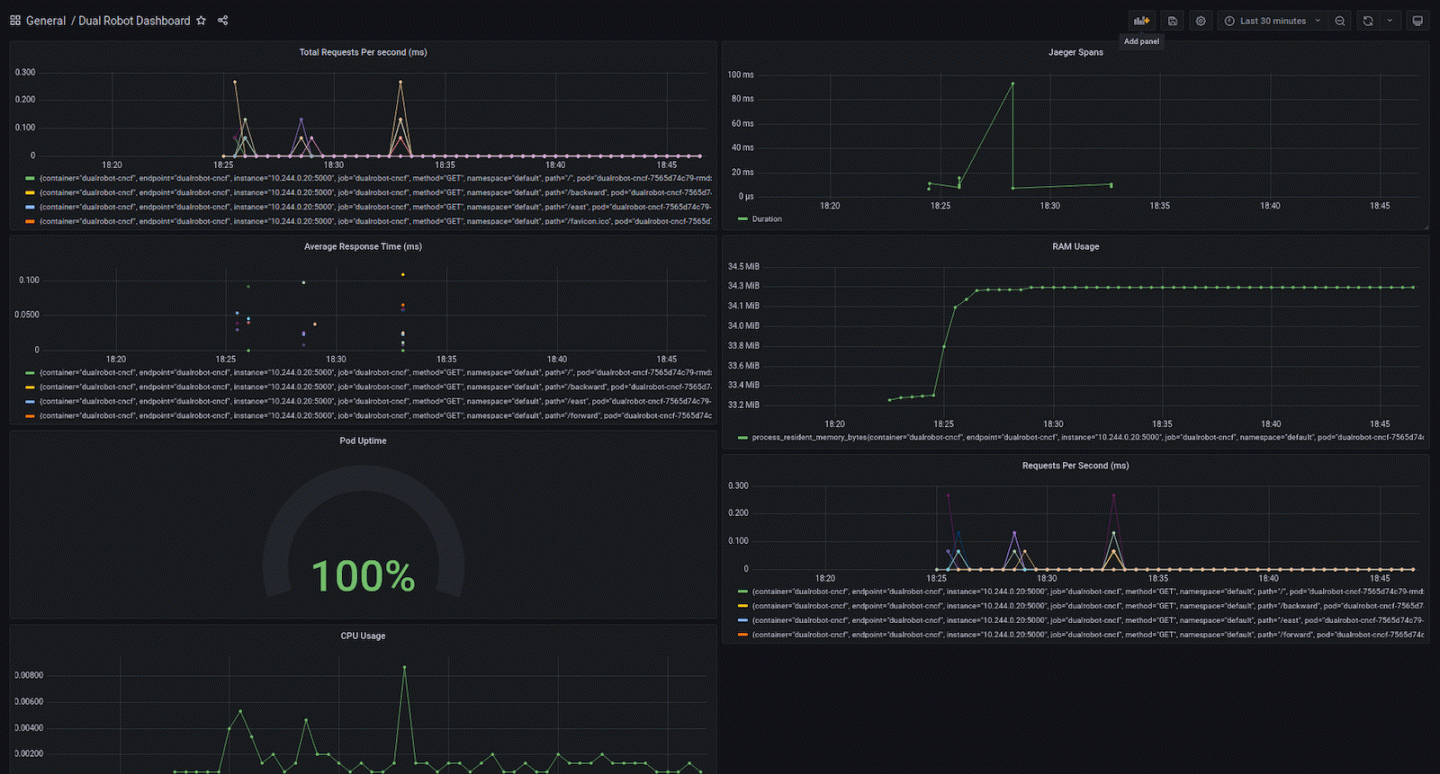
Check out what Grafana Labs is up to at KubeCon + CloudNativeCon. Find our booth and check out our sessions on Jaeger, Prometheus, SLOs, and SneakOps.
Read more
Read more
Read more
Read more
Read more
Read more
Read more
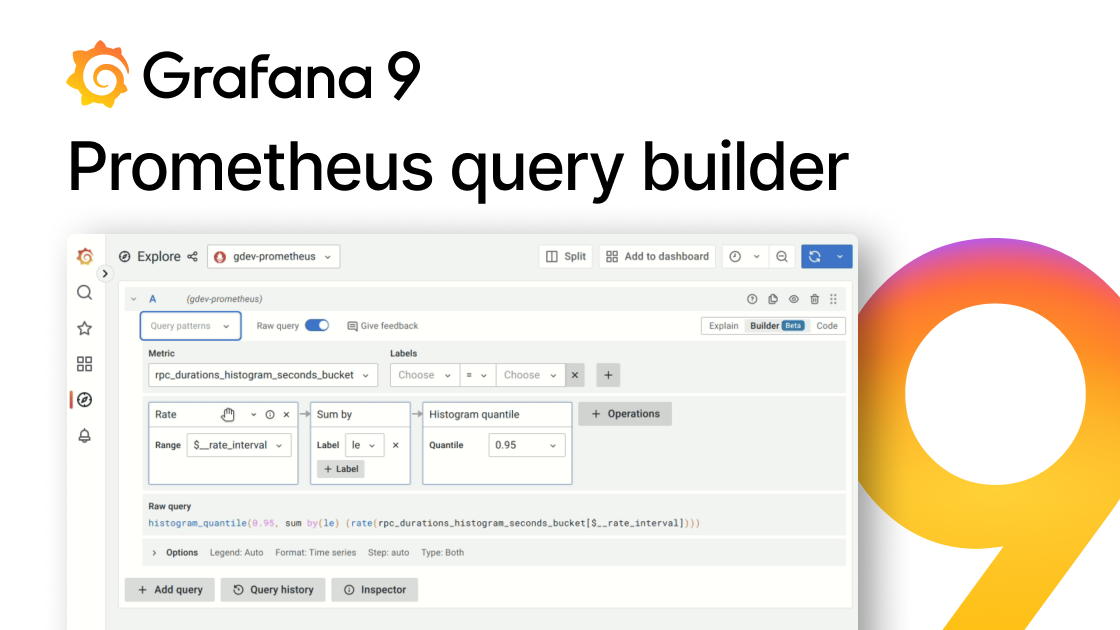
How to scrape Prometheus metrics with the OpenTelemetry Collector and send them to a remote write destination like Grafana Cloud.
Read more