Join our sessions on Prometheus and Cortex at PromCon Online
Read more
Products
LGTM+ Stack
Key Capabilities
Observability Solutions
Open Source
Community resources
Dashboard templates
Try out and share prebuilt visualizations
Prometheus exporters
Get your metrics into Prometheus quickly
end-to-end solutions
Opinionated solutions that help you get there easier and faster
monitor infrastructure
Out-of-the-box KPIs, dashboards, and alerts for observability
visualize any data
Instantly connect all your data sources to Grafana
Learn
Stay up to date
Technical learning
Docs
Get started
Get started with Grafana
Build your first dashboard
Get started with Grafana Cloud
What's new / Release notes
Company
Help build the future of open source observability software Open positions
Check out the open source projects we support Downloads
end-to-end solutions
Opinionated solutions that help you get there easier and faster
visualize any data
Instantly connect all your data sources to Grafana
Julie Dam · 14 Jul 2020 · 2 min read
Read more
Éamon Ryan · 2 Jul 2020 · 8 min read
Read more
Julie Dam · 26 Jun 2020 · 2 min read
Read more
Emil Tullstedt · 23 Jun 2020 · 9 min read
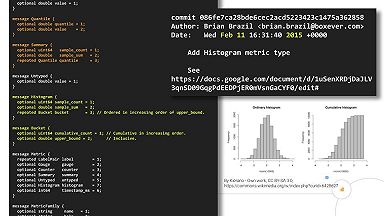
Learn how to turn a Prometheus histogram into a stat panel, bar gauge, or heat map in Grafana.
Read more
Josue Abreu · 15 Jun 2020 · 2 min read
Read more
Ganesh Vernekar · 10 Jun 2020 · 3 min read
Read more
Tom Wilkie · 21 May 2020 · 3 min read
Read more
Björn “Beorn” Rabenstein · 5 May 2020 · 5 min read
Read more
Julie Dam · 1 May 2020 · 2 min read
Read more
Ganesh Vernekar · 29 Apr 2020 · 2 min read
Read more
Cyril Tovena · 15 Apr 2020 · 2 min read
Read more
Björn “Beorn” Rabenstein · 14 Apr 2020 · 3 min read
Read more
Eldin Nikocevic · 8 Apr 2020 · 4 min read
Read more
Tom Wilkie · 7 Apr 2020 · 4 min read
Read more
Julie Dam · 3 Apr 2020 · 3 min read
Read more