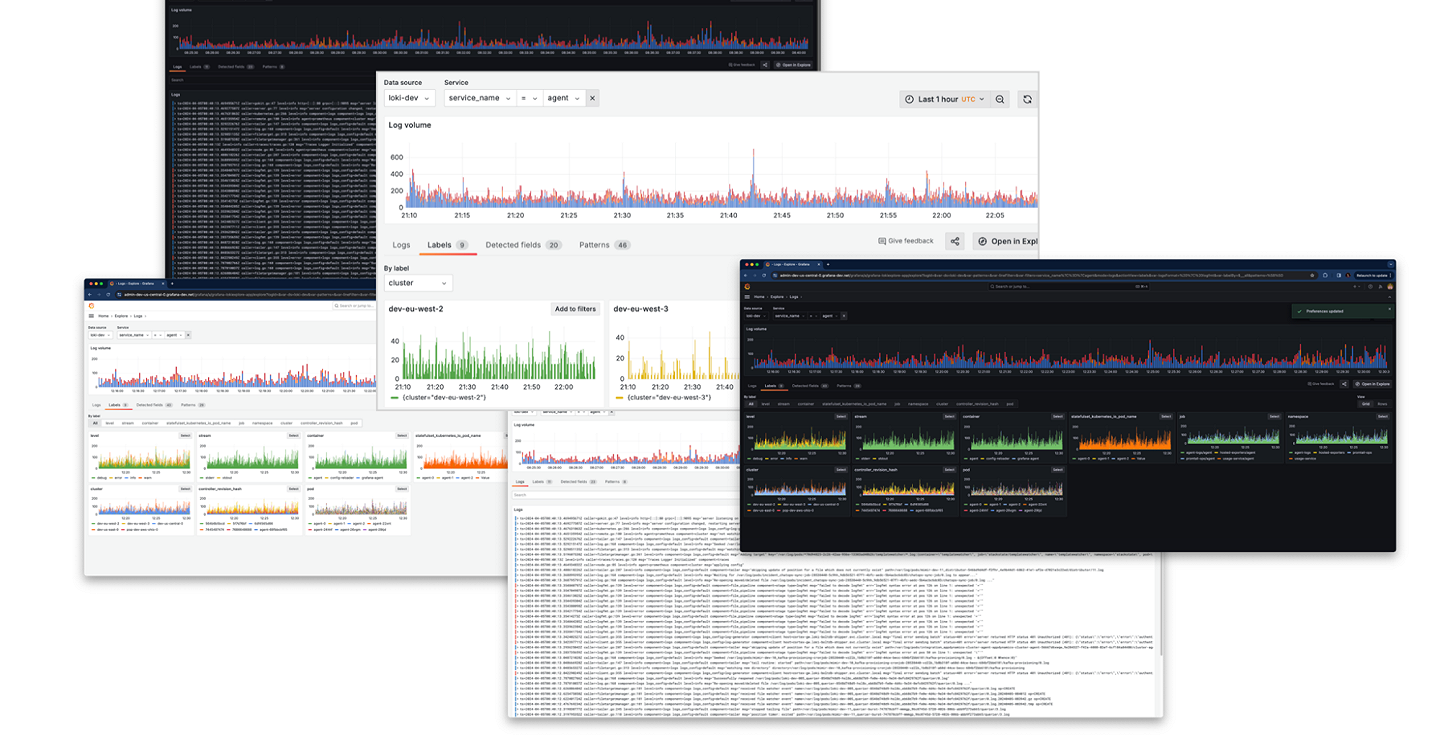
Get insights from logs without writing a query: Explore Logs is in Public Preview
See how we're improving Explore Logs, an interface for quickly extracting insights from logs without needing to run a query, so you can identify...
Read more
Open Source
Community resources
Dashboard templates
Try out and share prebuilt visualizations
Prometheus exporters
Get your metrics into Prometheus quickly
end-to-end solutions
Opinionated solutions that help you get there easier and faster
monitor infrastructure
Out-of-the-box KPIs, dashboards, and alerts for observability
visualize any data
Instantly connect all your data sources to Grafana
Docs
Get started
Get started with Grafana
Build your first dashboard
Get started with Grafana Cloud
What's new / Release notes
Opinionated solutions that help you get there easier and faster
Instantly connect all your data sources to Grafana
Getting started with the Grafana LGTM Stack
We’ll demo how to get started using the LGTM Stack: Loki for logs, Grafana for visualization, Tempo for traces, and Mimir for metrics.
I am Grot. Ask me anything
Write a short description about your experience with Grot, our AI Beta.
Rate your experience (required)
See how we're improving Explore Logs, an interface for quickly extracting insights from logs without needing to run a query, so you can identify...
Read more
Join us on this journey to uncover the secrets of bird song and the power of observability, using open source tools like BirdNET, Prometheus, Grafana...
Read more
There are lots of ways to deploy Grafana Loki, but the Grafana Ansible collection might be the right choice if you're just starting out. Find out how...
Read more
We discovered the Grafana Loki Helm chart had a default configuration that could potentially lead to unintended requests to third-party Amazon S3...
Read more
See how the Department of Defense is prioritizing open source as part of a broader push to modernize its software development, and how Grafana can...
Read more
Learn how we're using Bloom filters in Grafana Loki to improve users' experience with faster-returning filter queries, while still keeping Loki easy...
Read more
Learn all about Explore Logs, a new way to browse your logs in Grafana 11 and Loki 3.0 without writing LogQL.
Read more
Learn about all the latest features in Grafana Loki 3.0.
Read more
See how TeleTracking combined Prometheus and Grafana Cloud to give its users greater visibility into their services, lower overhead, and serve as key...
Read more
Learn how out-of-order ingestion works in Grafana Loki so you know what to expect when you need the log aggregation system to ingest older logs.
Read more
Learn how Grafana Loki executes queries and read about best practices and techniques that can improve your query performance.
Read more
In Part 2 of "The concise guide to Loki," you'll learn about how to properly use labels in our favorite logging database.
Read more
A concise guide to Grafana Loki, our open source log aggregation tool, highlighting its features and benefits for users.
Read more
Debating between OSS vs. a full-managed solution for logging? Here's why observability pros ultimately decided on Grafana Cloud
Read more
An inside look at how the Grafana Loki team used Grafana Cloud Profiles to improve code performance by more than 30% for a new feature.
Read more