
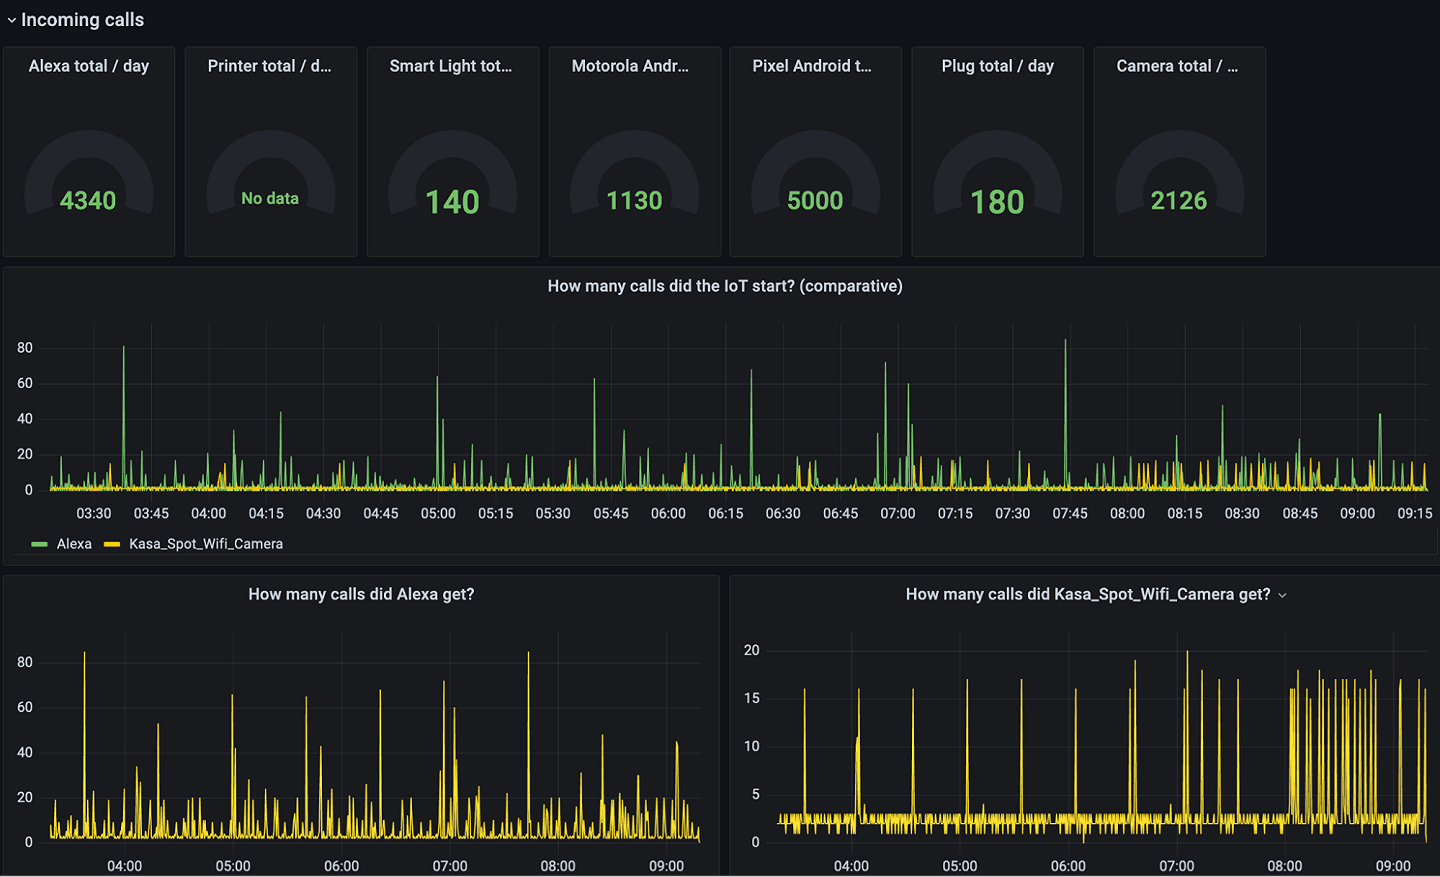
Visualizing IoT security metrics with Grafana at Network to Code
How Network to Code uses Grafana to visualize and predict the probability of a security breach in IoT devices.
Read more
Open Source
Community resources
Dashboard templates
Try out and share prebuilt visualizations
Prometheus exporters
Get your metrics into Prometheus quickly
end-to-end solutions
Opinionated solutions that help you get there easier and faster
monitor infrastructure
Out-of-the-box KPIs, dashboards, and alerts for observability
visualize any data
Instantly connect all your data sources to Grafana
Docs
Get started
Get started with Grafana
Build your first dashboard
Get started with Grafana Cloud
What's new / Release notes
Opinionated solutions that help you get there easier and faster
Instantly connect all your data sources to Grafana
Getting started with the Grafana LGTM Stack
We’ll demo how to get started using the LGTM Stack: Loki for logs, Grafana for visualization, Tempo for traces, and Mimir for metrics.
I am Grot. Ask me anything
Write a short description about your experience with Grot, our AI Beta.
Rate your experience (required)
How Network to Code uses Grafana to visualize and predict the probability of a security breach in IoT devices.
Read more
Read more
Read more
Learn how CSS Electronics' CANedge equipment records data from vehicles and machinery and integrates with Grafana dashboards.
Read more
Read more
Grafana Virtual Meetup Recap: IoT monitoring setup, SLO tips, and a guide to Grafana's wide time series format.
Read more
How to stream real-time metrics from Telegraf to Grafana over HTTP Post using Grafana Live.
Read more
This simple demo showcases how powerful the new streaming API is when it comes to visualizing real-time data with a datasource plugin using Grafana...
Read more
Read more
Read more
Read more
Read more
Read more
Read more
Read more


