How sparse histograms can improve efficiency, precision, and mergeability in Prometheus TSDB
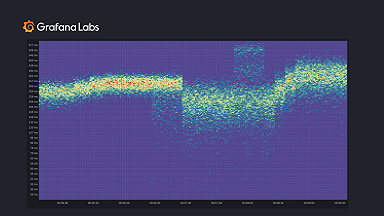
Early findings from a prototype show that sparse histograms can reduce index size and result in more efficient coding in Prometheus TSDB.
Read more
I am Grot. Ask me anything
Write a short description about your experience with Grot, our AI Beta.
Rate your experience (required)
Early findings from a prototype show that sparse histograms can reduce index size and result in more efficient coding in Prometheus TSDB.
Read more
All the latest Grafana Cloud features that help users customize their data and dashboards.
Read more
Read more
The latest feature in Cortex delivers better load balancing and improved isolation for Prometheus — without increasing the cost of running a cluster.
Read more
Read more
Grafana Labs at PromCon 2021 preview: Prometheus remote write, Cortex blocks storage, histograms, and more
Read more
Read more
Read more
Read more
Read more
Read more
Read more
Read more
At KubeCon + CloudNativeCon North America (Virtual) next week, Grafana Labs team members will be joining the thousands of people gathered for CNCF's...
Read more
On Day 2 of ObservabilityCON 2020, Grafana Labs focused on Prometheus's evolution and adoption as well as highlighted the importance of continuous...
Read more
