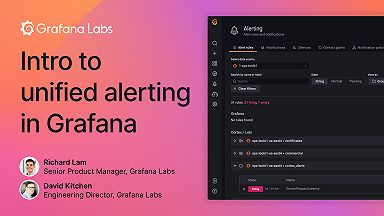
Learn more about the new alerting system in Grafana in this week's webinar
Read more
I am Grot. Ask me anything
Write a short description about your experience with Grot, our AI Beta.
Rate your experience (required)
Read more
Read more
Read more
Day 5 at GrafanaCONline delivered in-depth demos on Grafana's new unified alerting system and how to use dashboards as code. Plus see how Grafana...
Read more
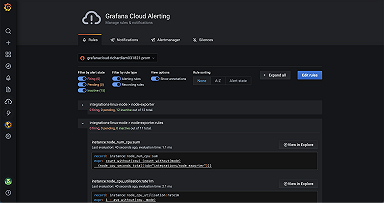
Grafana Alerting has been updated with the release of Grafana 9. To learn all about the new and improved alerting experience, check out our Grafana...
Read more
Read more
Read more
Read more
Read more
Read more
How to get started with Prometheus Alertmanager and set up alert notifications with popular methods and apps.
Read more
