Grafana Alerting: Save time and effort with Grafana-managed recording rules
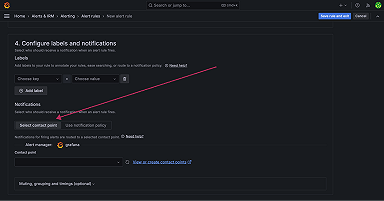
In Grafana Alerting, Grafana-managed recording rules can save you time and effort in setting up and managing your incident response.
Read more
In Grafana Alerting, Grafana-managed recording rules can save you time and effort in setting up and managing your incident response.
Read more
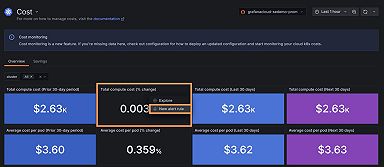
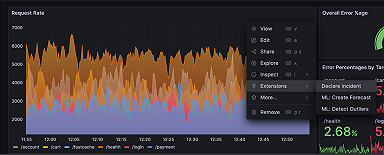
You can now set up alerts directly from certain types of panels within the Kubernetes Monitoring app, making incident management smoother than ever.
Read more
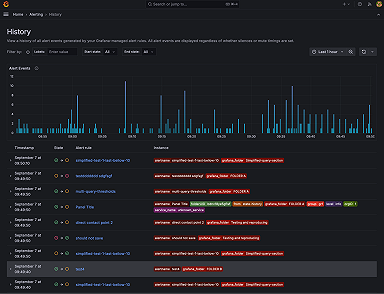
Get a clear, comprehensive view of alert state transitions over time to help identify patterns, diagnose issues quicker, and improve your overall...
Read more
Grafana 11.1 delivers a sought-after visualization feature (hint: text in table panels will be easier to read!), Grafana Alerting improvements, and...
Read more
Improve your incident response with the latest updates to Grafana Alerting, including simplified routing, performance improvements, consolidated...
Read more
Legacy alerting will be removed from Grafana on May 14. Learn how to easily upgrade to Grafana Alerting before it's too late
Read more
Simplified routing is a powerful, yet easy-to-use, new feature in Grafana Alerting that dynamically routes alerts and enforces RBAC.
Read more
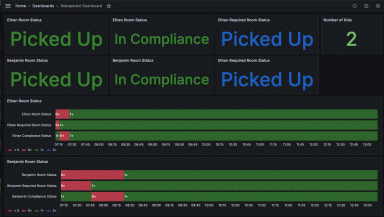
Motivating kids to clean their rooms — and keeping tabs on their progress — can be a challenge. Here’s how to make things a little easier with Grafana...
Read more
Learn about workflow changes we've made to our on-call management tool to reduce redundancies and context switching so you can identify and respond to...
Read more
The Grafana 10.4 release includes visualization updates, a new plugin, and a preview of functionality we intend to make generally available in Grafana...
Read more
With a free Grafana Cloud account and a VPN service, you can ensure your network is secure by receiving real time alerts.
Read more
Whether you're a new user or you manage fleets of containers, troubleshooting issues is easier with the updated alerting experience in Kubernetes...
Read more
Grafana 10.3 introduces new visualization features, multi-stack data source queries, and improvements to help manage your Grafana instance.
Read more
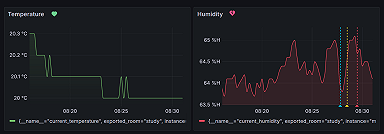
Follow this step-by-step guide to set up notifications in Grafana to monitor temperature and humidity sensor data.
Read more
From creating a contact point to configuring notification policies, learn how to integrate Grafana Alerting and Telegram to receive alerts on the...
Read more
