
 Watching Sweden's public services
Watching Sweden’s public services from the outside in: how one engineer built a national monitoring network on Grafana Cloud
Martin is an engineer with twelve years of experience in monitoring and observability. In his own time, he built Iris, a distributed network of probes that watches Swedish critical public services from the outside in, on Grafana Cloud. He reviews the metrics weekly, and when a company reports an outage, he compares his data to their statement and against Downdetector, and more often than not, his data got there first.
“I would say Grafana is saving roughly 80% of wasted time looking at issues,” he said. “I can pinpoint them much more quickly with Grafana, especially with the new AI assistant.”
The challenge
Martin had spent years monitoring the way many engineers do: check-based, binary health checks scattered across machines, logs read over individual SSH sessions, and a browser full of tabs for different status pages. Nothing was in one place, and answering a simple question (Is this actually up, and if not, where’s the problem?) meant stitching together evidence by hand.
“My previous tooling would have been looking at logs directly on the servers and inspecting metrics locally, which is a huge time sink,” he says.
Martin had a bigger question in mind, too. Under NIS2, operators of critical services report incidents to national authorities—but nothing flows back to the public, and there is no independent, central view of how these services actually perform day to day. Martin wanted to measure it from the outside, the way the public experiences it, and give both regulators and citizens a reference point that doesn’t exist today.
The solution
With no observability backend to build or operate, Grafana Cloud saved Martin. He started on the free tier, where Iris sends metrics and logs.
Iris is custom software that ships its results through OpenTelemetry. A master node holds every target and its configuration, and a sync service keeps each probe’s local database aligned with the master so metrics from every location reconcile. Each probe embeds an OpenTelemetry Collector that forwards to a central Collector, which transforms the data before it reaches Grafana Cloud.
His custom software is essentially a Blackbox Exporter running on his probes, built to his liking. What changed was the pipeline and the backend, not the check mechanism. The problem he was actually solving was fragmentation: results scattered across machines with no common place to correlate them.
He has also established SLOs that work on an error budget to keep the system alive and trustworthy.
AI became part of the workflow, too. “With large language models and the Grafana MCP server, I can just ask about the logs in natural language, instead of having to sift through them myself,” Martin says.
And Grafana Assistant, the purpose-built LLM in Grafana Cloud, helped him move faster still. It’s how he built and now operates the whole system largely on his own.
The result
The payoff Martin is proudest of is early warning: he has detected outages in public services before the public noticed, and before the affected companies made any statement. Because every signal lands in one place, he can pinpoint whether a problem sits with a specific service, an internet service provider, or a hosting company—fast.
The day-to-day difference is time. “Grafana saves me roughly 80% of the wasted time I used to spend looking at issues,” he says. “I can pinpoint them much more quickly, especially with the new AI assistant.”
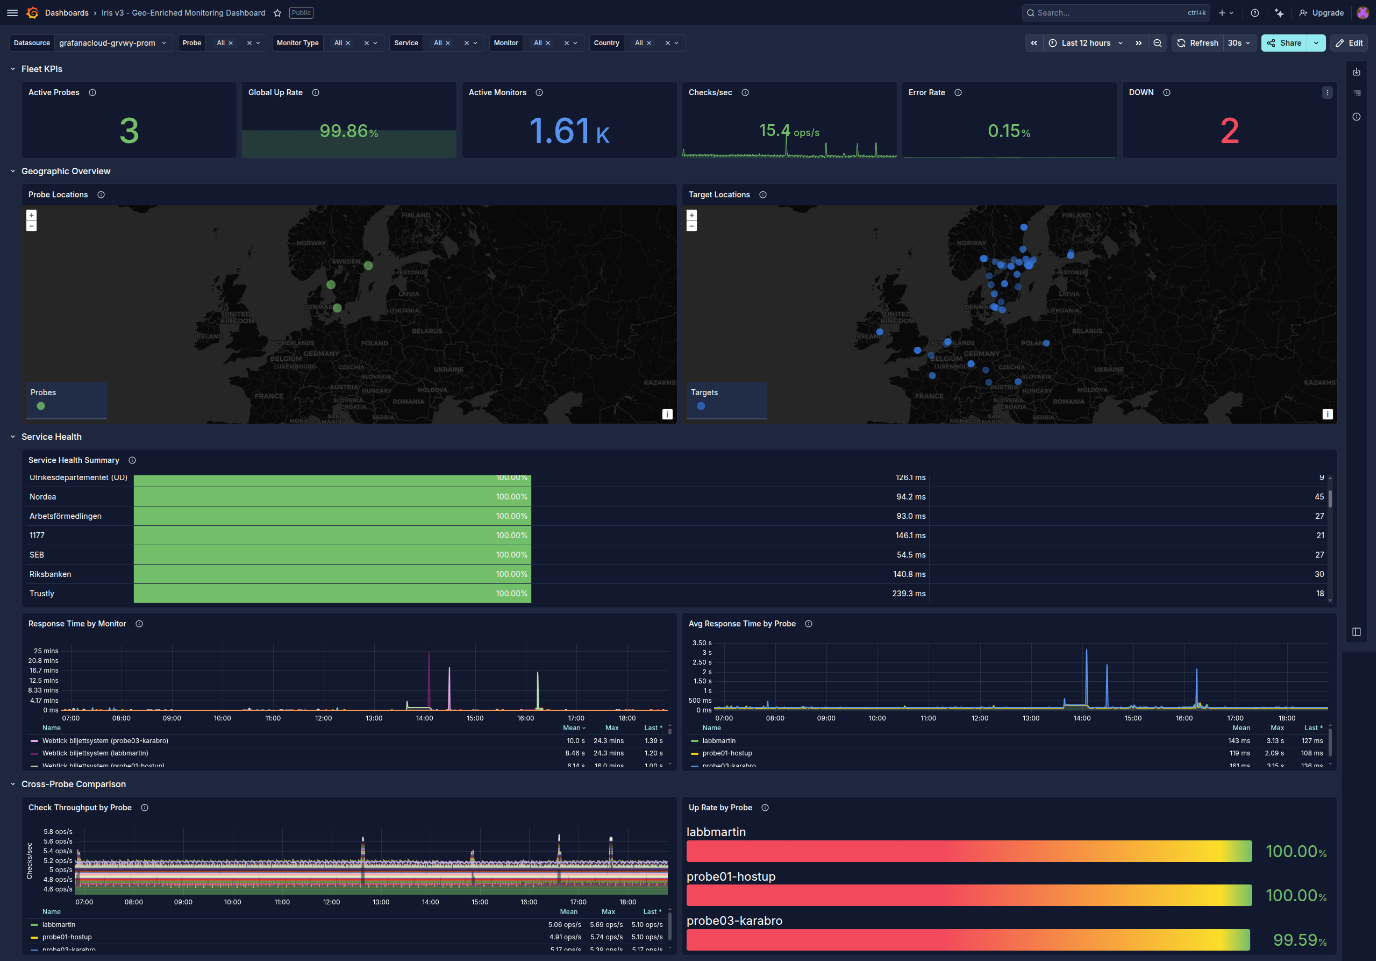
And there’s a quieter result, too. He’s managed to build an entire distributed system, by himself, with visibility he needs in a single view.
“I built my entire system myself with the help of large language models, and I can actually see it working—everything in one dashboard,” Martin says. “Whenever I look at my dashboards, I feel happy inside.”
Martin built Iris on Grafana Cloud’s free tier. You can start the same way: Create a free account and send your first metrics in minutes.