
How Sitech integrates Grafana Cloud as part of their industrial IoT monitoring SaaS product
Geleen, in the Southern part of the Netherlands, is home to Chemelot, an industrial park with more than 150 companies in chemical and process industries who are working to build the most sustainable and competitive chemical site in Western Europe.
Sitech Services is part of making that happen. The Dutch technology firm was created in 2008 out of several departments from the science-based company Royal DSM and provides on-site services for Chemelot as an independent entity. Still a go-to resource in the Chemelot community, Sitech brings together maintenance and engineering specialists with data scientists to create multidisciplinary solutions that achieve optimal safety, efficient infrastructure, and efficient processes for the plants.
“On a daily base we see where we can improve the condition-based monitoring for our customers, and do so from a perspective where we also see how it can be done differently in the future,” says Rowen Forman, Data and Business Analyst for the Asset Health Center at Sitech. “Is there anything in the field of data science that can add to the picture? Or in the field of human computer interaction?”
The Sitech Asset Health Center bridges the gap between engineers and data scientists within this domain. The team develops communication strategies and applications based on the latest developments in the chemical process community, and they apply these to enhance the capabilities of their customers.
“My domain is how to present information that is extracted from the data to our customers or our users,” says Forman. “I bring all the information together to make sure that the message that we create by analyzing this data is understood, used, and appreciated.”
And there’s only one tool that his team uses to unify all of their information into clear and impactful dashboards for their clients: Grafana.
It’s always been possible to do a retroactive investigation, but the way that Grafana is set up, it allows us to monitor at a scale where we can see everything, all the time.
Rowen Forman, Data and Business Analyst, Sitech Services
Old tech, new solutions
Sitech customers tend to have the same challenge: The equipment within the industry is designed for long-term durability, which often means the technology and the operating processes for the machinery become dated over time.
“The plants on Chemelot are more than 40 years old with technology and measurement devices that date back to that time as well,” says Peter Bosmans, Technology Manager at Sitech who serves as the liaison between the customers and Sitech’s engineers.
With the introduction of Industry 4.0 and the ongoing efforts to automate traditional manufacturing and industrial practices, more chemical and processing companies have adopted 5G networks and leveraged the internet of things and machine learning to promote interconnectivity, information transparency, and self-service monitoring within their systems.
To ensure these companies are evolving efficiently and to help them scale up, Sitech brings in the expertise of more than 250 engineers who specialize in rotating, static, civil, electrical, instrumentation, and data engineering and combines their experience with the knowledge from data science experts to give a holistic analysis of their customers’ business and operations.
Overall, “we make an assessment of the plant: What is critical equipment and what’s not?” says Bosmans. “On that critical equipment, we apply preventive, predictive, and prescriptive maintenance to assure that there’s no risk of failure and loss or that any risk is under control for our clients. And in the end, we provide reports on aspects such as reliability, availability, throughput, cost, and CO2 emission.”
One of the main components in those client reports have been Grafana dashboards, which help customers better understand the health of their assets and clearly define their strengths, weaknesses, and how they can improve.
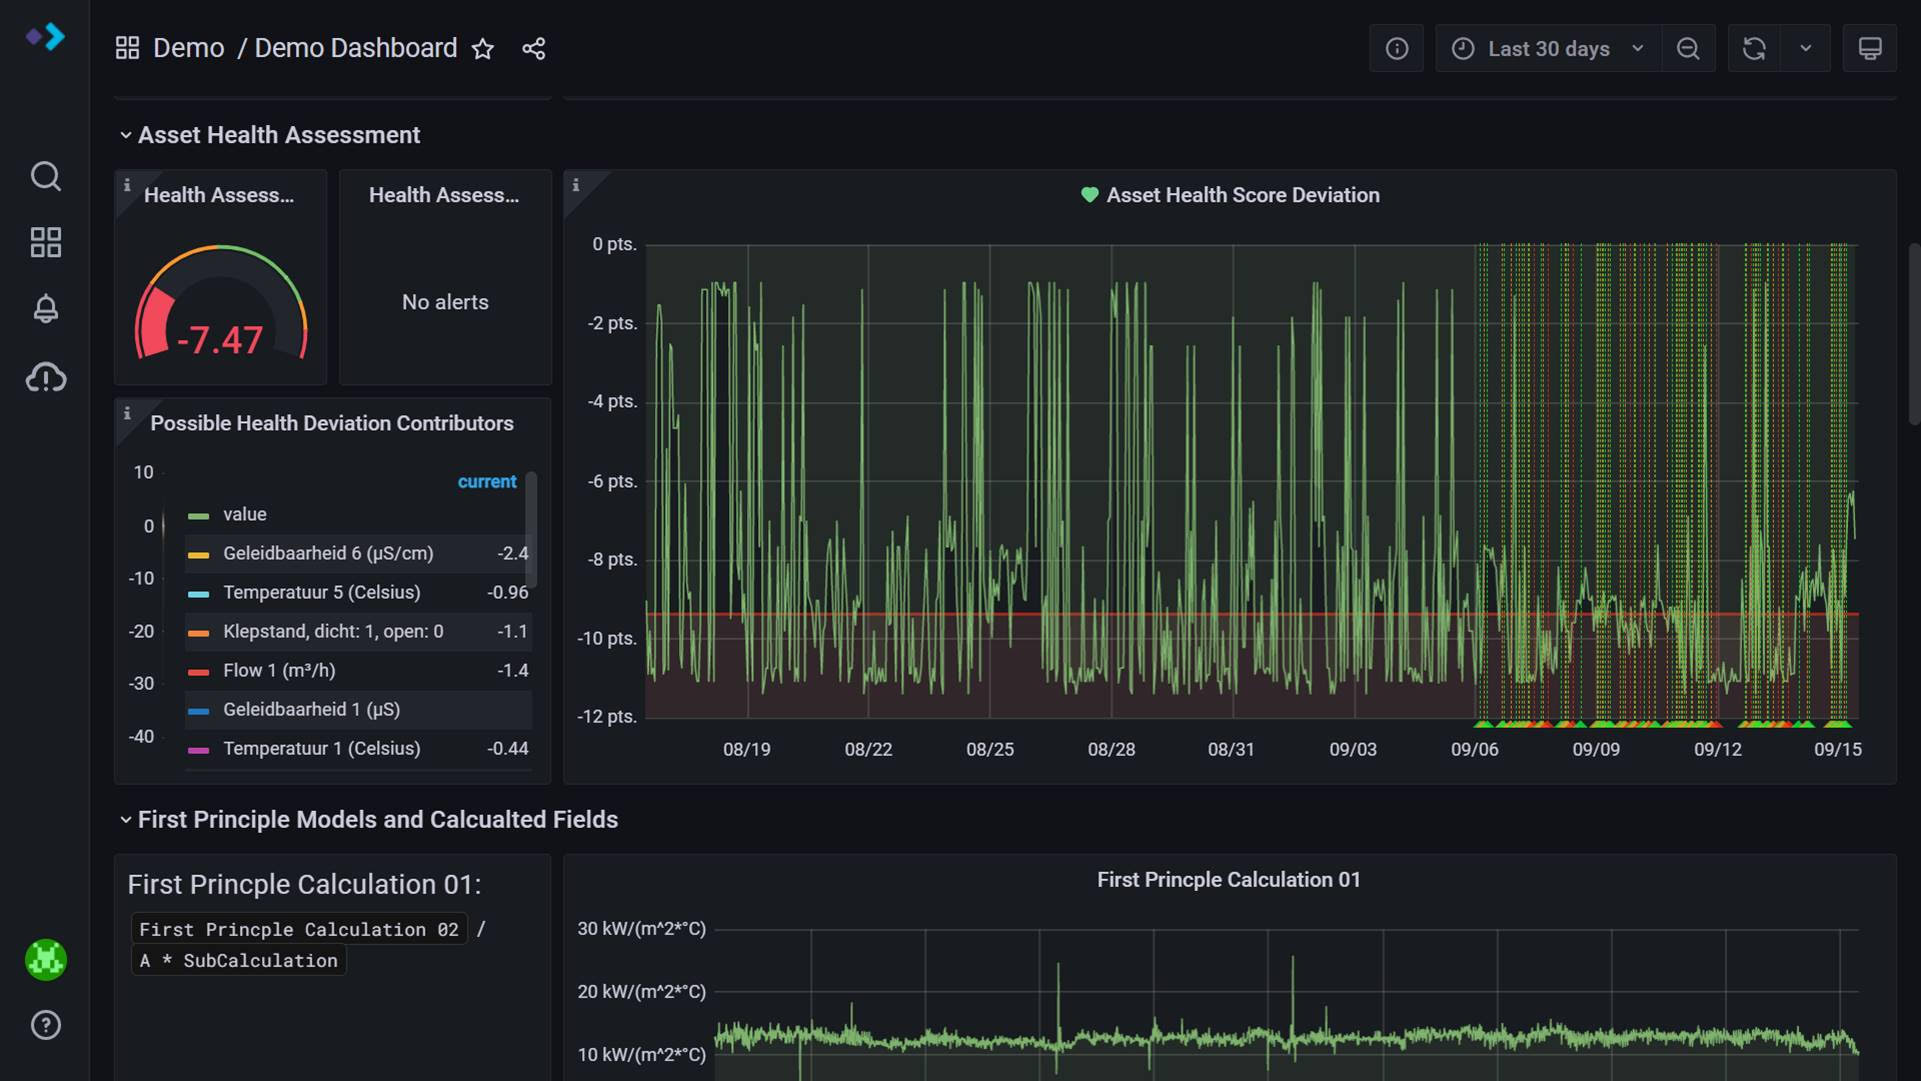
Asset Health Score Dashboard Example
“I talk to the customer about what we can do to help them monitor and make the right decision,” says Bosmans, “and Grafana is an important tool in providing information to really make the right decision.”
Simple sensors in a complex network
Instead of diving right in, Sitech often takes a step back when working with industrial clients in order to get a full picture of their plants’ operations.
“All these factories are meant to run for decades at a time. Whole teams are dedicated to make sure that everything works with as minimal downtime as possible, and the processes they use are time-proven,” says Forman. “It’s all in an ecosystem that is very interconnected. We take a step outside of that environment and take the data into a new environment for new kinds of analysis.”
The plants are essentially big chemistry sets — they heat, they maul, they grind, they transport — with telemetry data on the performance of every component within each piece of equipment.
But not all processing data is made equal. For example, a grinding machine could have temperature sensors on the drill bits as well as vibration sensors, some of which could be WiFi sensors or built-in sensors that are vendor-specific. Then there are also conveyors that have different sensors for metrics such as load and temperature.
“These are all simple things connected to create a complex network of information,” says Forman.
Then there’s the sheer volume of information that accumulates at any given moment. An asset can have up to 50 sensors tracking its performance, and a plant can house anywhere from 20 to 1,000 different pieces of equipment. For every asset, the team collects “very, very fine-grain data” that measures up to several data points in one second.
“It’s an absolutely gigantic amount of data that is stored,” says Forman, who estimates that they collect hundreds of time series per client. “If you imagine the number of sensors on each asset, most of them will have more than one record every second.”
“Grafana kept meeting the requirements”
Grafana was introduced to Sitech thanks to Forman’s thesis work in 2020 which focused on improving engagement and usability within data science products for the condition-based monitoring that is vital to Sitech’s business.
“We used to have a solution that was managed by us,” says Forman. “As it aged, the question came up more and more about how we can find ways to improve user experience.”
A foregone conclusion was that engineers need their tools to be unified; they didn’t want to switch from one tool to another to solve different problems. That also meant that the solution had to encompass not only the data science visualization, but also all of the condition-based monitoring visualization. Apart from that, there were massive amounts of data that had to be managed and orchestrated from a central point that also allows for fine-grain control over the UX.
“There was one solution, and that was Grafana,” says Forman, who started with the OSS version. “We had to test and validate if Grafana was user-friendly and ensure that it met a long list of prerequisites such as including context, customizing data, and supporting user access control. Grafana kept meeting all the requirements along the way.”
When Forman graduated, so did Sitech’s Grafana usage, and the Sitech Asset Health Center upgraded to Grafana Cloud. “We’re a small and lean team. We need to focus on what we’re good at, and we need other specialists to help us where they can,” says Forman. “That’s what Grafana Cloud does for us. We don’t have to worry about hosting or support. That’s all taken care of, so we can do what we do best, which is manage our data and our dashboards to help our customers do what they need to do.”
Sitech adopted Grafana Enterprise as well for the single sign-on and team sync functionalities. “Coming back to user experience, it was impossible to ignore that users need to have a seamless experience from their Sitech environments and the Grafana environment,” says Forman. “The active directory and single sign-on integrations allow us to do that.”
Information is generated in the form of annotations because “we are trying to draw a conclusion about behavior and health of that equipment,” says Forman. “We want to log our observations, and that’s what we use annotations for.” In fact, annotations are so vital that the team developed a system where annotations are stored in an external database along with the dashboards themselves, the information encoded into them, and the JSON.
The Sitech team has also embraced new features in Grafana 8.0 such as state timeline which, along with the community plugin FlowCharting, helps the team monitor safety barriers in nodes that evaluate upwards to top nodes.
Customization, control, and remote connectivity
The benefits of Grafana were immediate. The speed alone of accessing and displaying data was noticeable. “The web layer connects to our database and uses technologies to make sure our information comes up to the screen quite quickly,” Forman says.
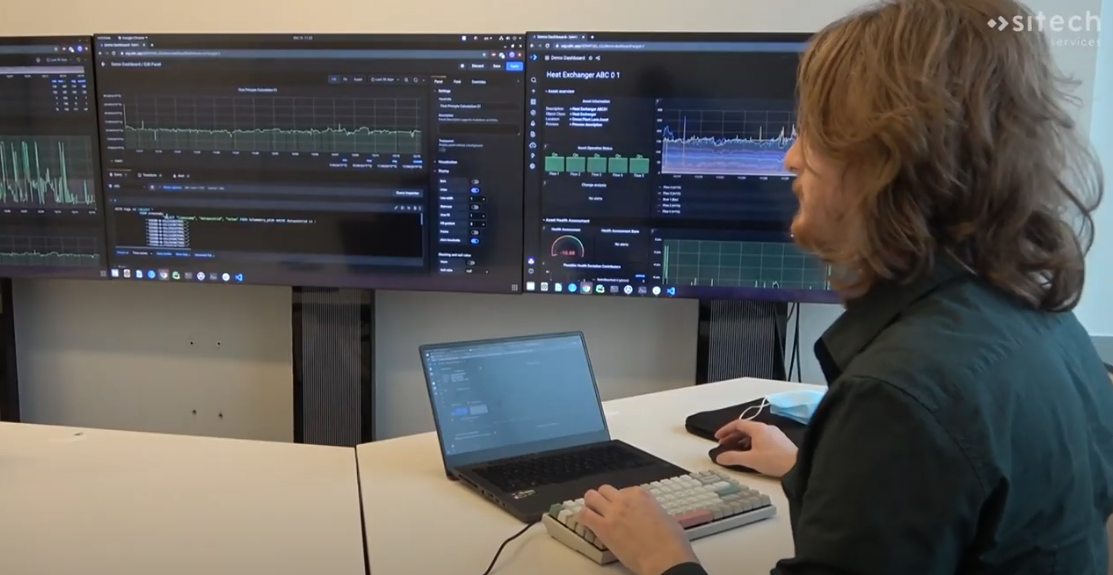
What they have been able to do with that information is even more impressive. For industrial IoT, Grafana introduced the ability for a single engineer to proactively monitor hundreds of assets remotely. “The evolution in technology goes so fast that we can now connect everything without pulling wires,” says Bosmans. Today “we perform wireless measurements that are gathered with all the other data and sent over to Rowen’s team to be analyzed.”
Grafana also enables data to be highly customizable. “The fine-grain control that Grafana gives within the dashboards and the possibility of visualizing and dashboarding that allows you to take control of the user experience yourself, those are all things that were not possible before,” says Forman.
Finally while the data itself is vast and all-encompassing, Grafana unifies the information into one centralized source. This allows the teams at Sitech to create in-depth solutions for customers that are much more collaborative and that promote a more harmonious workflow across the organization.
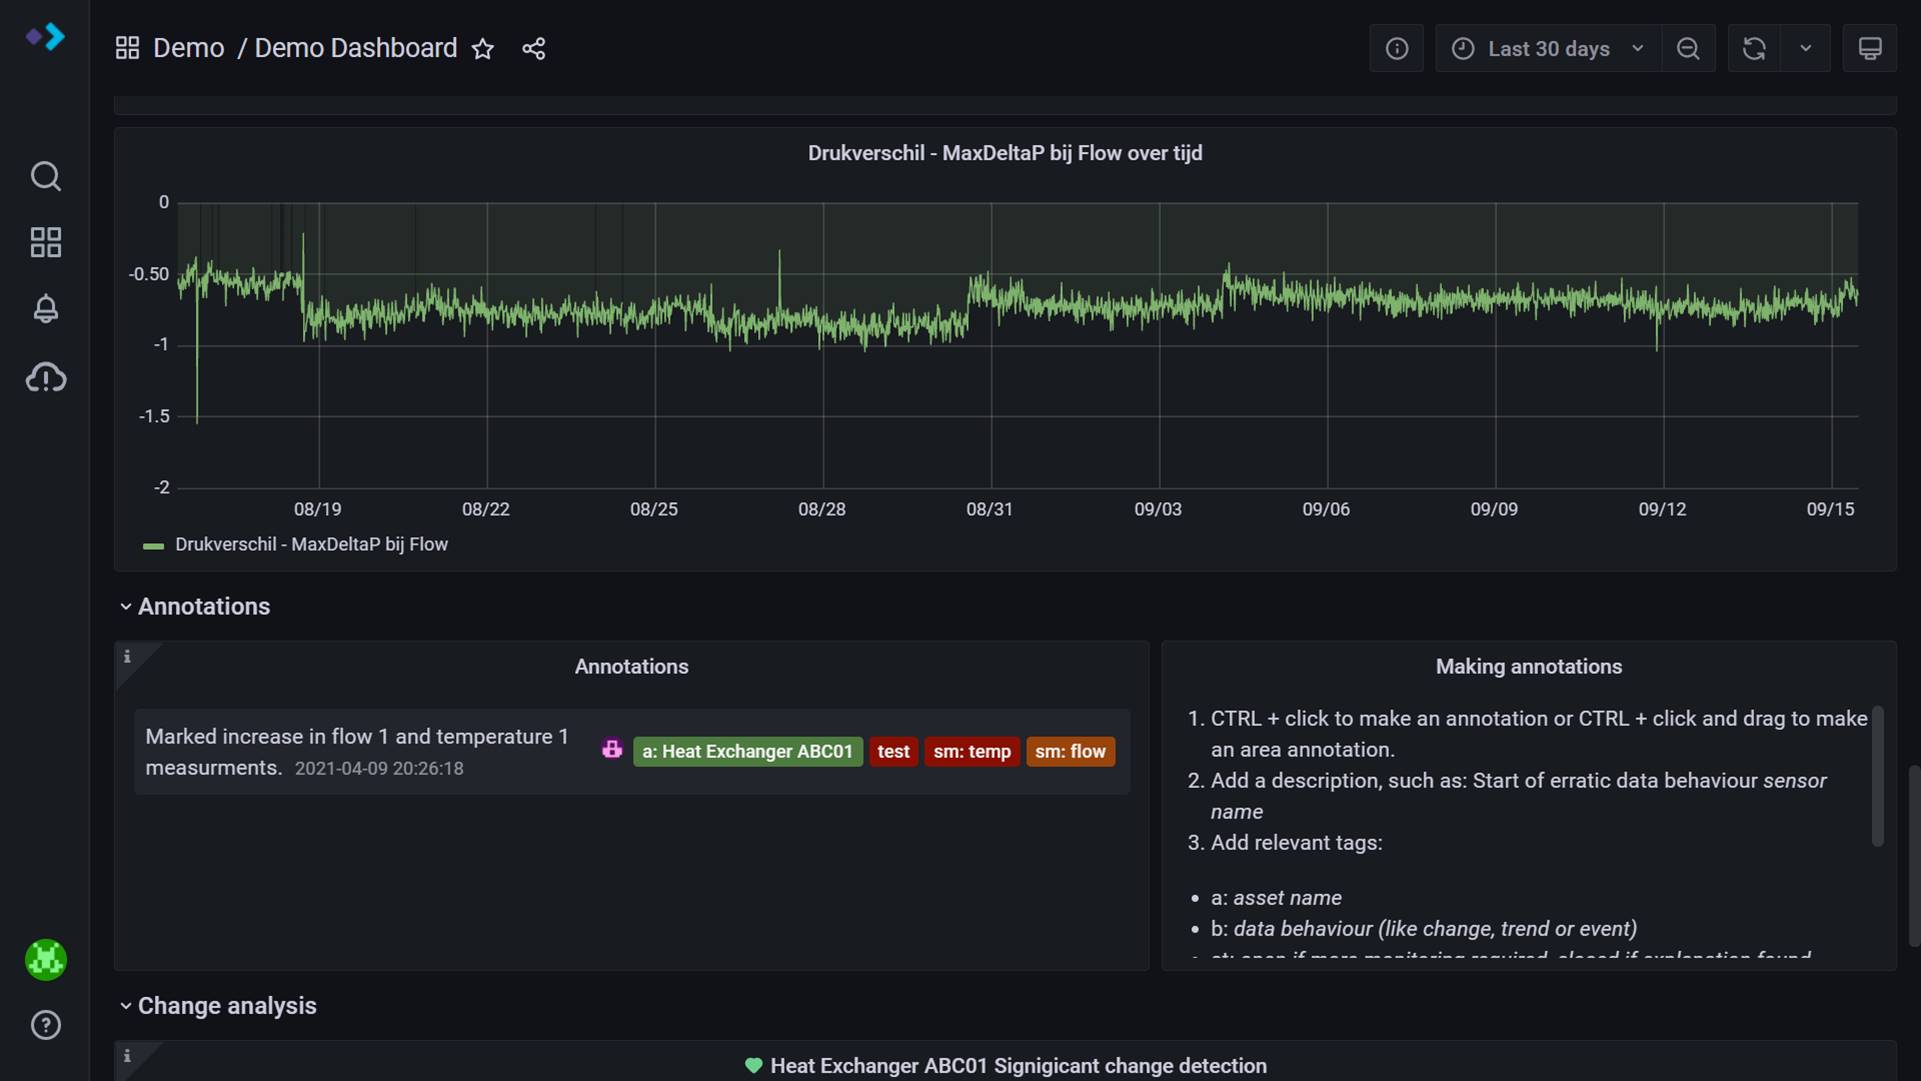
Grafana annotations provide Sitech clients historical context on asset health changes
“The opportunity that we now have, with help of Grafana, is the ability to start looking at very critical factors like user experience, scalability, and how it all comes together,” says Forman. “We’re looking to improve and create a new integrated solution.”
The asset analysis can become so attuned to the health of the system, that the same tools that are used to solve issues can now predict them.
In the past, machine maintenance was rarely rated or reviewed. But with the work of Sitech’s Asset Health Center, “with a maintenance intervention on a machine in one week, we can advise the team to go back and do it again if it wasn’t done right the first time,” says Bosmans. “We can see, based on the data from the machine, if the machine is still not in a perfect state.”
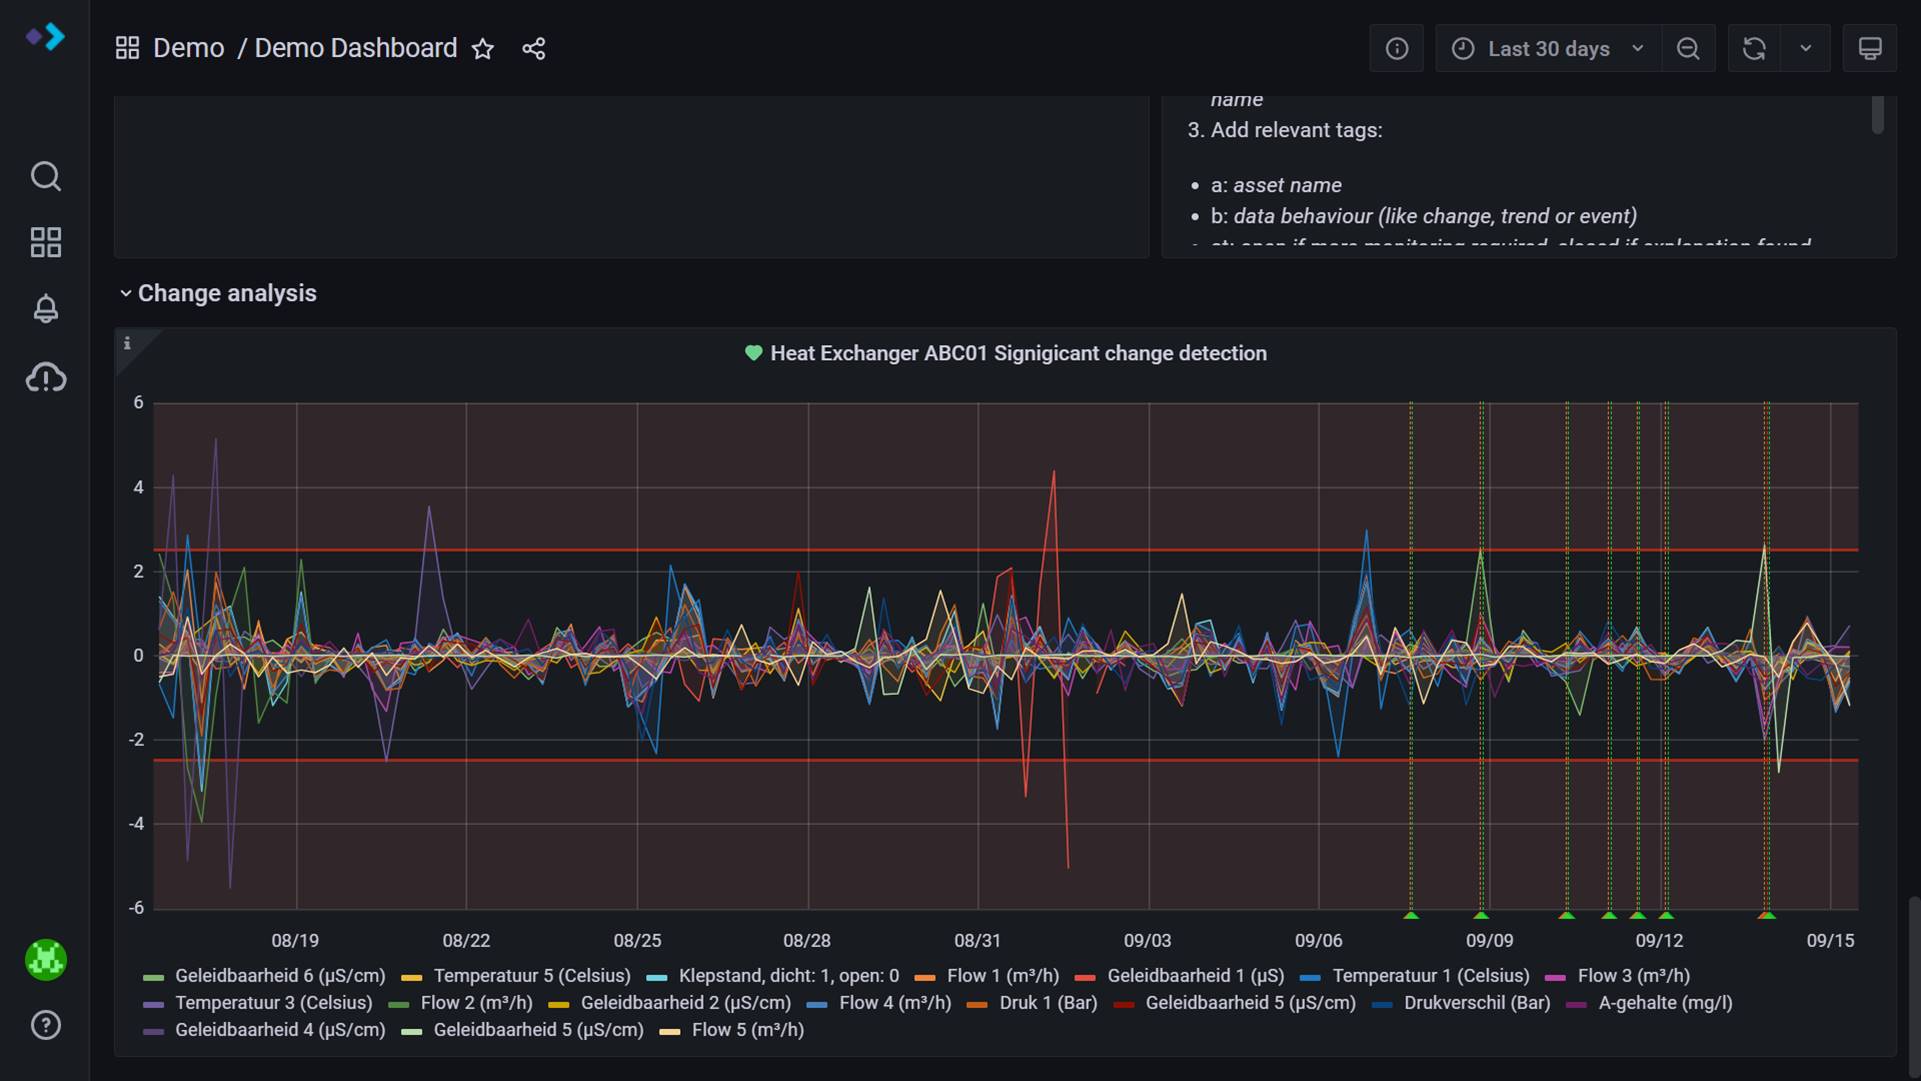
Clients can quickly analyze operational conditions to detect problems
Sitech also has insight into more unintentional performance glitches. At one location, Forman noticed some erratic data coming from the conveyor belts of a machine. “He said there’s something very wrong with the belt because the vibrations are going up and down continuously,” recalls Bosmans. Turns out, an operator was waiting for a startup and started mindlessly drumming on the conveyor.
“It’s always been possible to do a retroactive investigation, but the way that Grafana is set up, it allows us to monitor at a scale where we can see everything, all the time,” says Forman.
For real issues that may arise, the Sitech Asset Health Center maintains an internal list of alerts that the entire team has access to, but they only send alerts to customers as needed or for specific incidents.
Expanding industrial IoT monitoring abroad
While Sitech has reaped many rewards from Grafana, Grafana Cloud, and Grafana Enterprise, shifting to a new observability platform — both internally and among clients — didn’t come easy.
“The industry is made to run for decades on end, so it makes sense that it’s hard to bring change into an environment like that,” says Forman, who has hosted webinars to encourage Grafana adoption at Sitech. “Being the ambassador for Grafana is an important role.”
Luckily he gets plenty of support from the Grafana community. “From the support engineers, to the forums where people share support for the plugins often with many of the devs from Grafana in there as well, to the events like GrafanaCon, the community feels alive and it feels good to be a part of that,” says Forman.
Grafana has also encouraged teams within Sitech to collaborate more. While the Asset Health Center observes, analyzes, and draws conclusions based on data science, the engineers at Sitech provide their feedback, knowledge, and expertise, which compliment the information and help shape a richer observability story. “Together we create that synergy,” says Forman.
Now Sitech Services has ambitions to scale their business and hold court with other industrial institutions outside of Chemelot. “We can now perform remote support and remote analysis beyond this site,” says Bosmans. “There’s a whole new world opening for us.”