How the telecommunications and media company NOS uses Grafana to troubleshoot its mobile network
It may seem like ancient history, but there was a time when telecommunications companies only had to worry about connecting customers over landlines. Today, their businesses depend on vast cellular networks to not only provide strong wireless phone coverage in countless locations, but also handle the demands of tablets, computers, and machine-to-machine communications.
NOS, a Portuguese telecommunications and media company, does all of that and more. It provides customers with mobile and fixed networks, cable and satellite television, and high-speed internet. And with 2G becoming 3G, then 4G, and now 5G, the mobile network alone keeps getting more and more complex. “We have more services, many more nodes, and a lot more technologies,” says Ricardo Dinis, NOS’ Head of Mobile Network Analytics and I&D, who leads NOS’ recently-added mobile network analytics team within Mobile Engineering Department.
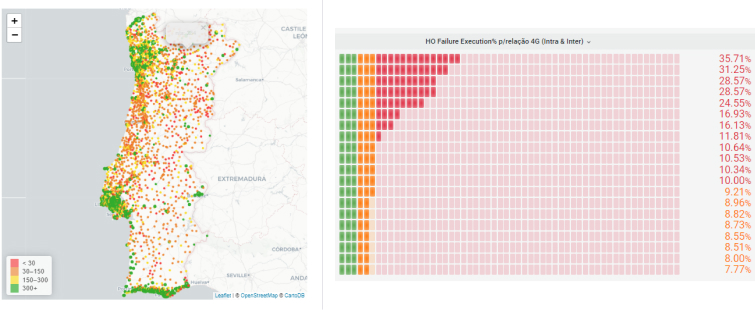
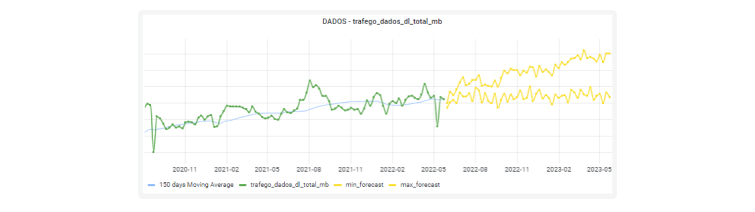
Telcos live and die by the quality of their service, and since dropped calls and spotty connectivity are a big reason customers switch providers, network monitoring is critical to remain a leader in the field. “One of our main tasks is to identify where our customers are experiencing a lack of service or problems,” Dinis says. The engineering teams also need to look out for huge spikes in traffic and address that as well. “We are optimizing the network daily, adjusting existing capacity dimensions or planning new network nodes,” he adds. “The end goal is to have the customer at the center of our decisions.”
In order to stay nimble in the modern, scalable, flexible industry and meet that goal, NOS required an equally modern, flexible, scalable technology. “We needed to introduce more ways of crunching data to know as soon as possible where we are having problems on the network,” he explains.
Since 2017, the company has relied on Grafana for monitoring those metrics. It’s made troubleshooting easier for the engineers, who can now analyze data in less than a minute. “It’s huge,” Dinis says. “Five years ago, if the business came to us with problems, we struggled to address them, and we weren’t troubleshooting and correlating data with the same amount of detail as we do today. Now, we can respond to business questions faster and with much more detail. We are much more efficient and we are delivering much better results with Grafana.”
Dialing into data
Dinis works in the telecom sector since 2000, and over the years, he’s seen a big shift in how the company operates. Business analytics and radio network analytics were always important, but challenges today are more complex and the industry evolves much faster, the migration of workloads to the cloud and introduction of AI is playing a crucial role in the management of modern networks.
NOS has different engineering teams to handle its mobile, TV, and fixed networks. Within the mobile network engineering team, responsibilities include planning, optimization, and radio network deployment.
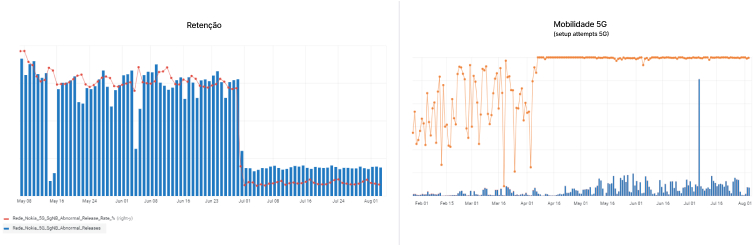
Optimizing the radio access network is quite challenging. Instead of big central nodes, there are towers with base stations along with geographically dispersed antennas which are used to deploy service in the areas where the company has customers. “We have thousands of nodes and hundreds of thousands of counters, and with those counters we create the key performance indicators of the network,” Dinis says. “It’s a huge amount of information.”
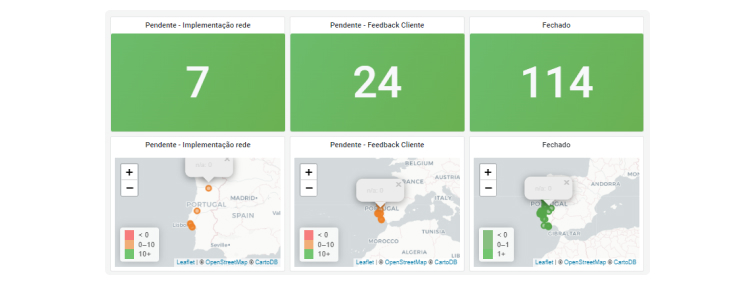
The mobile network engineering team then takes that information and uses performance tools to create reports that cover main KPIs. Radio network engineers usually run analysis using KPI dashboards to identify and understand the areas where there are problems. Then, they drill down on those problems to try to sort out their root cause, determine which users are impacted, and decide how to address the performance gap and optimize it to improve the user experience.
Before NOS began using Grafana, they were using the Business Objects suite that was only providing static reports that contained limited information. “You couldn’t do easy filtering and have the filters applied in all the panels and charts,” he recalls. Plus, as the databases began growing, it took more time to access the relevant data. “If we needed to do several daily analyses, it became a pain point for the engineers,” Dinis recalls.
They started working on optimizing the process by creating data subsets. That way, they could extract data, calculate KPIs and aggregate them in a way that was most helpful. “We spent time working on those ETL processes to have a subset of the data organized in the way we want on a department database,” he says.
Seeking a solution
Once NOS’ mobile engineering team had determined how to mine the radio network data, they needed a way to visualize it.
During his long career at NOS, Dinis had acted as the bridge between telecommunications, tools, and analytics. He became very interested in open source projects, which is how he first discovered Grafana. There were a few reasons why he thought it would be a good fit for his team’s needs. “Grafana supports several databases and it’s quite easy to configure,” he says. It also had more visualization functionalities than NOS’ existing tool. Dinis was also drawn to Grafana because it was an open source project with a big community.
Mobile Network optimization is performed in daily cycles rather than troubleshooting in real time or near-real time. The data is usually aggregated into hourly and daily KPIs. “When we started, the problem was that data was slower coming in because data is stored in huge corporate databases,” Dinis says. “Now we are processing a subset of data and optimizing the data structure to be quite queryable, quite fast. That’s important because the engineers are querying the data dozens of times a day for different cells, different areas, and different parts of the network. If it’s slow, the efficiency of the work will get worse.”
To test out Grafana, Dinis configured it on top of his department’s database. Most of that data is on an SQL server database. When they began the test, Grafana was not supported yet, so they had to replicate a cluster of data to a MySQL database and used Grafana’s MySQL plugin to query the database directly from Grafana. They also relied on InfluxDB for health check servers.
During their testing period, SQL Server started to be supported, though not with all the functionalities as on other databases. “But we quickly migrated the dashboards and after some time, we had Grafana running on top of an SQL server,” he explains.
NOS only had one dashboard at the time, but they immediately saw a difference in capabilities compared to what they were using. “In Grafana, it’s easier to drill down to the problem to filter the time series, and also to crosscheck data in several panels that are adjusting at the same time,” Dinis says.
NOS still uses its main performance manager tool because the company is processing all the counters that are coming from the network. “For some kinds of troubleshooting, we need to dig and go into much more detail in some counters that are only on the main database,” Dinis explains.
But if we use that huge database for all the use cases, it can take several minutes to query a wide area and we cannot wait 10 or 15 minutes in recurring analyses. That’s our main problem and why we moved to Grafana. Now we are also able to aggregate the data in the way we need it to and It’s much easier to quickly adapt the data to the analysis that we have. Of course, in Grafana, it’s much faster because the database is optimized, so we are able to query the data in a few seconds.
Ricardo Dinis, Head of Mobile Engineering Analytics and I&D | NOS
Connecting with Grafana
With that proven value for Dinis’ team — and because Grafana is so easy to learn — other teams at NOS have organically jumped in and adopted it for their purposes as well. Currently, there are about 30 radio network engineers in the department using Grafana. They are creating their own dashboards and adding new use cases on top. “We started with me deploying it and creating the first dashboards, but now I don’t even know what is in our Grafana system,” Dinis admits with a laugh.
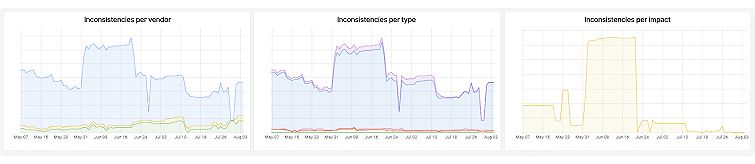
The NOS engineering team started using Grafana with radio access network KPIs and is evolving to add other Core network domains. That way, we have a holistic view of the network that is crucial to troubleshoot and correlate across all network domains. We are also centralizing or pushing data from other data sources, like radio network traces, where we have user centric information and so on.” They are also running the use case dashboards for inconsistency checks of data.
A ringing success
For NOS, Grafana has delivered a double win. On the technical side, engineers can now spend less time on a single issue, which means they are freer to help analyze and optimize additional things across the business. And because they’re able to see more data, they’re providing the business with better connectivity — which translates to happier customers.
“We are always focused on customers and delivering the best services possible,” Dinis says. “We also want to know them better. What are our customers’ pain points? Where are we having problems? With Grafana, we know the network better and we can optimize it so we’re not waiting for customer complaints — we’re aiming to act before we even get them.”
Dinis says there’s still room for improvement, so NOS is now adding machine learning to try to identify patterns on the network — clustering customers, performance, and more. “We have a long road ahead, but the network nodes and configuration are also evolving,” he says. “We are able to extract more information from the network than before, so we have better tools to go from network-centric to customer-centric KPIs.”
He points out that even though the engineering teams are getting smaller and the network is getting more complicated, “We’ve improved a lot. The way we optimize and troubleshoot the network is much better than before we installed Grafana.”
Broadening the spectrum
The success Dinis and his team had with visualizing time series data — and seeing the flexibility of the growth on a stack — awakened them to other problems they could solve with additional Grafana dashboards. The team, meanwhile, is more focused on analytics and automation which increased the number of workloads the team has to manage and keep running on the servers.
“We’re moving towards having more observability, traceability, metrics, and logs,” he explains.
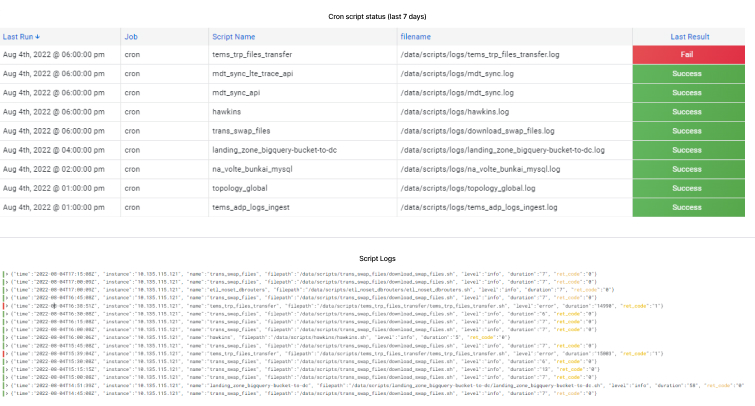
Our team had never used an observability solution before, so this was brand new for us. “We are telecom engineers, so we start creating scripts without worrying much about centralizing logs and observability,” Dinis says. “As soon as we started growing the number of processes, it was important to start optimizing the way we observe all of the processes that we are running — ETL, automations scripts, and so on.”
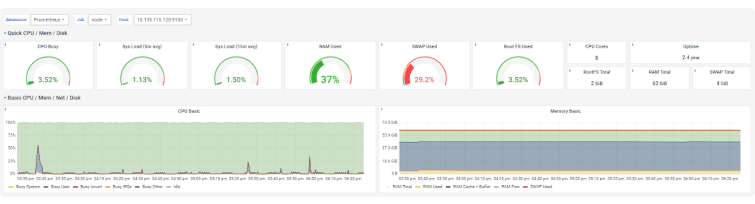
Recently, NOS deployed Prometheus to scrape time series metrics from servers using the scripts they are running. After that, they installed Loki to centralize the logs, which they’re visualizing with Grafana.
With Grafana Loki, Prometheus, and Grafana, our observability is much more controlled. But it’s more than just that. Now when we have problems, it’s easier to troubleshoot without having to try to understand where the script is failing and where the logs are. Everything is centralized and easy to access. We are running alarms on top of that, too, which helps us act faster.
Ricardo Dinis, Head of Mobile Engineering Analytics and I&D, NOS
Without Grafana, he adds, “we’d be in trouble for sure. We have several daily tasks supported on Grafana products, and we are running critical daily analyses of the network on top of it.”
Future plans
By choosing Grafana as its observability tool, NOS is now set up for continued success in the telecommunications industry.
“We are much more efficient and we are delivering much better results with Grafana,” Dinis says. “Of course, there are other solutions in the market, but Grafana is good in terms of integration, it’s easy to deploy, and the learning curve is quite fast.”
Using Grafana even changed the scope of Dinis’ role at NOS. “I’m more focused now on analytics and trying to improve the way our engineers are working with data, and optimizing and automating the processes,” he says. “Grafana helps me with that.”
He plans to keep an eye on Grafana Labs’ other products. “Grafana Labs knows folks like me need to do our jobs better and faster, how the industry is evolving, and where to define new products to address that. I’m looking forward to seeing what is next. "