How Kushki Uses Grafana Cloud to Centralize Their Observability Data and Gain Better Business Insights
Executive Summary
As a leading digital payments provider in Latin America, Kushki is responsible for ensuring safe and successful electronic transactions for more than 200 customers across the region. The Ecuador-based company is 100% serverless using AWS Lambda and DynamoDB, and they also use AWS Route53 for API user requests, AWS X-Ray for tracing, CloudWatch for log files. To bring together all of those signals, Kushki migrated to Grafana Cloud for a centralized view of their infrastructure as well as their overall business.
Why Grafana Cloud?
Kushki was able to leverage Grafana Labs’ fully managed open and composable observability stack to unify all their data sources and visualize their telemetry in one comprehensive monitoring solution.
Centralized observability stack
With Grafana Cloud’s vast network of 100+ data sources plugins, Kushki engineers were able to consolidate and correlate their data from MongoDB, Prometheus, AWS XRay, and CloudWatch into a single pane of glass with hosted Grafana. By bringing together disparate data sources for their metrics and logs into Grafana dashboards, the team was able to expand the breadth of their overall observability strategy. “Our monitoring and observability is not just about servers, APIs, or resource usage in AWS,” says Giacomo Orizzonte, Cloud Infrastructure Manager at Kushki. “It’s now about how we can adopt the tools provided by Grafana Cloud at a business level and use them to look at the success of our customers on our platform.”
Easy onboarding
When the team purchased Grafana Cloud through AWS Marketplace, they not only saved time and reduced the procurement process from months to just days. They were also able to configure and implement the visualization tool instantly. “The learning curve was fast,” says Javier Valencia, IT Architecture Manager at Kushki. “Migrating from one tool to another can be painful for anybody, but our teams found that learning how to use Grafana was not painful at all.”
Win-win partnership
When deciding to move off their existing monitoring platform to Grafana Cloud, a major reason to migrate was the Grafana Labs team. “With Grafana Cloud, we had a provider that helped us throughout the whole process so it’s a win-win for them and for our company,” says Javier Valencia. “Grafana was also honest about their development process. The clarity of what features are in the roadmap was very important to us.”
One platform, multiple benefits
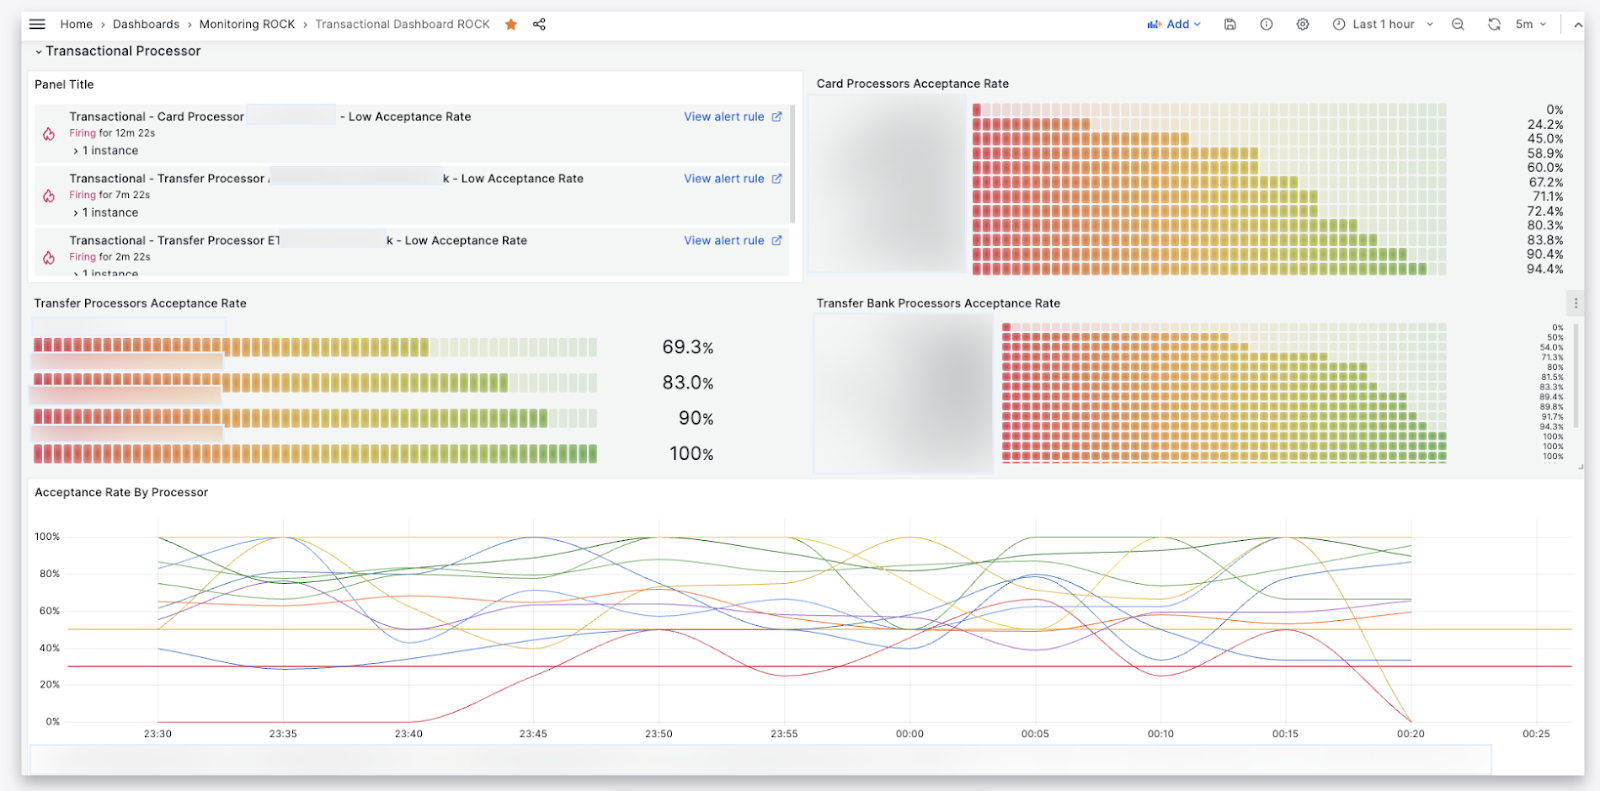
When Kushki first set out to find a new observability tool, they were focused on bringing together all their data to more efficiently monitor their infrastructure. What they got with Grafana Cloud is a solution that taps into so much more. The insights from the unified data have brought added value to the company by identifying areas of improvement to boost application performance while also providing top-level executives with more in-depth analysis for key business indicators, such as the success rate of their transactions.

Challenge
The Cloud Infrastructure and Architecture Teams first started with a host of different tools to track transactions from end to end for all its customers. As the company began to quickly scale, however, it became increasingly more difficult to juggle different platforms when determining the root cause of issues that would arise. “We had a tool to see technical issues, another tool to see business issues, and those were separate from our visualization tool,” says Javier Valencia. “So the principal goal we had was to identify a single tool that would give us a complete view into our systems. We also wanted to better understand the real reason behind why a transaction wasn’t successful — Was it a technical cause? A business cause? A change from the dev team?”
Solution
The answers to all of the above could be found with Grafana Cloud, which allows you to access and unify all your data in AWS offerings such as Amazon CloudWatch, Amazon Athena, Amazon OpenSearch Service, Amazon Redshift, Amazon Timestream, and AWS X-Ray, as well as third-party tools like Elasticsearch, Graphite, InfluxDB, and more. They’re also leveraging Grafana Alerting to aggregate different data sets to configure multi-dimensional alerts. “That’s a new feature for us that helps a lot,” says Giacomo Orizzonte.
Results
Now when they analyze the success of any given transaction, the team has immediate access to data regarding response times, APIs, or a Rails app in a single Grafana dashboard. But that’s just the beginning. Not only can they see the data more clearly; they can proactively react to insights as well. “The complement to monitoring is we can now visually understand the transaction flow in one place,” says Giacomo Orizzonte. “With these visualizations, we are able to understand what we can change on our side — some parts of our call, our libraries, our components — in order to optimize our response times. We have already been able to take three seconds off of the response time of our API by correlating logs and AWS X-Ray data in Grafana.” And they expect to see more benefits down the road. “We’re doing more exploring with Grafana Machine Learning, and we are expecting many new functionalities with alerting,” says Giacomo Orizzonte. “The future is great with Grafana.”


