Why Grafana Enterprise is at the “heart” of Informatica’s observability strategy
As applications become increasingly distributed and complex, a centralized view into the health of those applications — and the underlying infrastructure that supports them — is no longer just preferred. It’s essential.
Just ask the observability team at Informatica.
Tasked with monitoring and maintaining a multi-cloud infrastructure that includes hundreds of VMs and Kubernetes clusters, the team needed a “single source of truth” to quickly identify and troubleshoot issues, and ensure the reliability and performance of both their internal and customer-facing platforms.
They found that source of truth in Grafana — initially, in Grafana OSS and, more recently, in Grafana Enterprise.
“All of our Kubernetes and VM clusters across our different cloud providers — all those metrics are collected using Prometheus and then it’s visualized, everything, through Grafana,” said Amreth Chandrasehar, director of machine learning (ML) engineering, SRE, and observability at Informatica. “Grafana is really an integral, core part of our observability platform.”
Currently, Informatica has around 300 active monthly Grafana Enterprise users – a number that’s grown 10x since 2019. Users are encouraged and empowered to create their own dashboards, tailored to their own requirements: SREs, QA testers, machine learning engineers, and executive leaders alike all rely on Grafana dashboards daily to gain the insights they need.
And with more than 1,200 dashboards currently in use at the company — including one known, fittingly, as Informatica’s “observability heartbeat” (more on that below) — they only anticipate their Grafana use cases to grow.
From Grafana OSS to Grafana Enterprise
After trying different hosted platforms, Informatica began using Grafana OSS in 2019, and migrated to Grafana Enterprise in July 2022. Several reasons prompted the move, including a desire for more robust security features, such as team sync, as well as access to additional capabilities like report scheduling and Dashboard Insights.
According to Kirti Parida, DevOps architect at Informatica, Dashboard Insights is a critical tool for monitoring dashboard usage patterns across the organization, while Data Source Insights, another Grafana Enterprise feature, helps the team track usage across 150 Grafana data sources, including Prometheus.
“If any user runs a query and gets a timeout or any errors from a data source, we get notified because of Insights,” Parida said. “Also, because we give power to users to create their own dashboards, there are so many dashboards that get created. Some of them are being actively used, some of them may need a cleanup. We wanted that information, [because] it gives us insights about which team is actively using [which dashboards], what might be preventing them from using a dashboard, and where our team can help out.”
Another benefit of Grafana Enterprise, according to Chandrasehar, is that it offers a best-of-both-worlds experience: Informatica gets the around-the-clock technical support you’d expect from a commercial product’s SLA, but still feels very much a part of Grafana’s broader OSS community, collaborating with others to create a best-in-class observability experience.
“We get a lot of value through an active engagement with Grafana Labs in terms of support — and not only that, we want to give feedback about the product back to the Grafana team, based on our usage,” Chandrasehar said. “Those conversations, so far, have been very constructive.”
Informatica’s dashboards: Observability heartbeat, Kubernetes costs, troubleshooting, and so much more
Informatica has made data visualization a cornerstone of its observability strategy — and certainly has the Grafana dashboards to show for it.
One of the company’s most widely used dashboards is its “observability heartbeat,” which provides a unified, high-level view of Informatica’s entire IT infrastructure deployment, allowing users to drill down to the information that’s most relevant to them
“We have created our entire centralized observability view in Grafana,” Chandrasehar said. “So if anybody, at any given time, needs to know what’s happening at Informatica, we have an awesome dashboard that gives us information about the core parts of the platforms, the Informatica products, the security services, and the cloud providers we use — every one of them is available.”
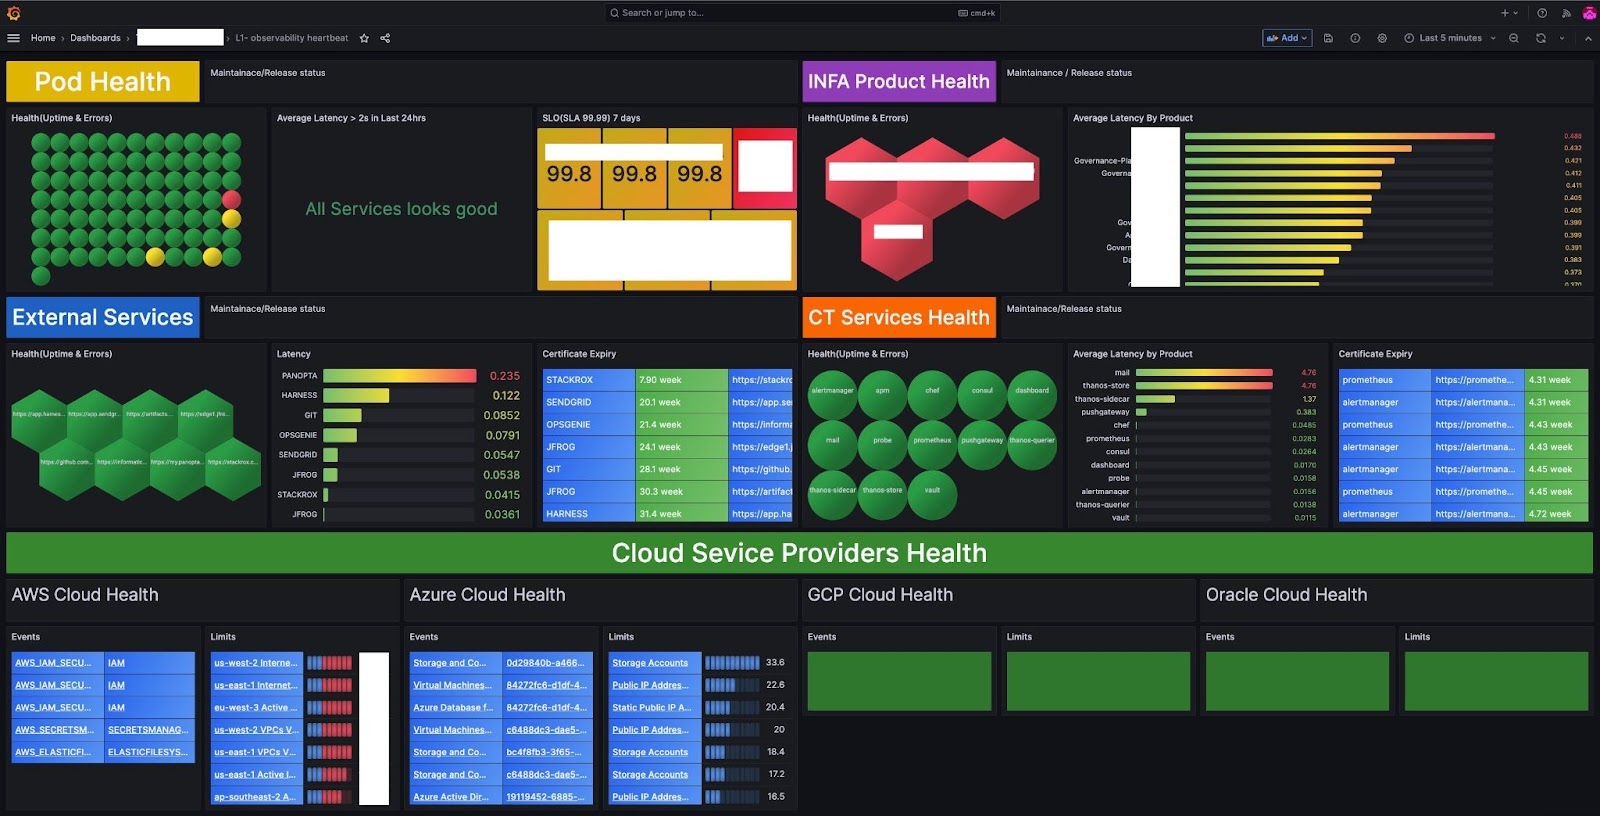
Caption: Informatica’s “observability heartbeat” dashboard provides a unified view of the company’s cloud infrastructure, which spans four CSPs.
In addition to its observability heartbeat, Informatica relies on a number of other Grafana dashboards to, for example, optimize Kubernetes costs (a dashboard that’s saved the company roughly $500k annually), perform capacity planning, track the status of cloud providers’ SSL certificates, and streamline troubleshooting processes.
“We have a dashboard that shows all these different correlations, and caters to most of our products. It’s the go-to dashboard for troubleshooting,” Parida explained. “In a single dashboard, for example, users can see the number of database connections, JVM resource usage, application pods — these are the things that really help reduce the time to investigate issues.”
This troubleshooting dashboard has helped the Informatica IT operations team reduce its MTTR by roughly 60%, according to the company.
Looking ahead
As for the next phase of Informatica’s Grafana adoption journey, the observability team is considering a migration from Thanos to Grafana Mimir — either OSS or Grafana Enterprise Metrics — for better cardinality management, and is interested in exploring continuous profiling with Grafana Pyroscope, as well as OpenTelemetry.
“We are extremely happy to see the growth and the momentum around Grafana, and we continually add new use cases,” Chandrasehar said.