How Houzz improved observability, MTTR, and MTTI using Grafana Loki and Grafana Tempo
Houzz was founded as a side project by wife-husband team Adi Tatarko and Alon Cohen with the mission to create the best experience for home remodeling and design. The idea came when they were remodeling their own home in 2009. They were frustrated by the lack of resources to help them articulate a vision for their home and select the right pro to make it a reality.
After they made their house a home, they made Houzz a home-renovation juggernaut.
For more than a decade, Houzz has become the leading platform for home remodeling and design, providing people with everything they need to improve their homes from start to finish. On Houzz, people can find design inspiration, research and hire home professionals, and shop for products to complete their projects. For home professionals, Houzz Pro provides an all-in-one software solution that empowers industry pros to stand out, win clients, and manage their projects efficiently and profitably.
Today, the Houzz community is made up of millions of homeowners, home design enthusiasts, and home improvement professionals around the world.
Renovating from monoliths to microservices with Grafana Loki and Grafana Tempo
As the company scaled, they also found themselves transforming their technology stack from monoliths to microservices pushing the DevOps team to look for a suitable tool to improve the log visibility and search.
But their legacy observability tools couldn’t keep up with the glut of new data, which made finding logs when they needed them a constant problem for the DevOps and the developer’s teams. As a result, when production system issues arose, the team was spending more and more time trying to pinpoint the correct data to look at, as opposed to attacking the root problem to begin with. This stunted team productivity.
“As a DevOps engineer, I prefer CLI and a terminal screen. When we moved to the microservices world, it was not a fit solution anymore, and most of the logging solutions I researched as a replacement provided too much information, so it was difficult to find the exact logs I was looking for,” says Yoram Kruvi, DevOps Lead at Houzz.
Kruvi says he was looking for a “keep-it-simple approach” and found that in Grafana Loki.
Before we started using Loki, searching for logs was a challenge. The one-stop-shop experience with Grafana gives us the ability to cross-reference data with application workload and infrastructure metrics, which saves us time and makes our search for relevant logs much easier.
Yoram Kruvi, DevOps Lead, Houzz
In addition to creating the logging issues that Grafana Loki was now solving, the shift to microservices also led to a network observability problem for Houzz. In response, they turned to Grafana Tempo as their tracing tool of choice.
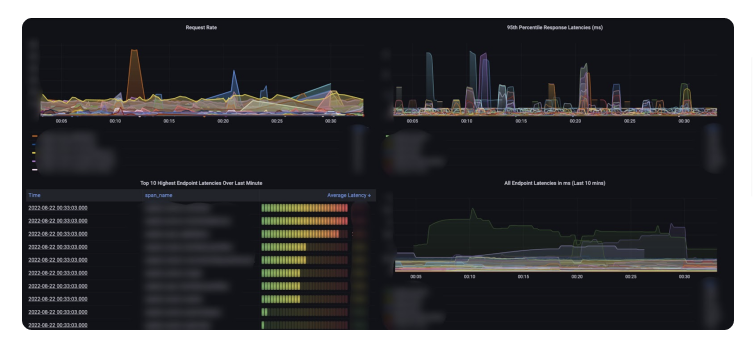
“Understanding where latency was increasing and finding areas where you can improve on that becomes more difficult once you have several services communicating with each other, so that’s where Grafana Tempo comes in handy and solves that,” says Roman Vogman, DevOps Engineer at Houzz. “Other than that, having multiple tools and UI’s and jumping from one to another while debugging makes things more complicated. Having it all in one tool like Grafana Tempo simplifies the process.”
Vogman was quick to point out that Grafana Loki and Grafana Tempo work in tandem, too. “Having the ability to connect logs found in Grafana Loki directly to the traces in Grafana Tempo, all on the same screen, simplifies the debugging process,” Vogman says.
And with the recent launch of Grafana Mimir – the most scalable, most performant open source time series database in the world – Vogman says he is eager to look into yet another piece of Grafana Labs’ LGTM stack in hopes of bringing more value to their company.
Grafana Loki: an “excellent fit” for Houzz log management
Because PromQL, the query language for Prometheus, is the basis for LogQL, the query language for Grafana Loki, the addition of Loki for logs came naturally.
“I had used Grafana and Prometheus for a long time. When Loki was released, it seemed like an excellent fit, a natural step for our log management needs,” says Kruvi.
Even better, implementing Grafana Loki was easy. In fact, it took the team just five minutes to get up and running from a Helm chart into a Kubernetes cluster. Beyond the simplicity of getting started, here is the blueprint for why Houzz embraced Grafana Loki out of the box:
- Part of a fast-growing community “If I have a question that can be answered by Google search, it’s worth everything,” says Kruvi.
- Cost-effective “The way Grafana Loki stores logs is so much more economical than our previous solutions,” Kruvi says.
- Kubernetes native “Having something that is built for cloud native technologies is a huge win for us,” says Kruvi, adding “it also contributes to the ease of getting started with logs.”
- Correlate metrics and logs “Being able to correlate logs with other metrics from different data sources on the same page and having access to that single pane of glass that Grafana was “a game changer when we have data streaming in from such disparate sources,” Kurvi adds.
Grafana Tempo: DIY demo
Traditionally, Houzz has used a Zipkin server for their tracing data and analysis. But when Grafana Tempo was released, the DevOps team decided to give the new open source solution a try based on the performance of Grafana Loki.
They weren’t disappointed. Like Grafana Loki before it, the jump into Grafana Tempo was quick and easy. The team did an internal PoC and saw success right away, but still needed buy-in from management in order to move forward. So they turned their sights to doing a live demo of Grafana Tempo on actual front-end service components and amazed their management by quickly showing where time was being lost in their requests and how they could use that data to mitigate those issues faster than before.
Plus if any problems did arise, the growing and passionate open source community around Grafana Tempo proved to be invaluable. “We decided to give Grafana Tempo a try when it was relatively new, so there wasn’t much documentation out there for different questions we had,” says Vogman. “When we were facing difficulties setting things up or fine-tuning the configuration we have, we often addressed the community and had an answer for every question in a matter of a few hours. This was particularly impressive considering our distributed team around the world.”
A few more design details about Grafana Tempo that the DevOps team called out:
- Open source and ease of use “Once you have the architecture for one down, getting started with the next part of the LGTM stack is natural,” Vogman points out.
- Cost efficient because it only requires object storage to operate.
- Deeply integrated with Grafana Loki “You can easily go from metrics to logs to traces, and back again,” says Vogman.
But beyond just the native power of Grafana Tempo, Houzz realized that its value was supplemented by Grafana Labs’ commitment to its “big tent” philosophy. “We like the option of using multiple sources such as OpenTelemetry, Zipkin, and Jaeger together, which provide the Dev team the freedom to choose what is the best fit for them,” says Kruvi.
Extreme makeover: observability edition
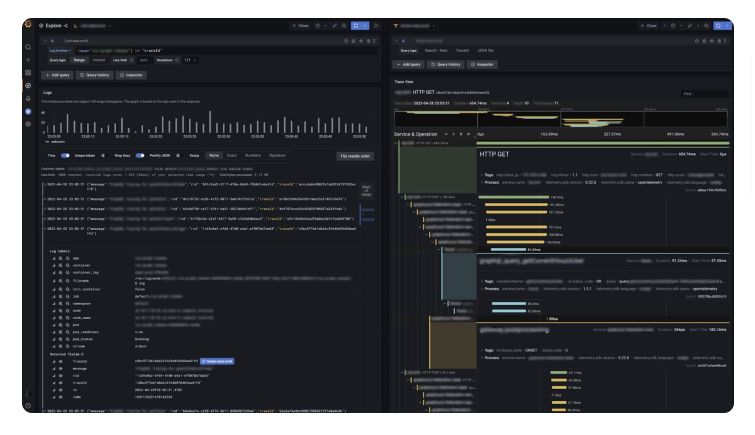
With Grafana Loki, the Houzz team now visualizes log data in Grafana and tracks trends over time. Grafana Loki runs the latest queries with the push of a button, filters logs from different sources, provides a log browser to search by log labels, and easily switches between time zones, which – given their position as a global leader – is important to Houzz.
For Grafana Tempo, the tool was easily adopted across the enterprise. That’s because it tracks system latency, drills down into details of each request, as well as detects regressions and points for improvement with span visualization.
Developers also value how Grafana Tempo enables users to jump between different data sources and different data types, and is available as a containerized application, which can run on orchestration engines such as Kubernetes.
For the DevOps Team, because of Grafana, we can respond much faster when we have the full picture, and we can better support the broader Houzz Team. We don’t need to rely on multiple systems. With Grafana, all the data and metrics are in front of our eyes in the same system and with the same views.
Yoram Kruvi, DevOps Lead, Houzz
Adopting Grafana tools has been quite beneficial on multiple levels for Houzz. For starters, Houzz is spending less on compute time and storage. In addition, MTTR and MTTI have decreased as well.
“With everything managed under the Grafana umbrella, time spent on incident resolutions decreased since we don’t need to jump between different systems to find a root cause,” says Vogman. “We were also able to fix many areas to prevent real incidents.”
“With the correlation of Prometheus, Tempo, and Loki data, we were able to put our fingers on real issues in the system, track them end-to-end, fix them, and see the recovery and improvements immediately,’’ Kruvi says.
Perhaps the best signs of Houzz improvement following the adoption of Loki and Tempo are the increase in uptime and stability of their platforms as well as a jump in their developer’s productivity. With developers dedicating less time to detecting issues in production, this has not only led to increased customer satisfaction, but also higher developer satisfaction. “The feedback from our developers is that they like Grafana’s simplicity,” Kruvi says. “Plus, fixing previous blind spots not only enhances developer pride but has provided Houzz customers with a better user experience on the platform.”