How Gojek is leveraging Cortex to keep up with its ever-growing scale
Gojek launched in 2010 as a call center for booking motorcycle taxi rides in Indonesia. Today, the startup is a decacorn serving millions of users across Southeast Asia with its mobile wallet, GoPay, and 20+ products on its super app. Want to order dinner? Book a massage? Buy movie tickets? You can do all of that with the Gojek app.
The company’s mission is to solve everyday challenges with technology innovation. To achieve that across multiple markets the systems team at Gojek focused on building an infrastructure for speed, reliability, and scale. By 2019, the team realized it needed a new monitoring system that could keep up with Gojek’s ever-growing technology organization, which led them to Cortex, the horizontally scalable Prometheus implementation.
“We were using InfluxDB for metrics storage. Developers configured alerts by committing kapacitor scripts in git repos. To achieve high availability, we had a relay setup with two InfluxDBs. Since we could not horizontally scale Influx unless we paid for an enterprise license, we ended up having many InfluxDB clusters with relay setup,” says Product Engineer Ankit Goel.
Some of our teams generate more than a million active time series.
Ankit Goel, Product Engineer, Gojek
In search of a better monitoring solution
Though the team had introduced automation for setup, managing all those Influx instances became a pain point for operations. Additionally, some of the Gojek engineering teams needed far greater scale. “Some of our teams generate more than a million active time series,” says Goel. Another common requirement from customers was long-term storage of metrics. With InfluxDB, Gojek only had 2 weeks’ retention, and increasing it would mean provisioning bigger instances.
Gojek was in search of a better monitoring solution that would meet the following requirements:
- Kubernetes native.
- Horizontally scalable.
- Highly available out of the box.
- High reliability.
- Low operations overhead so a small team can manage it.
Cortex met all of these requirements, and also had the following features that the Gojek team could leverage:
- Multi-tenancy.
- Customizable and modifiable, so it could be integrated with Gojek’s existing tooling.
- Support for remote_write.
Because it supports remote_write, Cortex enabled one of Gojek’s key needs: the ability to offer monitoring as a service. “With Thanos, we would have had to deploy a Thanos sidecar on every Prometheus that would have been deployed,” says Goel. “So essentially, there would be a substantial part of infrastructure on the client side that we would need to manage. We preferred Cortex because people could simply push their metrics to us, and we would have all the metrics in a single place.”
Where Cortex has really helped us is to integrate the monitoring system with our existing tools. We have a lot of internal tooling, and in certain places, we needed really tight integrations with the monitoring system.
Ankit Goel, Product Engineer, Gojek
The implementation
The implementation started in January 2019. The team developed a few tools: a simple service for token-based authentication, and another for storing team information, such as notification channels and PagerDuty policies. Once all this was done, they leveraged InfluxData Telegraf’s remote_write plugin to write to Cortex. This allowed them to have all the metrics being sent to InfluxDB to be sent to Cortex as well. “So moving from InfluxDB to tenants would not be that complicated. Because Cortex was multi-tenant, we could directly map each of our InfluxDB servers to our tenants,” says Goel. They’ve developed an internal helm chart to deploy and manage Cortex. After the customizations were completed in about two months, “we had our setup up and running, and we onboarded one team on Cortex,” he says.
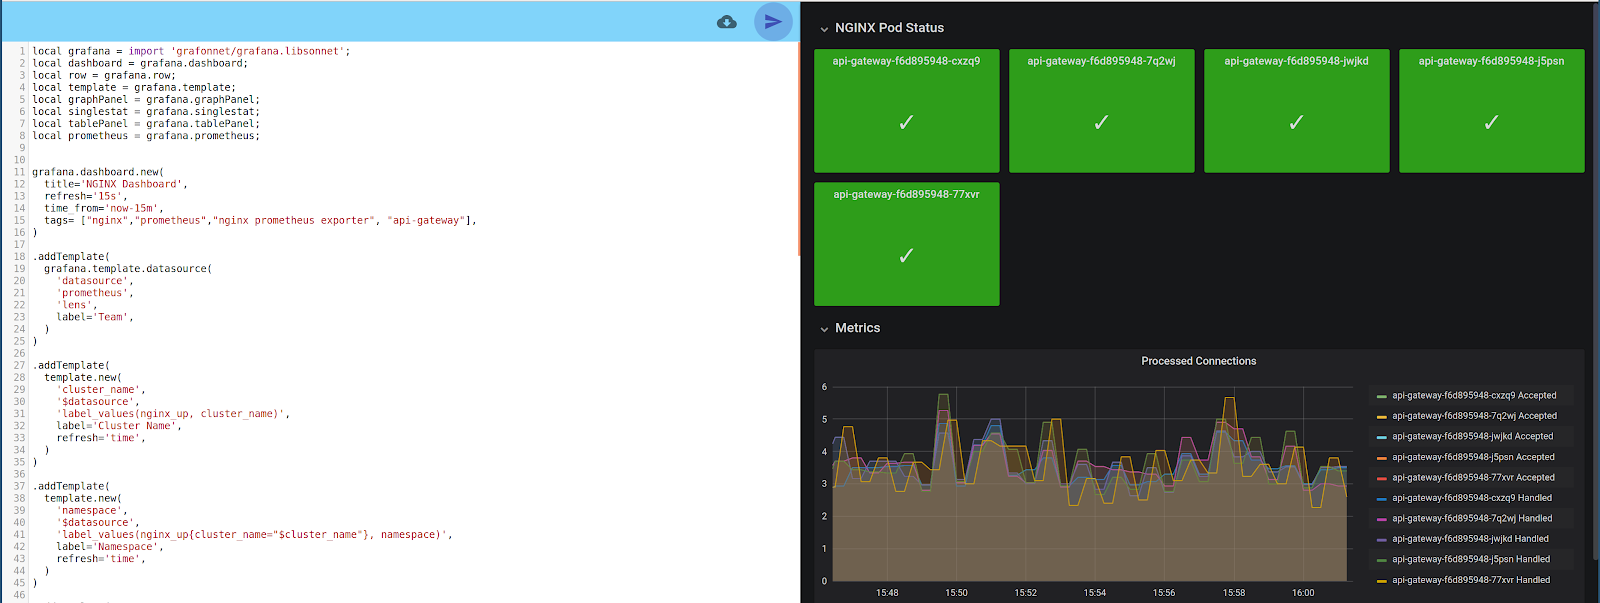
In the initial version, GitOps was the only interface for developers to apply alerts and create dashboards. The team built tools like grafonnet-playground to make it easy for developers to create dashboards. Developers are also allowed to create dashboards using the UI, since Grafana maintains version history for dashboards.

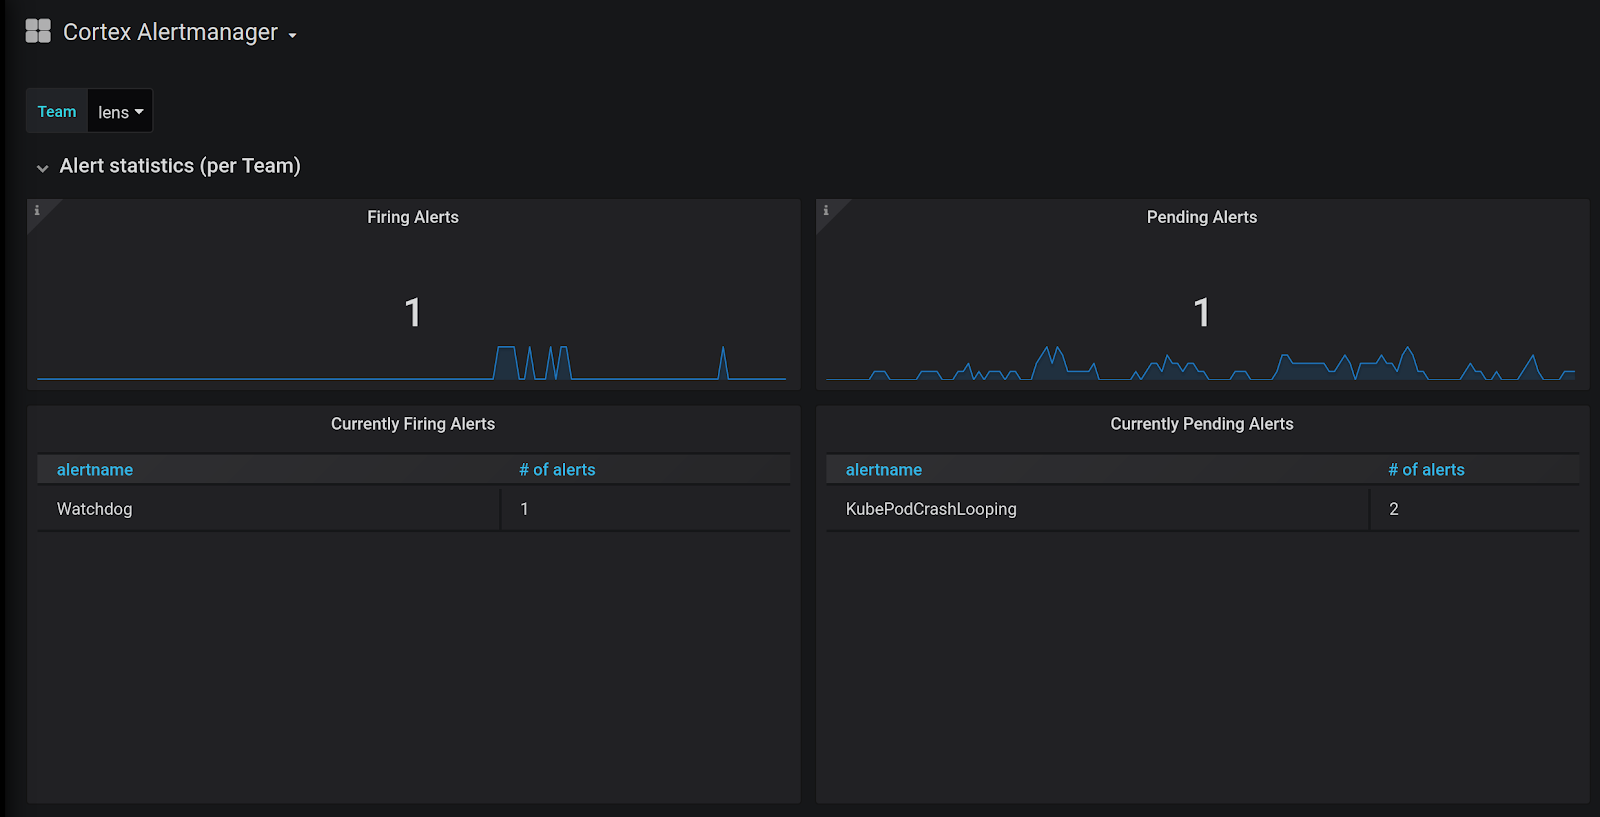
“We needed metrics like ‘the number of alerts triggered for each team,’ ‘how long did it take to resolve these alerts,’ ‘how many were actionable and how many were ignored,’ etc.,” says Goel. “For measuring these metrics, the team only had to create a simple dashboard, since the ruler component exposes the per-tenant alert metrics. Both business and developers have found these metrics to be very useful.”

The team built a CLI tool to improve user experience for applying alerts without having to dig into PromQL. “You can write a command and say lens attach alert, and you tell it what kind of alert you want to attach, such as a CPU alert or Postgres alerts, and then you give it a service name,” says Goel. “There are some challenges to this approach for applying alerts, but we would like to move to such a model in the future.”
One of the challenges the team faces is developer education. But “we always knew if we are going to move to either Thanos or Cortex, developers would have to learn PromQL,” Goel says. The monitoring team paired with developers to help them understand PromQL and migrate their graphs and alerts.
The monitoring team has faced issues with Cortex from time to time, but “we always reached out to the Cortex community with our issues through the Cortex slack channel,” says Goel, and “active members of the Cortex community have always helped us with our problems.” Today, Gojek’s Lens monitoring system has 40+ tenants, for which Cortex handles about 1.2 million samples per second. Adoption is growing organically by word of mouth. Gojek is currently migrating to Kubernetes, and the teams that moved to Kubernetes have found Prometheus to be a better fit than InfluxDB. Seeing that success, other teams on Kubernetes have onboarded themselves to Lens.

Ultimately, Goel says, “where Cortex has really helped us is to integrate the monitoring system with our existing tools. We have a lot of internal tooling, and in certain places, we needed really tight integrations with the monitoring system. So the goal is to make sure that whenever a new service or team is created, they automatically get onboarded to the monitoring platform. After developers deploy, some of their system metrics and all the other standard metrics that are available for a service are automatically sent to the platform.” The team plans to spend the next six months bringing everyone over to Lens.
Looking ahead, Goel and his team have the long-term vision of growing from a monitoring team to a full-fledged observability team. “We also want to take care of logging and tracing in Gojek,” he says. “Loki would be easy to fit with Cortex, so in the future we want to explore Loki for logging.”
Originally published at: https://cortexmetrics.io/


