How Dapper Labs uses Grafana Cloud to meet the global demand of NFT-mania
In March 2021, a JPEG created by the digital artist Beeple sold for more than $69 million dollars at Christie’s. The sale started a worldwide obsession with NFTs — or non-fungible tokens — that represent digital collectibles, art, and media. Amid all the headlines, the blockchain gaming studio Dapper Labs came to the forefront.
Launched in 2017 by the venture studio Axiom Zen, Dapper Labs leverages blockchain to build addictive games, verify authentic digital collectibles, and run fan tokens for sports personalities and music artists. The company’s first product, CryptoKitties, is a wildly popular blockchain game that allows players to breed, exchange, and collect virtual cats, and it’s often credited as one of the earliest forays in deploying blockchain technology for NFT-related recreation.
More recently, the blockchain-based start-up launched NBA Top Shot, a digital trading card system that has roughly 19 million transactions and has generated more than $230 million in the sales of NBA game highlights.
Amid the growing fervor around what has been dubbed “NFT Mania,” Dapper Labs has had to hyperscale to meet the global demand for crypto collectibles. That’s where Andrew Burian, principal SRE and engineering manager for the IT, security, and SRE teams at Dapper Labs, comes in.
“The SRE mantra is simple: You don’t have the ability to do anything if you don’t have observability down first,” says Burian.
To that end, Burian and his team built an observability stack for Dapper Labs that includes Grafana Cloud, PagerDuty, Prometheus, Kubernetes, and Google Cloud Platform as its core monitoring tools.
They also provide developers with a suite of out-of-the-box alerts so that as teams write applications, they can also implement shift-left observability and start exporting their metrics to Grafana and monitoring their work right away. “It’s up to devs to define how they want to leverage their alerts and make sure their application stays up,” explains Burian. “We just provide them with the tools, the guidance, and the expertise to do it right.”
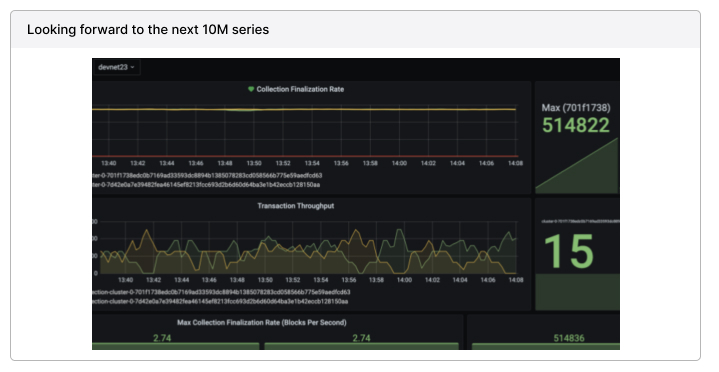
That’s no small task. To date, the Dapper Labs SRE team monitors more than 4 million active series, which translates to roughly 12 million data points per minute. With Grafana Loki for logs (that’s up to 2TB of logs per day) and Grafana Tempo for traces, Dapper Labs funnels all of its observability data through Grafana Cloud.

“I have high-level Grafana dashboards that gather all of our disparate systems into one pane of glass because it’s the SRE’s job to have a pulse on the health of the system,” says Burian.
To do so, over the years Dapper Labs quickly evolved from using Grafana OSS to Grafana Cloud for its application and systems monitoring. As a result, Burian adds, “Grafana is heavily used in all facets of the company.”
We do pretty much everything through Prometheus, so for long-term storage, dashboards, and alerting we send all of that to Grafana. Grafana Cloud sits on it and allows us to make the data available so that any product team can dashboard and alert off of the information whenever and wherever they want.
Andrew Burian, Principal SRE and Engineering manager for the IT, security, and SRE teams, Dapper Labs
Graduating to Grafana Cloud
Dapper Labs started its monitoring journey by running its own Prometheus instance as the data store and layering Grafana on top as the open source visualization layer.
“I tend to favor open source projects because I like to know what the product is doing and where,” says Burian. “Also, if I get sufficiently frustrated, I can submit changes.”
Within six to eight months of using Grafana, however, data retention quickly became an issue.
“To spend time carefully managing where the storage goes, what our retention period is, and to make sure that the Prometheus node is beefy enough that we can actually do queries across the last six months of data … It was all a headache,” says Burian.
To eliminate the operational burden on his team, Burian chose Grafana to run the visualization as well as deal with data warehousing. “The fewer things I have to run, the better,” he says.
Since the team had already been a Grafana Cloud customer for metrics, migrating from open source to Grafana Cloud for dashboarding was a natural move when Dapper Labs upgraded its product in 2020.
“For v2, we put the new dashboards on Grafana Cloud,” says Burian. “We slowly deprecated the self-hosted ones. We still have a few old alerts and dashboards on our self-hosted Grafana instance because deprecations of consumer-facing products take forever.”
As Dapper Labs continued to scale, “our agreement with Grafana Cloud progressively added more and more of the Grafana Stack into production,” says Burian, who had considered other monitoring options in the market, but “they’ve all gone by the wayside.” Especially since their price tags were “ludicrous,” charging three to four times more when compared to Grafana Labs’ offering.
Even as their products experienced a 100-fold increase in users, a 1,000x increase in traffic, and their metrics ballooned from 200,000 to almost 4,000,000 active series, “I’ve always thought the price scaled fairly with our usage” on Grafana Cloud, says Burian.
His team also benefits from the time savings that come with Grafana. With only six people in the observability pod supporting an engineering organization of 100 total around Dapper Labs, Grafana Cloud allows Burian’s team to focus on bigger projects without having to worry about maintaining and upgrading every few months.
Says Burian: “Anything that requires babysitting is a lost opportunity cost for us.”
Proactive problem solving
When Burian and his team first started down the path of observability, “the data was hard to instrument, we had one APM stat and some CPU usage, and people just didn’t care.” says Burian. “We’d get performance issue reports from customers long before monitoring caught anything.”
Since Dapper Labs implemented its observability stack in 2019, “we’re at the point where our instrumentation is so good that we catch outages on Google Cloud before Google Cloud has publicly reported them,” says Burian.
When an issue arises, Grafana picks up the incident and sends it to PagerDuty which sends the developers an alert. Then the devs tap into Grafana to see what triggered the alert, using the Grafana learning engine to assess the metrics.
Typically, the devs know what they’re looking for and find it pretty quick. We can probably debug 80 percent of an issue with just metrics. Then the last bit they dive into either logs or our error-reporting tooling for specifics. But quite often, if it’s an issue with scaling, that can be debugged with one or two Grafana dashboards.
Andrew Burian, Principal SRE and Engineering manager for the IT, security, and SRE teams, Dapper Labs
In addition to being more agile in alerting and monitoring, “the empowerment to the teams has been the best single result because that feeds into everything else we do,” says Burian. “There is more productivity and fewer mistakes.”
Open editing season
“Our monitoring and observability platform is one of the first systems internally that we started to think about as its own product being offered to internal customers,” says Burian. “The power of this mindset is that it keeps you thinking about improvement like you would a product.”
Which is why their internal Grafana deployment is continuously shaped by the Dapper community. Within the company, “there are definitely more editors than viewers on our Grafana user list,” says Burian.
The collaborative environment at Dapper Labs encourages more eyeballs — and editing — on products and programs. There are roughly 240 active users in Grafana, including engineers as well as project and product managers who want insight into the data.
“The project management, product management layer, and executive layer are only consuming dashboards, but pretty much every engineer is editing them,” says Burian. “In our company, we really have an open editing culture. The Wiki for all of our products is one giant collaborative editing environment. There’s no real access control. I give everyone global editor access. If you want to tweak a dashboard or you want something from there, you can just jump in and do it.”
The low-activation threshold means there’s an open invitation to contribute to the monitoring work. “Most people are very enthusiastic, and I have not built any controls to stop them from sending as many metrics as their heart wants to Grafana, so they’ve taken advantage of that,” says Burian.
Even new hires tend to make meaningful contributions to the monitoring setup within their first two or three months.
It helps that “Grafana is visually appealing from the get-go,” says Burian. “It’s hard to make a dashboard that looks terrible.” As a result, Burian says that the Grafana dashboards drive usage because “more people look at things that look nice.”
The vast majority of the company’s dashboards are engineering-focused, with only a handful dedicated to high-level summaries of the company’s platforms. Recently, the team also started to formalize SLOs and SLIs into dashboards to track the company’s goals and progress throughout the year.
“That is gaining some traction with product managers and at the executive level,” says Burian. “The goal is to have one SLO and a dashboard that describes the SLO with supporting data you need to verify when things are going wrong.”

“Things can only get better from here”
In the beginning “the low watermaker when we first plugged in was probably around 30,000 series,” says Burian. “But I basically told them to throw everything at the system to get us where we are now.”
As Dapper Labs scaled, so did the company’s Grafana usage. However, there’s a difference between start-up mode — i.e. “We have to build all the things as fast as you can!” — and figuring out where efficiencies are — i.e. “Let’s talk about our bottom line.” Currently Dapper Labs is going through that transition.
“There’s already some tooling that exists to detect which series are absolutely useless. We’re going to start chopping those out,” says Burian.
What will remain is Burian’s overall vision for observability at Dapper Labs. “Real success is zeroing in on using our tooling and our observability to define really good customer-facing SLOs, make really impactful alerts and monitoring, and get what we need without just drowning ourselves in data,” says Burian.
As the team improves at ad hoc instrumentation, they’ll learn to export more metrics, more efficiently. And in the coming months and years as their monitoring use continues to go up, “we’ll ingest new metrics, more logs from new sources, and we want to lean into our tracing capacity now that we have Grafana Tempo,” says Burian.
“I’ve never been happier with our monitoring situation than we are right now,” adds Burian. “Things can only get better from here.”
To hear more about the observability journey at Dapper Labs, check out Andrew Burian’s complete talk at GrafanCONline 2021.


