Monitoring website performance at Changelog with Grafana Cloud
Gerhard Lazu loves infrastructure, operations, and keeping things running. He’s been known to call exploring and learning about Kubernetes fun. At Changelog, an indie media company with a passion for sharing inspiring content for software developers, he channels some of this enthusiasm into keeping the lights on as a site reliability engineer. And since it’s just a small handful of folks running things behind the scenes at Changelog (lovingly referred to as Team One), that’s quite a job.
Gerhard and the entire team at Changelog are passionately focused on the developers who listen to their podcasts, which include The Changelog, Go Time, JS Party, and Ship It. In July 2021, Gerhard sat down with Grafana VP of Product Tom Wilkie for a Ship It episode about Loki, Tempo, Grafana Cloud, and the evolving definition of observability. It is a conversation that was of particular interest after Grafana became part of the Changelog setup in 2020, when Gerhard was looking for a Kubernetes-native monitoring solution that made it easy to understand the Changelog.com behavior.
Building a Kubernetes-friendly monitoring and logging system
At the time, it was difficult for Team One to get visibility into how the Changelog.com setup was behaving. They wanted to be the first to know when things degraded and quickly identify and address issues before they affected the user experience. With so many visitors to their site downloading podcasts and interacting with content across time zones, monitoring performance and identifying issues in the making was a top priority. In their existing setup, Gerhard would get a Slack message from a team member that something was wrong, then have to sift through Pingdom, Papertrail and Netdata to find out what was going on. With separate systems for synthetic monitoring, logs, and metrics, it could take a few hours to resolve a single issue.
Gerhard had been introduced to Grafana and Prometheus while building some RabbitMQ dashboards several years prior. “Grafana and Prometheus were very easy to get started with,” he recalls. “So even though I knew nothing about these tools . . . it was super easy to start building dashboards.” He especially liked how straightforward Grafana made this process.
Trying to think about what I want my dashboard to say, the story that I wanted it to tell – that was a great approach for me. And Grafana made it easy.
Gerhard Lazu, Changelog
Because it was so easy to start building dashboards, Gerhard quickly ended up with five or six useful dashboards. “You know when you use a phone for the first time and you just know what to do? Grafana was a bit like that,” he says. While these dashboards were helpful, everything became better integrated with the addition of Alex Koutmos’ prom_ex, an Elixir library that made Prometheus metrics and Grafana dashboards first-class in the Changelog.com application. On top of this, kube-prometheus-stack added even more integrations and out-of-the-box dashboards that enabled the team to instantly notice bottlenecks in Block Storage and Kube Proxy. Grafana and Prometheus provided the visibility into the system, and kube-prometheus-stack combined with prom_ex provided the seamless integration. “The big tent philosophy — I like that belief and I like that principle, and that’s what attracts me,” says Gerhard about Grafana. “How well it integrates with all these data sources, that’s a great strength.”

A look at Changelog.com’s PromEx Ecto dashboard
Scaling painlessly with Grafana Cloud
In December 2020, the folks at Changelog were saving quite a bit of time with their Grafana monitoring setup. But since most of Team One improve the Changelog setup in their free time, every second spent managing their monitoring matters. After adding Grafana Loki, Grafana Labs’ open source log aggregation tool, to his monitoring setup, Gerhard was getting better and more robust visibility into the setup at Changelog.com. But it was also getting more time consuming to maintain the monitoring setup. For Changelog to host Grafana, Prometheus, and Grafana Loki themselves would require it to be maintained and upgraded on a regular basis.
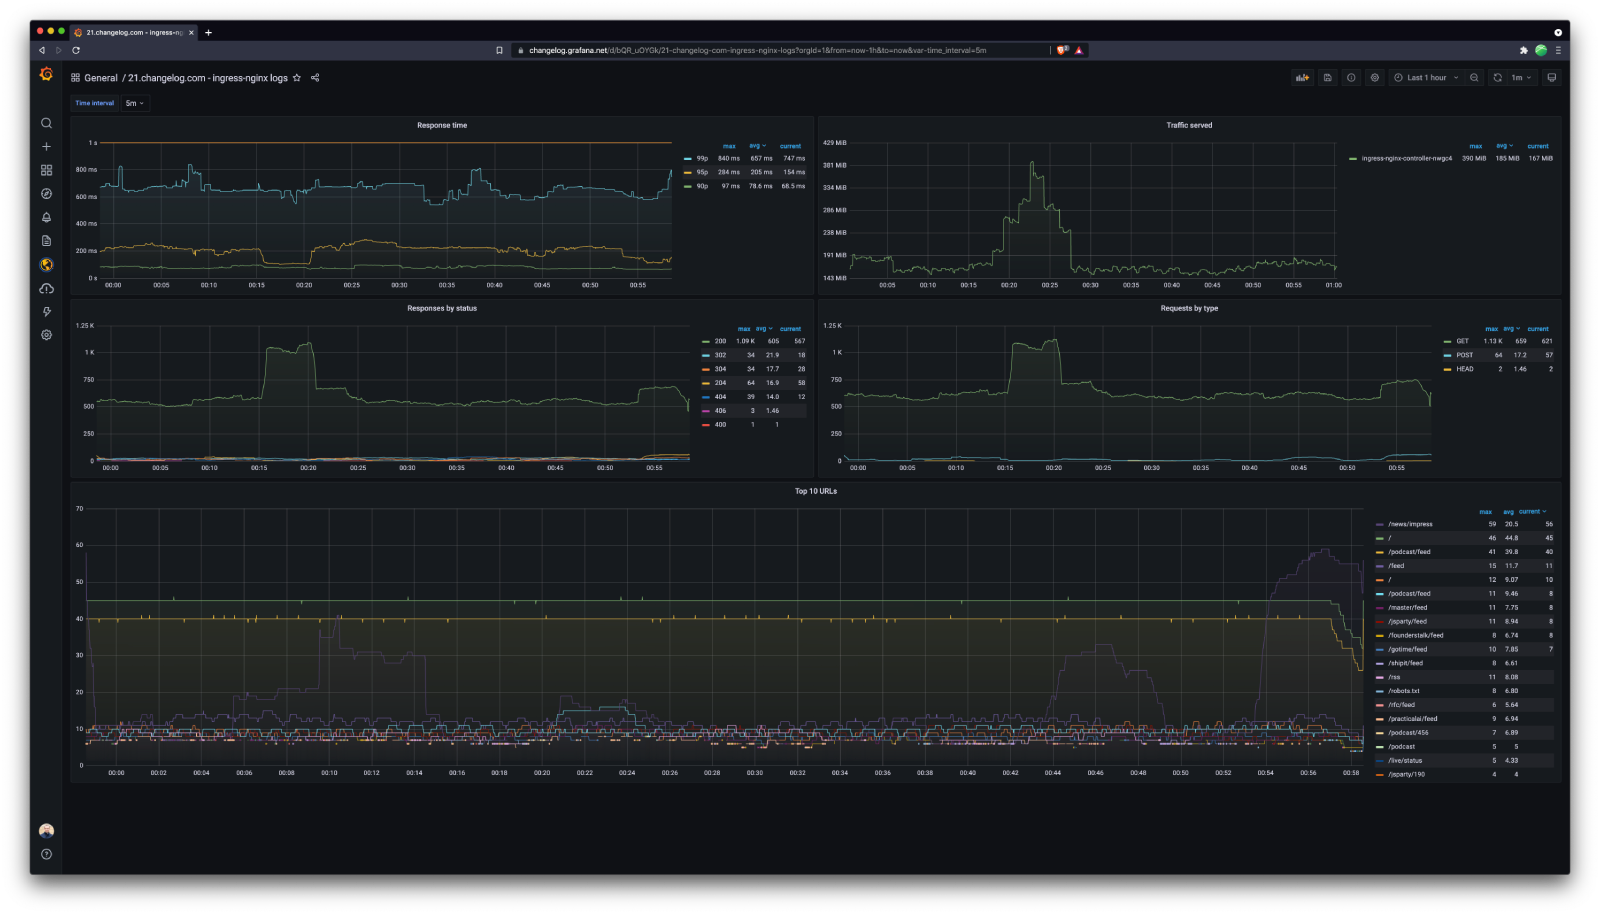
A look at Changelog.com’s NGINX log-based web traffic dashboard
When Grafana rolled out a free forever tier for Grafana Cloud, it was a natural fit for Gerhard and the team. Moving to a managed service meant that Changelog could keep their robust monitoring setup and save time by leaving the upgrades, fixes, and maintenance to Grafana.
It didn’t make sense for us to run it ourselves. Not that it was difficult, but it is much easier to just run the Grafana Agent. That’s all you need. Send everything to Grafana Cloud and it just works.
Gerhard Lazu, Changelog
Enjoying decoupled metrics, synthetic monitoring, and alerting
Gerhard and the team really enjoy the visibility Grafana Cloud gives them into their Changelog.com setup. The website serves many terabytes of data each week, most of it straight from CDN, and Grafana Cloud stores all the metrics. Having their metrics and logging service completely decoupled from other systems gives Gerhard peace of mind. It’s much more dependable because if their origin becomes unavailable, it doesn’t affect the monitoring. “We know the metrics and logs are safe, we can access them anytime, it’s all good,” says Gerhard. Recently, when Changelog improved their Fastly setup so that all requests which can be cached could be stored stale, a Grafana dashboard helped visualize the difference in HTTP response latency. And it was all available to see and share with the entire team in Grafana Cloud.
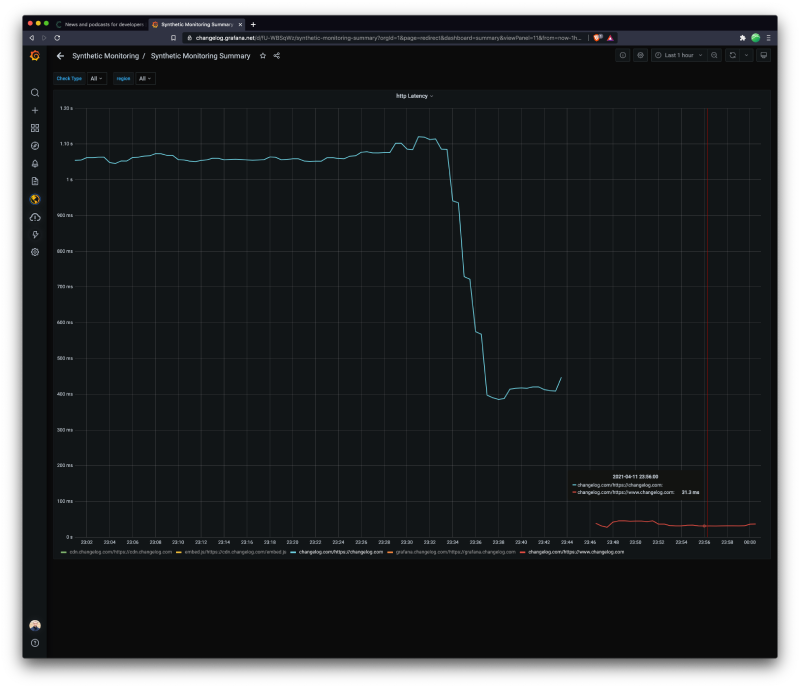
A look at Changelog’s Synthetic Monitoring Summary dashboard
Another huge advantage for the Changelog team is Grafana Cloud’s built-in synthetic monitoring. Synthetic monitoring probes give Gerhard insight into how the Changelog.com setup is behaving from an external point of view. Using probe locations around the world, he can monitor the availability, performance, and correctness of Changelog.com services for users everywhere. Now, incidents that previously took hours to resolve – or were never even detected – take just minutes. For example, a typo that snuck into production recently caused about 19 minutes of back-end downtime. Grafana Cloud sent an alert to Gerhard within seconds via Telegram. Ten minutes after receiving the alert from Grafana Cloud, Gerhard had zeroed in on the issue and corrected it. Overall, he’s seen a MTTR reduction of about 3x, says Gerhard.
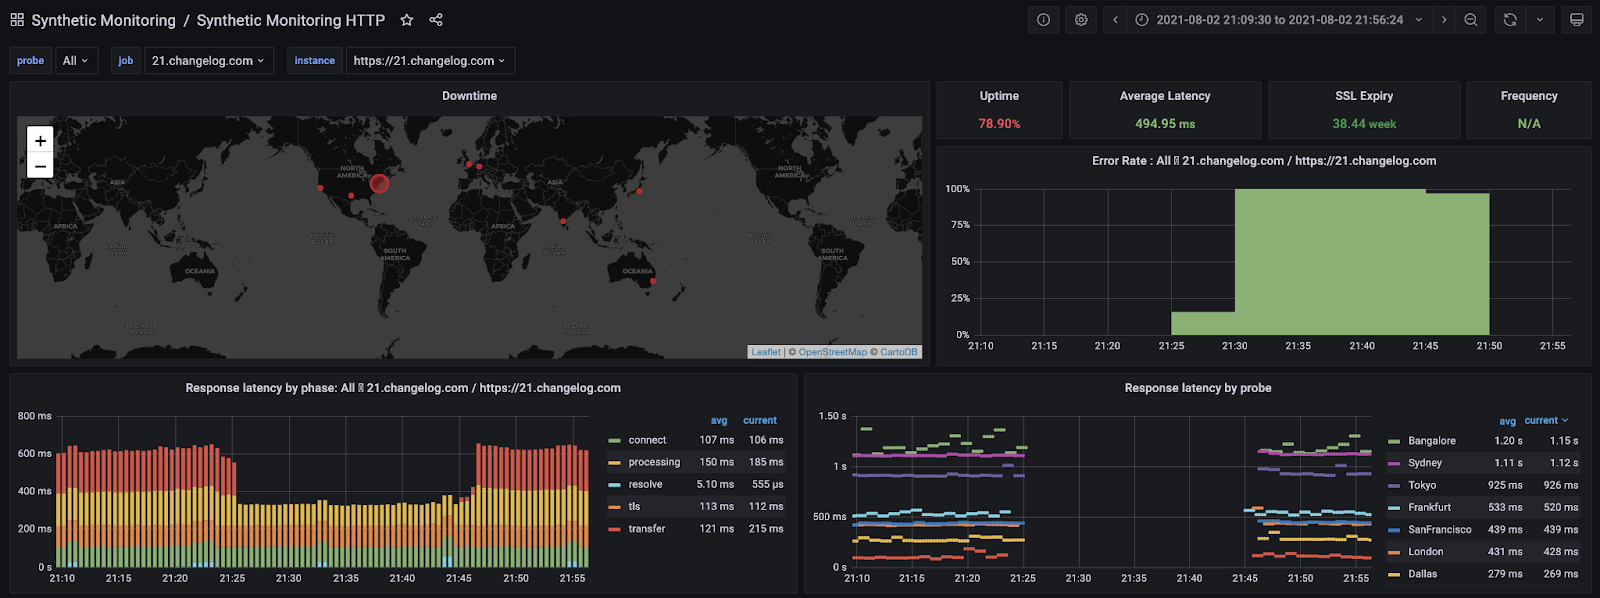
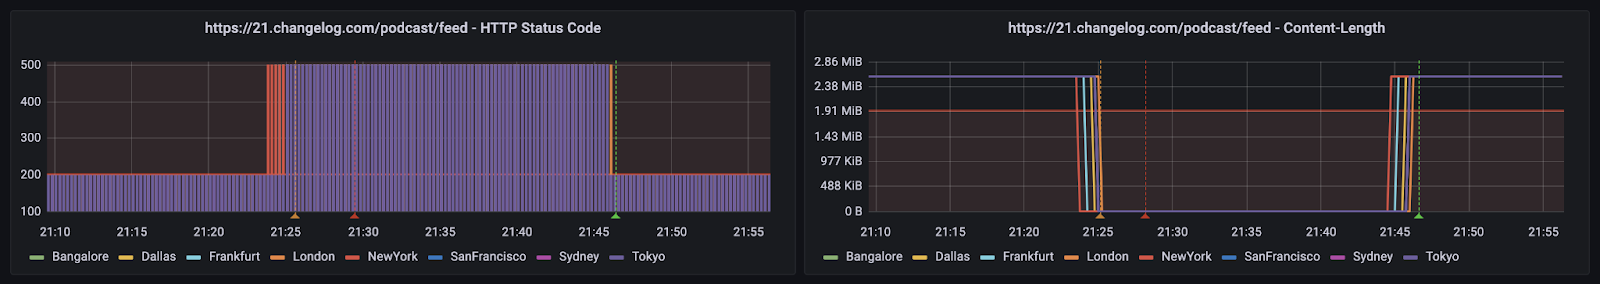
A look at Changelog’s Origin Synthetic Monitoring HTTP dashboards
And with Grafana Cloud, instead of running his own monitors and spreading them out across the entire world, it’s all taken care of. “Even when Grafana Cloud’s synthetic probes fail or degrade, they get restored with no intervention on our part. That means one less thing for us to worry about,” says Gerhard.
He also really appreciates the robust alerting features that Grafana Cloud brings to the table. By integrating Changelog.com alerts with Grafana and Telegram, the team has one more alerting channel. “Sometimes we can get alert overload, but we always know when there’s a problem,” says Gerhard. They’ve built in redundancies to make sure they know as soon as there’s an issue with the Changelog.com infrastructure. The team gets multiple notifications, which provides confirmation. “I just like my redundancies,” he says. Because when something goes wrong, you need something dependable. And with Grafana Cloud, he knows the entire Grafana team is there, backing him up every step of the way.

A look at Changelog.com’s Alerts dashboard
These days, Gerhard and the Changelog team are running their monitoring ecosystem on Grafana Cloud Pro. Gerhard no longer stresses about costs, upgrades, or when things go wrong. Changelog’s Kubernetes footprint is smaller, and they don’t have to worry about migrating data when they upgrade their setup every year. “Grafana Agent is the only integration that we have to worry about, and that’s great,” says Gerhard. He also estimates that the team now has about 10% extra maintenance budget to spend on other things.
Planning the road ahead for Changelog.com
Now that Gerhard spends less time maintaining the monitoring and logging setup, he is able to think about Changelog’s infrastructure setup in a whole new way. Because the metrics and logs are handled in Grafana Cloud, they are decoupled from the primary IaaS, and the team can take bolder steps and focus more on what’s important, like moving to a multi-cloud setup.
We are not tied to our IaaS for monitoring. We can experiment and that’s a huge advantage.
Gerhard Lazu, Changelog
Migrating to Grafana Cloud has made things more flexible and accessible and a lot of hard stuff simpler, says Gerhard. So what’s next for the team? Tracking service-level objectives for Changelog.com with slok/sloth, and finally start looking into tracing. And with Grafana Cloud, he’ll probably have a lot of fun doing it.