Reducing MTTR with Grafana Cloud: Inside ASOS’ observability stack
Online fashion and beauty retailer ASOS has over 23 million active global customers — some may be searching for that perfect pair of shoes for a destination wedding, others for that must-have vintage dress. But regardless of what’s on their shopping list, all ASOS customers are looking for, and expecting, a seamless online retail experience.
To deliver on that experience time and time again, the ASOS engineering team relies on Grafana Cloud for real-time observability.
“We are definitely able to react to incidents as and when they happen,” said Dylan Morley, Lead Principal Engineer at ASOS. “There are alerts set up for many of our customer-facing journeys — meaning, the common journeys that customers will perform on our website. If any of those journeys aren’t working as expected, our first-line support and platform teams who are responsible for the software that powers those, they all get alerts. We know pretty instantly as soon as something starts going wrong.”
What’s more, Grafana Cloud enables the ASOS SRE team to gain the kind of end-to-end visibility they need across a complex, microservices-based environment.
“Being based on microservices, we had some observability gaps at the beginning of the year, and we aimed to close those gaps where one system hands off to another,” said Fahri Ulucay, Site Reliability Engineer at ASOS. With Grafana Cloud, “that’s one thing that our team has been able to bring to the table — an overarching view of the flow of orders and information throughout all the different systems.”
Today, roughly 800 ASOS engineers use Grafana dashboards. In addition to reducing their MTTR, Grafana Cloud has helped ASOS advance its observability strategy in a number of ways — from saving time with ready-to-use Kubernetes Monitoring dashboards to cutting costs with Grafana Cloud Metrics.
But to fully grasp the benefits ASOS has seen from Grafana Cloud — and expects to see moving forward — it’s helpful to understand where they came from.
Why ASOS moved from Grafana OSS to Grafana Cloud
After a migration from an on-premises Windows environment to Microsoft Azure in 2015, the ASOS engineering team ran into some challenges with observability at scale.
They were storing their logs and metrics in Azure storage accounts, and using multiple open source tools to aggregate that data and achieve a centralized view of their environment. But when the team would try to respond to incidents on the site, they were bogged down by latency, Morley explained.
“The problem manifested itself at times when we were trying to observe busy periods — when a lot of people would be running queries over the system, you’d start to see that system slow down,” he said. “As we scaled out and produced more telemetry, we were starting to see longer end-to-end latency of the data being ingested so it could be queried.”
To address this challenge, and get the near real-time observability they were looking for, the team turned to Grafana OSS in 2017. They chose Grafana, for starters, because ASOS’ performance testing team already used it for data visualization. More importantly, it helped that Grafana supports such a wide range of data sources — including one, notably, for Azure Monitor, which enabled the engineering team to take all the telemetry data they had in Azure and visualize it in Grafana.

Azure Service Bus template dashboard utilizes Azure Monitor metrics, enabling consolidated viewing of data from all Service Bus instances.
“At that point, Grafana started to become much more used across the business,” Morley said. “People started adopting it as their primary dashboarding solution for displaying telemetry.”
Beyond the visualizations, Grafana OSS also helped improve latency issues. Before Grafana, it could take as long as 10 to 15 minutes for the team to access the metrics they would need to troubleshoot an issue. With Grafana, the team was able to take advantage of the improved ingestion pipelines and built-in telemetry features of Azure, and strategically implement a one-minute target for end-to-end latency.
Given the benefits of Grafana OSS, ASOS’ adoption of the platform grew quickly. They were running Grafana across multiple geographic regions to achieve geo-resilience, and were managing their own large-scale Graphite instance. As adoption grew, the engineering team reached a point where they wanted to continue tapping into the value of Grafana, without the overhead of updating and maintaining it — particularly the time series data store. So, in January 2022, they decided to migrate to Grafana Cloud.
“[Grafana Cloud] meant that we could focus on the observability — getting the best out of the platform — without running it,” Morley said.
Access to Grafana Enterprise plugins was another key benefit of ASOS’ move from Grafana OSS to Grafana Cloud.
“When we were running Grafana ourselves, we needed to query New Relic and ServiceNow, so we built some in-house versions of plugins — but all that came with the overhead of maintenance,” Morley said. “One of the benefits of the Enterprise plugins was that we could deprecate [our existing plugins], just take advantage of the Grafana Cloud offering, and have less code that we need to own and maintain.”
How Grafana Cloud helps ASOS reduce MTTR, cut costs, and more
With its shift to Grafana Cloud, the ASOS engineering team knows they’ll have the real-time insights they need, at the scale that they need.
One way the team has especially benefited is from its use of Grafana Cloud Metrics — the fully managed, highly scalable metrics service in Grafana Cloud, powered by Grafana Mimir — as a Prometheus data store.
Before implementing Grafana Cloud Metrics, the team was using Azure Container Insights for AKS to collect Prometheus metrics and store them in Azure Log Analytics. But they noticed that, when they were putting a lot of queries through to their Azure Monitor and New Relic data sources from Grafana, they’d sometimes hit rate limits, which would cause timeout errors in their dashboards. So, the team pivoted, and started sending Prometheus metrics to Grafana Cloud Metrics instead.
Meanwhile, they also started to pre-aggregate commonly accessed data points, turning millions of records into a few Prometheus series. Combined, these efforts significantly mitigated that risk of timeouts and reduced the team’s MTTR.
“For all of the support teams — the major incidents team and the application support teams — we’ve had less angst over the last year,” said Adam Watson, Lead Site Reliability Engineer at ASOS. “I think a lot of that is just understanding our services a bit better, having the telemetry more readily available, and being able to get to the correct team quickly.”
In addition to maintaining uptime, Grafana Cloud Metrics has helped the team cut costs.
“It’s cheaper to store this data in a Prometheus format,” Morley said. “So by offsetting some logs to metrics and moving that data into Grafana Cloud Metrics, we were able to save a significant amount of money.”
Kubernetes Monitoring in Grafana Cloud has been another invaluable service for ASOS. In particular, the out-of-the-box visualizations and preconfigured dashboards have enabled the team to more quickly analyze data and gain insights into the health of their roughly 123 Kubernetes clusters running in Azure Kubernetes Service. It has also helped centralize and unify the company’s observability efforts related to Kubernetes; prior to adoption, teams were manually building their own dashboards to monitor their clusters in silos.
“Now we’ve got a central dashboard that will monitor anyone’s cluster with a templated solution — and that works brilliantly,” Morley said.
Meanwhile, the wide range of supported data sources in Grafana continues to underpin the company’s overall observability strategy. Using data sources for New Relic, Prometheus, Azure Monitor, Azure Data Explorer, and other integral systems has opened up a world of possibilities at ASOS when it comes to data visualization.
“That ability to have a visualization that consumes telemetry from multiple data sources — that’s a very strong feature,” Morley said. “Whatever data source we want, we can do a visualization over it.”
Looking ahead: Grafana SLO
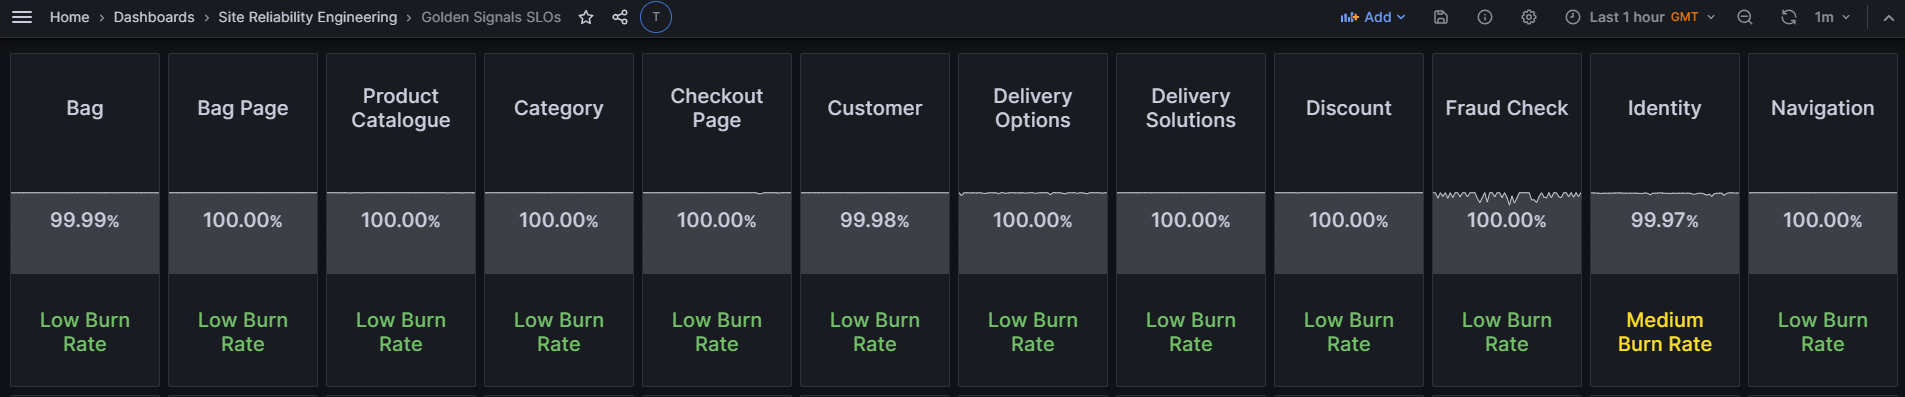
SLOs at a glance: Our RAG dashboard condenses Grafana SLO data, providing a clear overview of estate health and error budget status.
As for what’s next for ASOS and its observability journey, the team is starting to leverage Grafana SLO — the Grafana Cloud application that helps engineering teams quickly set up service level objectives. The goal, ultimately, is to use two components of the Grafana SLO framework — SLOs and SLIs — to create an alerting system that is based heavily around error budgets.
“We want to use some of the burn rate alerts through Grafana SLO and put them up on a big board so everyone can see them,” Watson said.
“We also want to cut through the alert fatigue that can be caused by trying to monitor too many signals," Morley added. “Shifting over to an SLI- and error budget-approach is something that’s going to be really beneficial to our team.”
With Grafana SLO in place, the ASOS team hopes to focus on what matters most: reliability and providing a positive user experience.
“We are always about making the process as good as it can be,” said Morley. “Our team is there to really have that voice and help build the best possible products.”