Tracking renewable energy across 22,000 sites with Grafana Enterprise: Inside Agregio’s observability stack
DevOps and SRE teams everywhere use Grafana to visualize data from distributed infrastructure and applications. In the suburbs outside Paris, Agregio also uses Grafana to monitor distributed systems — just not the kind you’d expect.
Agregio is a subsidiary of Électricité de France S.A., or EDF, which is a multinational electric utility company largely owned by the French government. Agregio aggregates renewable energy from more than 22,000 sites in France and sells it back to the electrical grid. The company needs to ensure the outputs from those distributed locations meet expectations, and the business operations teams rely on Grafana to make sure that happens.
Yes, Grafana was designed with IT professionals in mind, but as we’ve seen time and again, people use it in all sorts of unexpected ways. This diversity illustrates the power of Grafana dashboards to get a quick snapshot or to dig deeper on system health. And in the case of Agregio, it’s delivering critical business value for a company trying to benefit from decentralized power capabilities for the grid and combat climate change.
Here’s a snapshot of how Agregio implemented Grafana and how that success has the energy aggregator looking to double down with Grafana Labs.
Why Agregio got started with Grafana
Despite being under the umbrella of the largest energy producer in France, Agregio is essentially an agile startup. Founded in 2017, the company can quickly make changes – be it to the business or the tools they use – as it works to become an integral part of the energy production pipeline in Europe.
One of those changes came when CTO Sony Tricoire joined the company a little over a year ago. The IT teams had been building custom graphs so the business operations teams at Agregio could follow the amount of electricity being produced by Agregio’s customers. However, the process was cumbersome and time consuming, and Sony Tricoire, who used Grafana with an InfluxDB backend to monitor IT assets at a previous company, saw an opportunity to quickly put it to use at Agregio.
“Instead of spending so much time building those graphs, I proposed to move to an already baked solution — Grafana,” Sony Tricoire says.
From Grafana OSS to Grafana Enterprise: Why Agregio made the jump
Agregio works with a number of different stakeholders. First and foremost, they partner with renewable energy producers, whether they’re homeowners with a few solar panels on their roofs or companies with fleets of wind turbines. They also help energy consumers lower their bills and assist asset managers trying to maximize the value of already-produced energy currently held in batteries and cold storage. Agregio uses its expertise in the energy markets and regulatory systems to help producers secure long-term supply contracts and to help consumers reduce their dependence on fossil fuels. Collectively, Agregio’s 22,000 sites can produce enough electricity to match the output of six nuclear reactors.
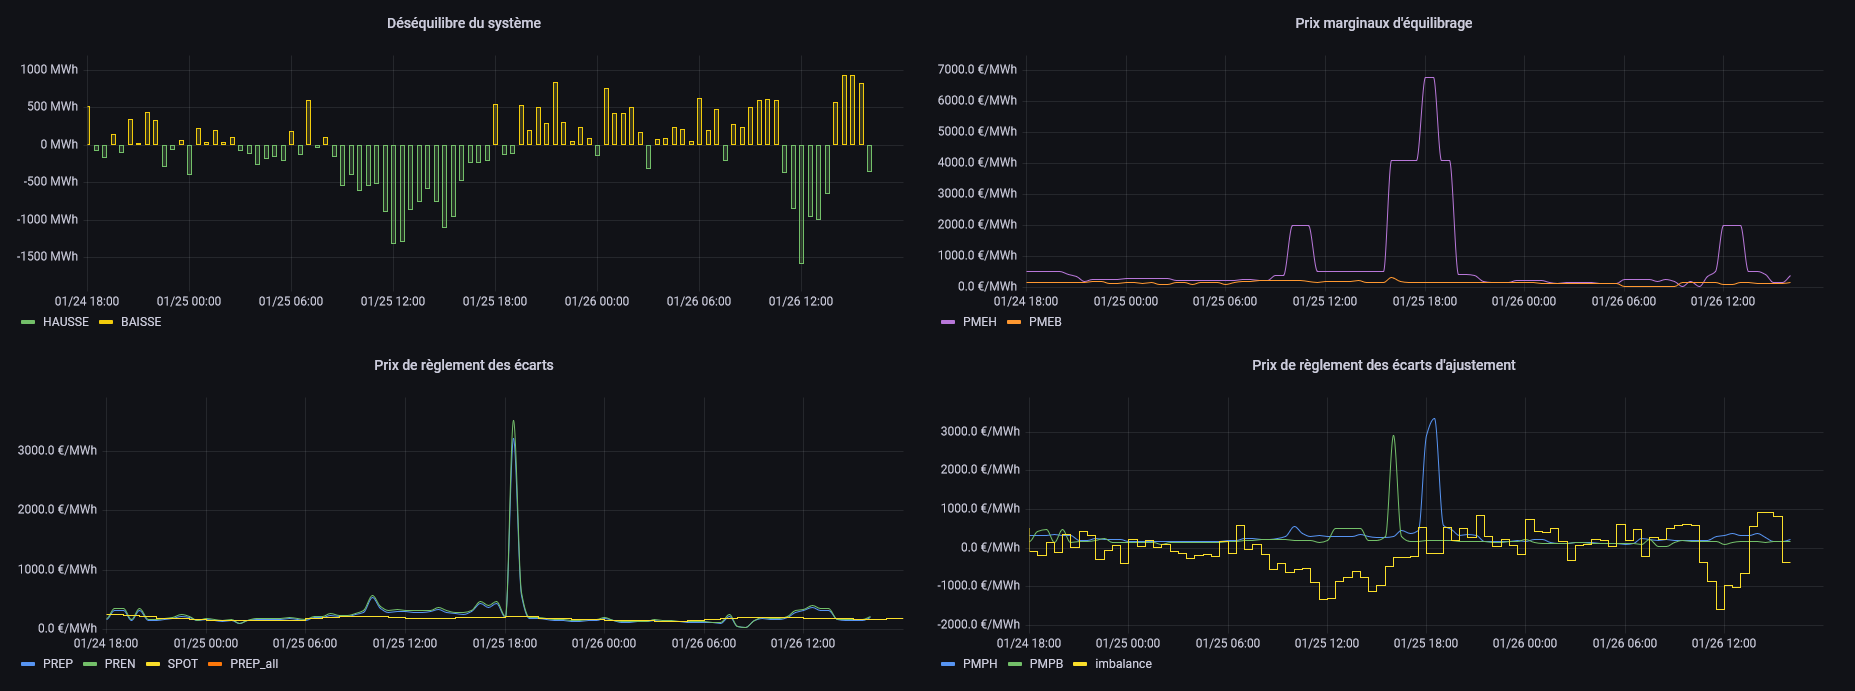
Agregio dashboard highlighting French national grid balancing and prices
The Agregio team is made up of experts in the energy markets, the regulatory system and renewable energy management, as well as in forecasting and optimisation methods and algorithms.
“We are working on decentralizing the production of energy from big assets like gas or coal power plants to more disparate, renewable producers,” Sony Tricoire says. “And then with decentralization comes the complexity of aligning everyone to meet the demand of the consumers.”
Sony Tricoire had experience with monitoring and graphing tools, but “if you look at tools like Datadog, they are fully focused on IT audiences,” he says. “I wanted to be sure the tool we used could be used for non-IT purposes as well.”
He knew Grafana fit the bill for ease of use, and he appreciated its ability to work with multiple data sources. As a proof-of-concept, “we started with an OSS instance of Grafana and plugged it to our PostgreSQL databases. We built two or three graphs and showed them to the business side, and they loved it,” Sony Tricoire says. “They loved the simplicity of making the appropriate graphs that were needed for the jobs.”
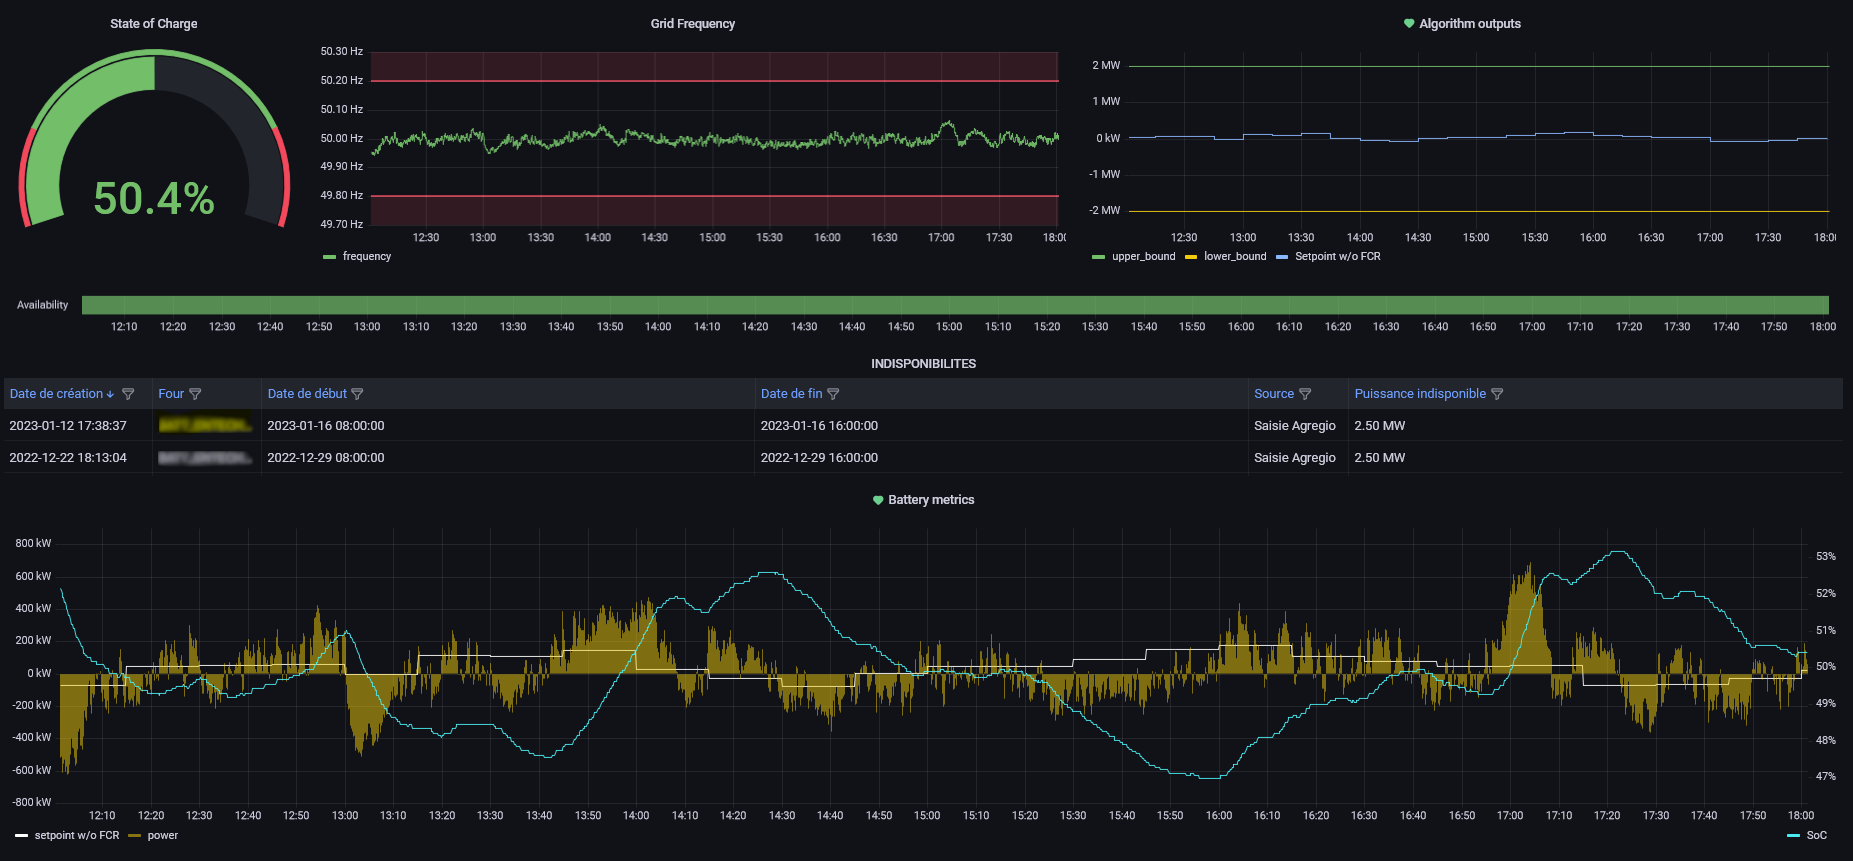
Agregio dashboard showcasing battery control for valuation on Frequency Containment Reserve
And since Agregio acts as an intermediary for the production and consumption of renewable energy, its 12-person operations teams and several other internal stakeholders appreciate the benefits of Grafana Alerting. They use the tool to set certain thresholds that trigger alerts, which enables them to take timely action. For example, if their power output doesn’t match expectations, there is a potential financial impact on Agregio. By being able to act quickly, they can implement countermeasures to reduce the potential financial impact. They notice an imbalance in their energy resources. They also like how the Grafana graphs can easily be shared amongst their team and executives, and that they’re dynamic so the data can be manipulated to answer questions on the fly as the real-time events affect the supply and demand of energy.
With Grafana, we can easily compare multiple dashboards being generated from multiple data sources all in one central place. This gives us the freedom to visualize more things than we could before, which means we have the peace of mind that when we are faced with critical business decisions, we have every data point we need to make them right in front of us.
Sony Tricoire, CTO, Agregio
And while Agregio started out with Grafana OSS, the company soon moved to Grafana Enterprise for the added support for SSO authentication.
“In the energy sector, we are at high risk for cyber security attacks, and we need high-hand security policies to access our tools,” Sony Tricoire says. “Even if Grafana is read-only, we don’t want to take any risks, and the native security and access controls in Grafana Enterprise help us address those concerns.”

Using Grafana to monitor multiple assets to reach the commitment
How Agregio plans to expand its Grafana Enterprise Stack
Looking ahead, the IT team is evaluating more ways to help business operations with Grafana, including tracking usage and supply patterns over time so they can adjust for seasonality and being able to detect production problems faster. This will help them better predict future output, so they can more competitively align their offers on the market based on what they’re seeing in their data, including analyzing slopes and gradients rather than just discrete values.
The most important thing is that our operational teams are able to get a lot more information and efficiency from Grafana than what we provided before.
Sony Tricoire, CTO, Agregio
The team has been so pleased with how Grafana helps on the business side that they’re now looking to adopt it on the IT side as well. They currently use Amazon CloudWatch and AWS X-Ray for their AWS environment, but they’re considering Grafana as a replacement.
“CloudWatch and X-Ray are not developer-friendly at all and do not help the teams to get engaged and own the behavior of their code and infrastructure on a daily basis,” he says. “It’s difficult for them to do the operational management without the appropriate tools.”
To move to a more agile, CI/CD approach, they’re looking at the Grafana Enterprise Stack to help them succeed in that shift.
What we expect to do with Grafana for IT is to provide our development teams the appropriate view on how their code and our infrastructure behaved — every time, every day. This will allow them to be more reactive if we have problems on the IT side of the platform.
Sony Tricoire, CTO, Agregio