Visualization and monitoring integrations
Visualization and monitoring integrations
/
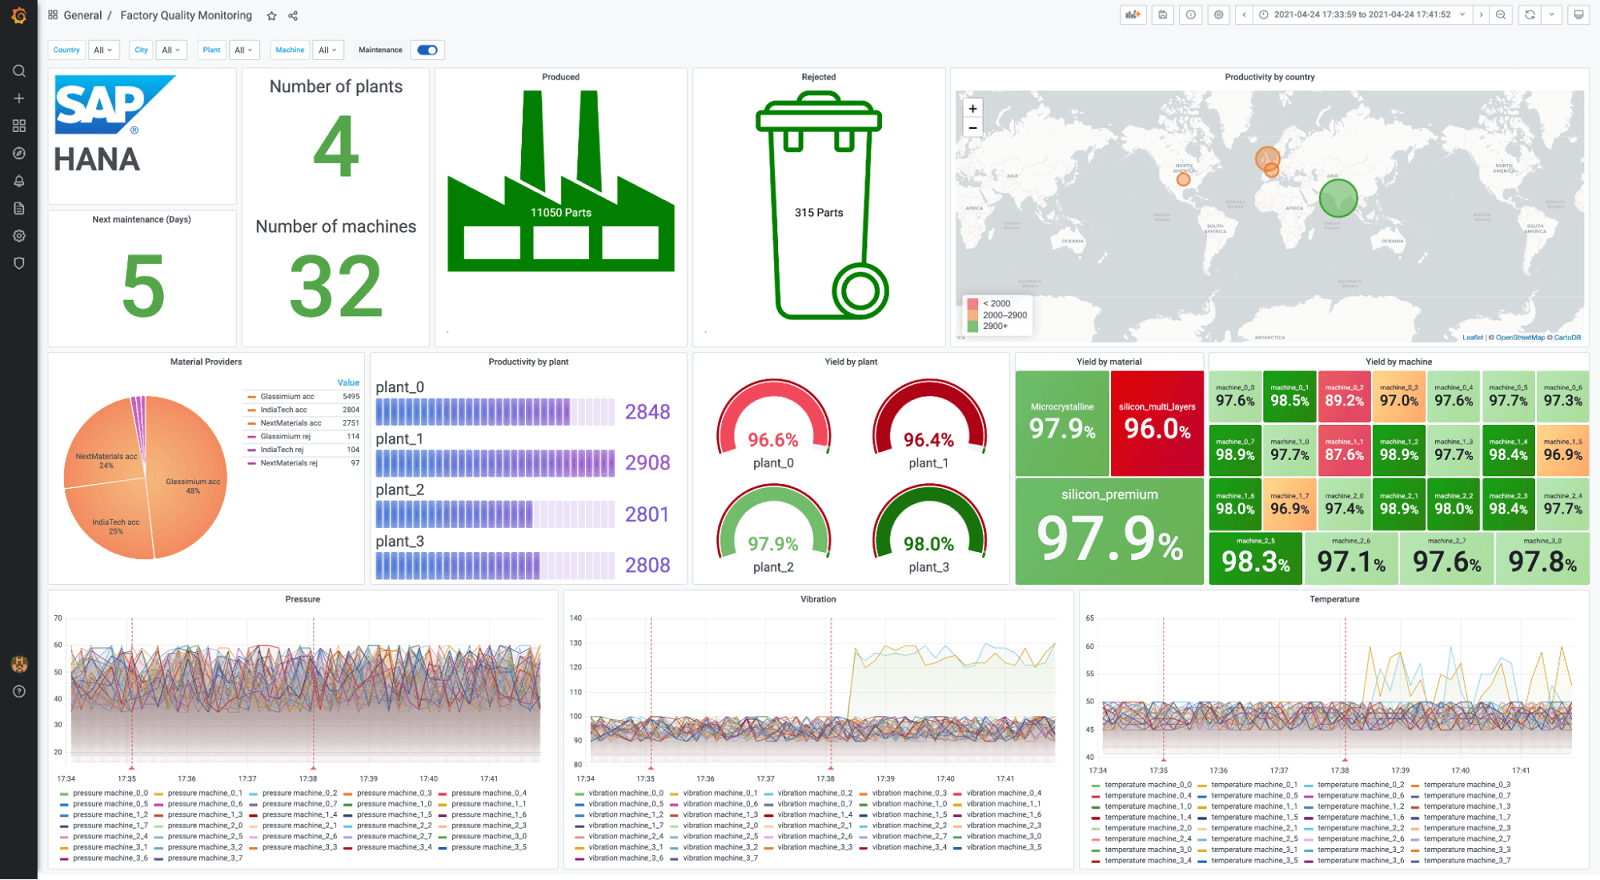
Visualize SAP HANA®
Visualize SAP HANA® easily with Grafana
Quickly visualize your data from SAP HANA®, a high-performance, in-memory database designed for analyzing high-speed transactions, alongside all your other data sources in Grafana, as well as log and metric data in context, with the Grafana plugin for SAP HANA®.