
Kubernetes Monitoring
Visualize and alert on your Kubernetes cluster in minutes, not days.
Why use Kubernetes Monitoring in Grafana Cloud?
Accelerate time to value
Reduce deployment, setup, and troubleshooting time with this ready-to-use monitoring tool that only requires running a few CLI commands or adding some small changes to your Helm chart.
Identify root causes faster
Drill down through your infrastructure with the cluster navigation view to identify and resolve issues, without the hassle of switching between different windows and monitoring tools.
Reduce costs
Efficiency and monitoring visualizations deliver comprehensive insights into your spending, enabling data-driven decisions about resource allocation, scaling strategies, and tech investments.
Opinionated metrics and alerts
Access kube-state-metrics and alerting rules needed to effectively monitor Kubernetes clusters.
- A curated set of metrics to avoid cardinality explosion
- Community-built alerting standards

Cost management
Gain better insight into your Kubernetes costs, spending trends, and potential savings with the cost monitoring feature, which is based on the open source project OpenCost.
- Usage and cost attribution on every component level
- Break down costs and resource allocation across cloud providers
- Visualize cost trends and projected savings
- Organize Kubernetes costs by resource type
- Get savings suggestions based on your resource usage

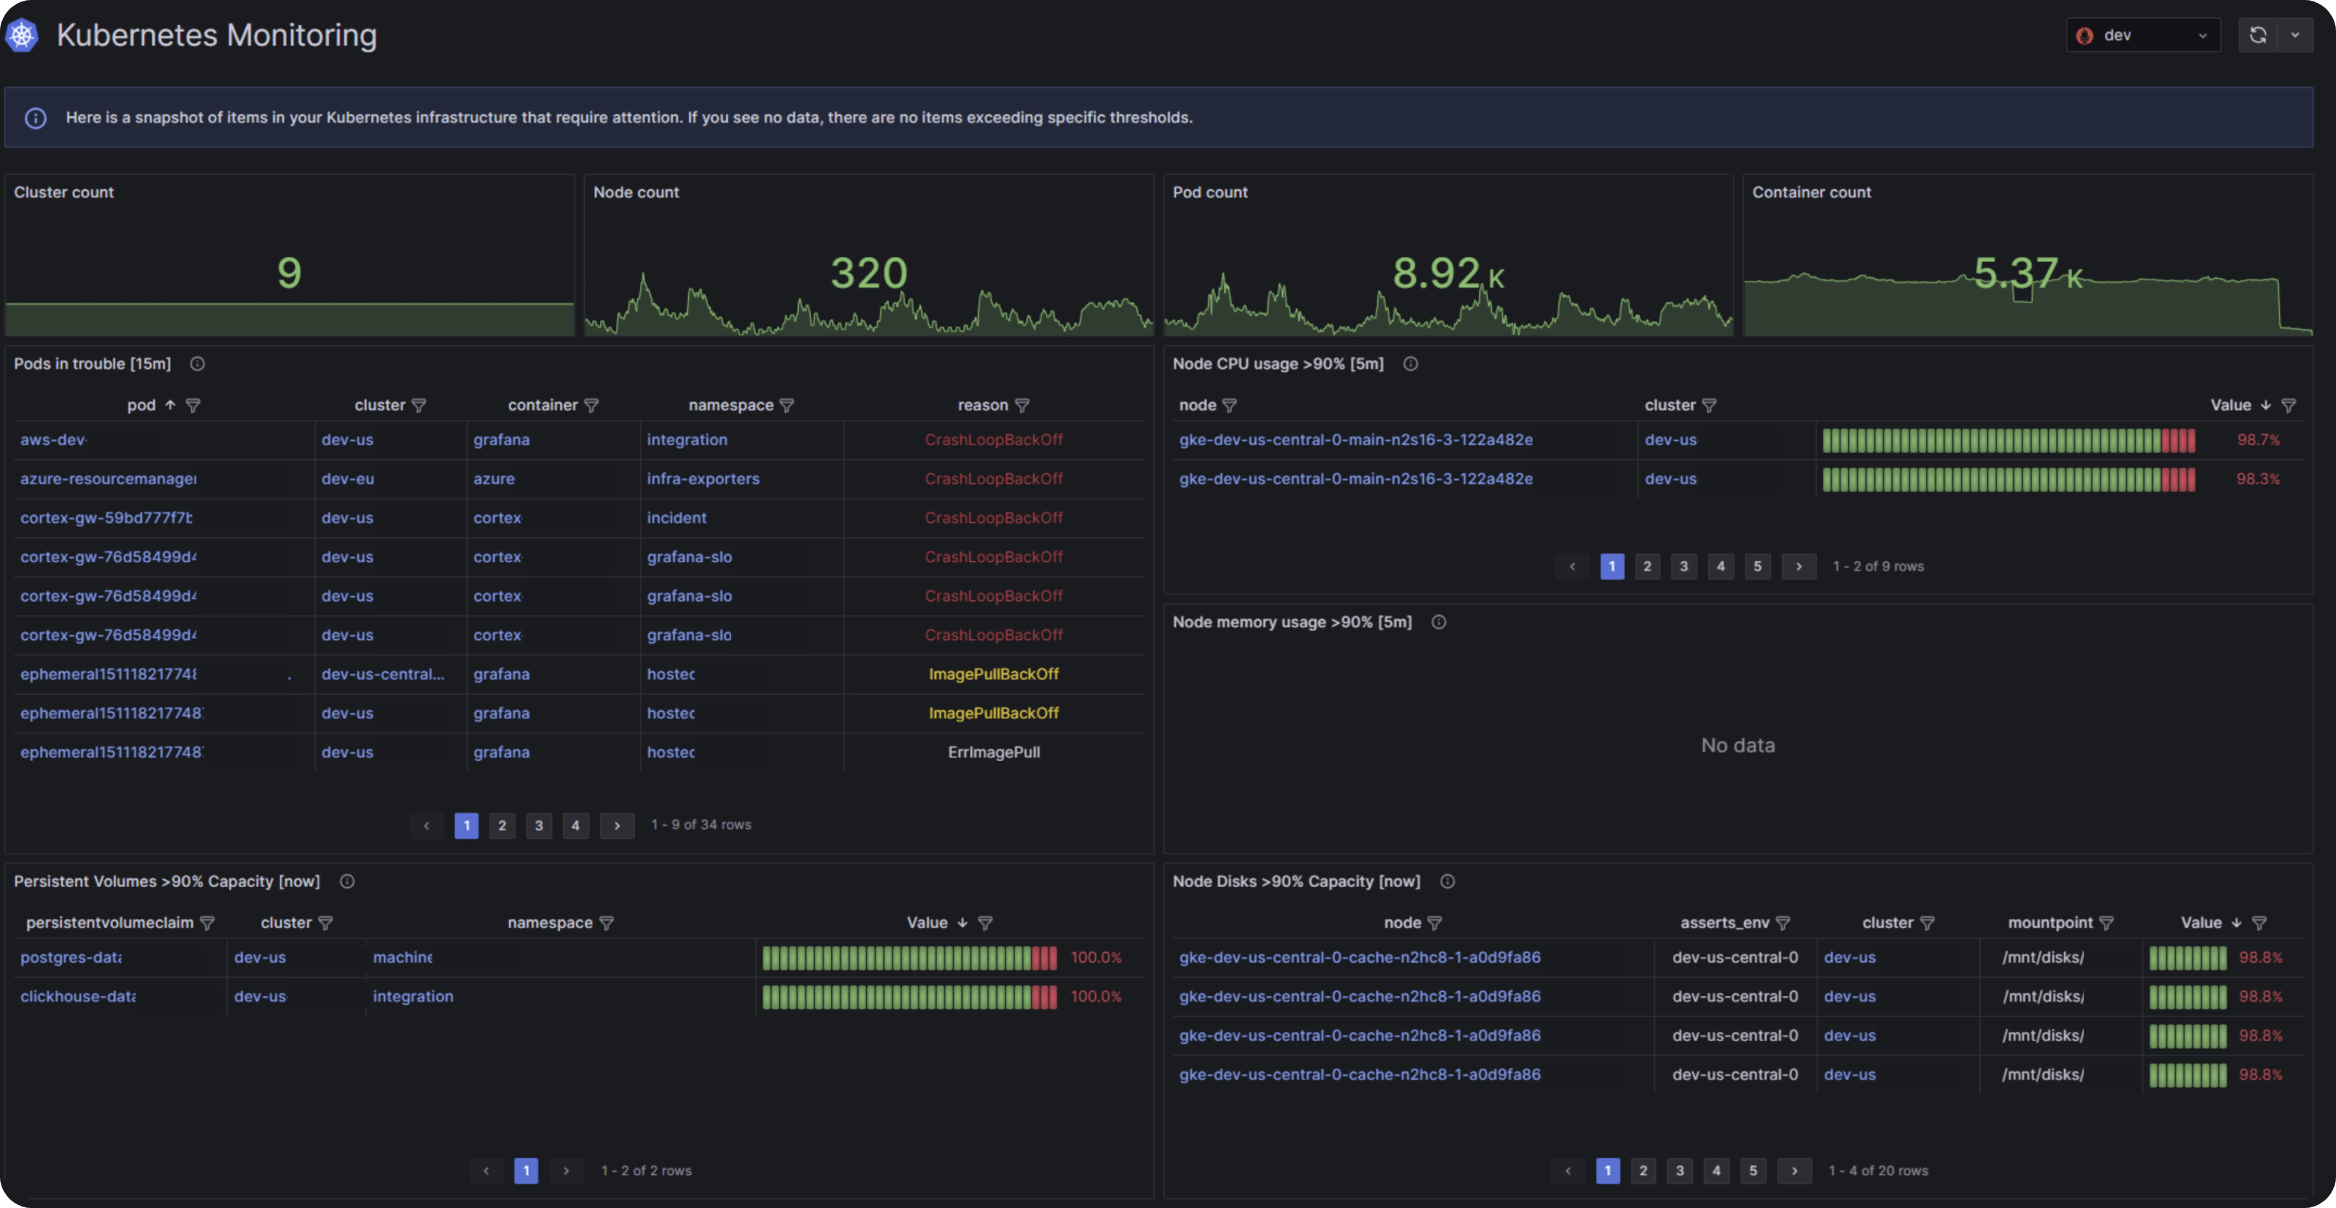
High-priority issues at a glance
Instantly identify fleet issues with an overall snapshot of all your infrastructure components that have breached preset thresholds for:
- Node CPU and memory usage
- Node disk and persistent volume capacity
- Pods in a non-running state and the cause for this state
Full visibility, from Kubernetes clusters to containers
Get a full view of Kubernetes clusters, then drill down to see specific container-level information.
- Cost and resource usage attribution for every infrastructure level
- Color-coded resource usage visualizations and icons lead to faster issue identification and resolution
- Side-by-side peak vs. average resource efficiency comparisons

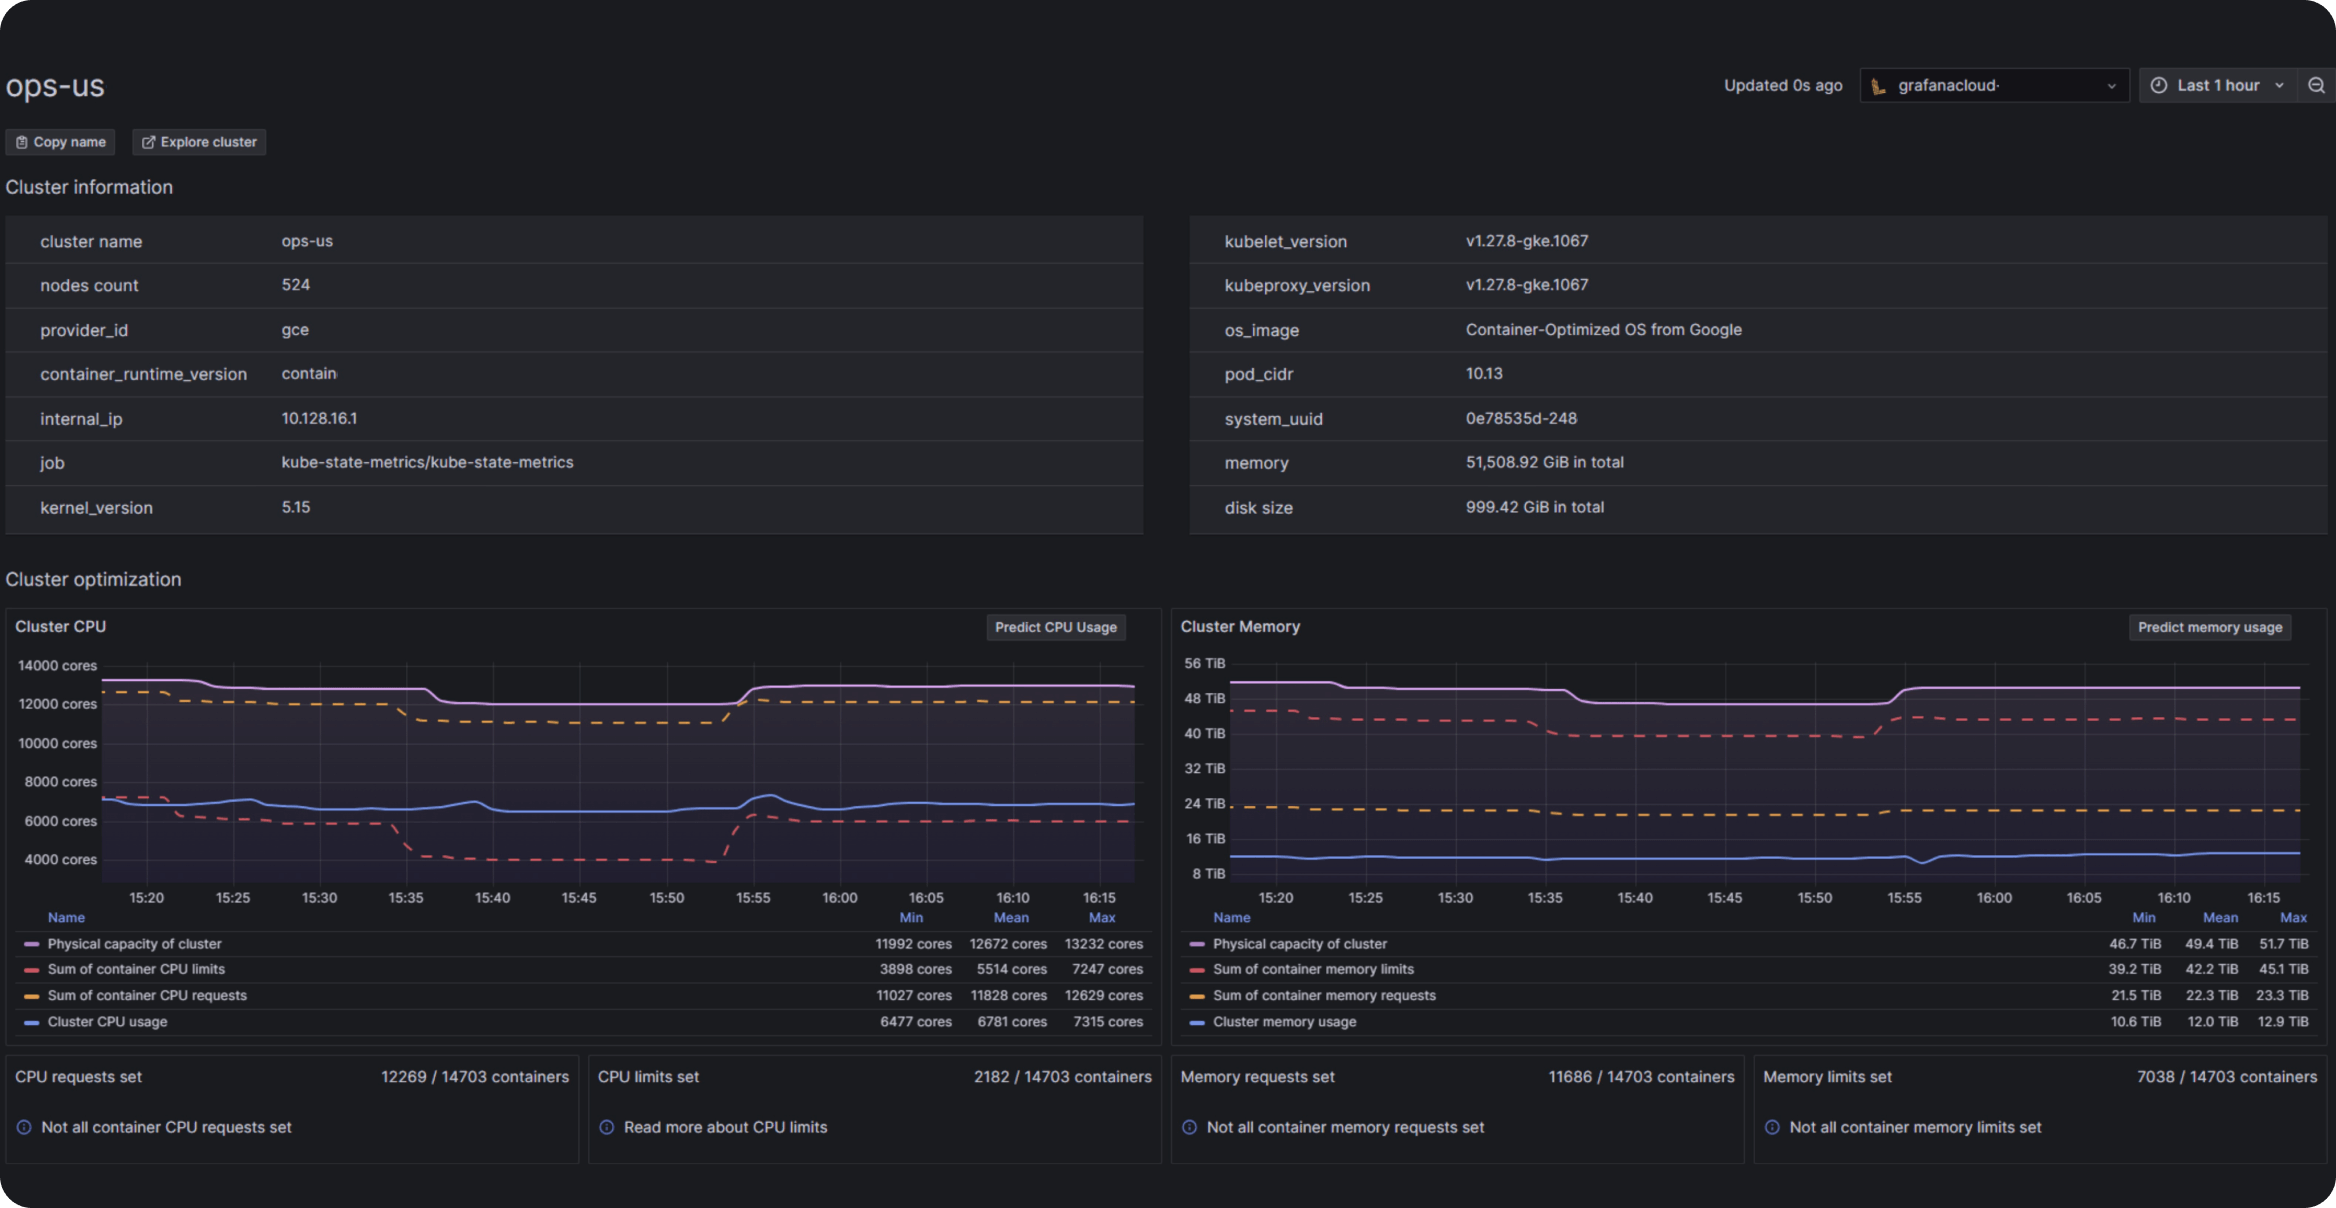
Optimize, analyze, and anticipate your resource usage
Instantly analyze CPU and memory usage trends. Correlate actual usage with limits and requests. Proactively identify issues to achieve optimized resource management.
- Detailed insights at every infrastructure level with historical trends
- Resource forecasting powered by machine learning
- Automated pod CPU outlier detection

Kubernetes container insights
Use the cluster-to-container navigation for instant container clarity.
- Sizing recommendations
- Access to historical data to pinpoint CPU throttling and restarts
Easy deployment
Deploy the Helm chart on any of the major cloud-managed Kubernetes services and Kubernetes distributions.
- Choose which features to enable
- Get Helm installation instructions tailored to your needs

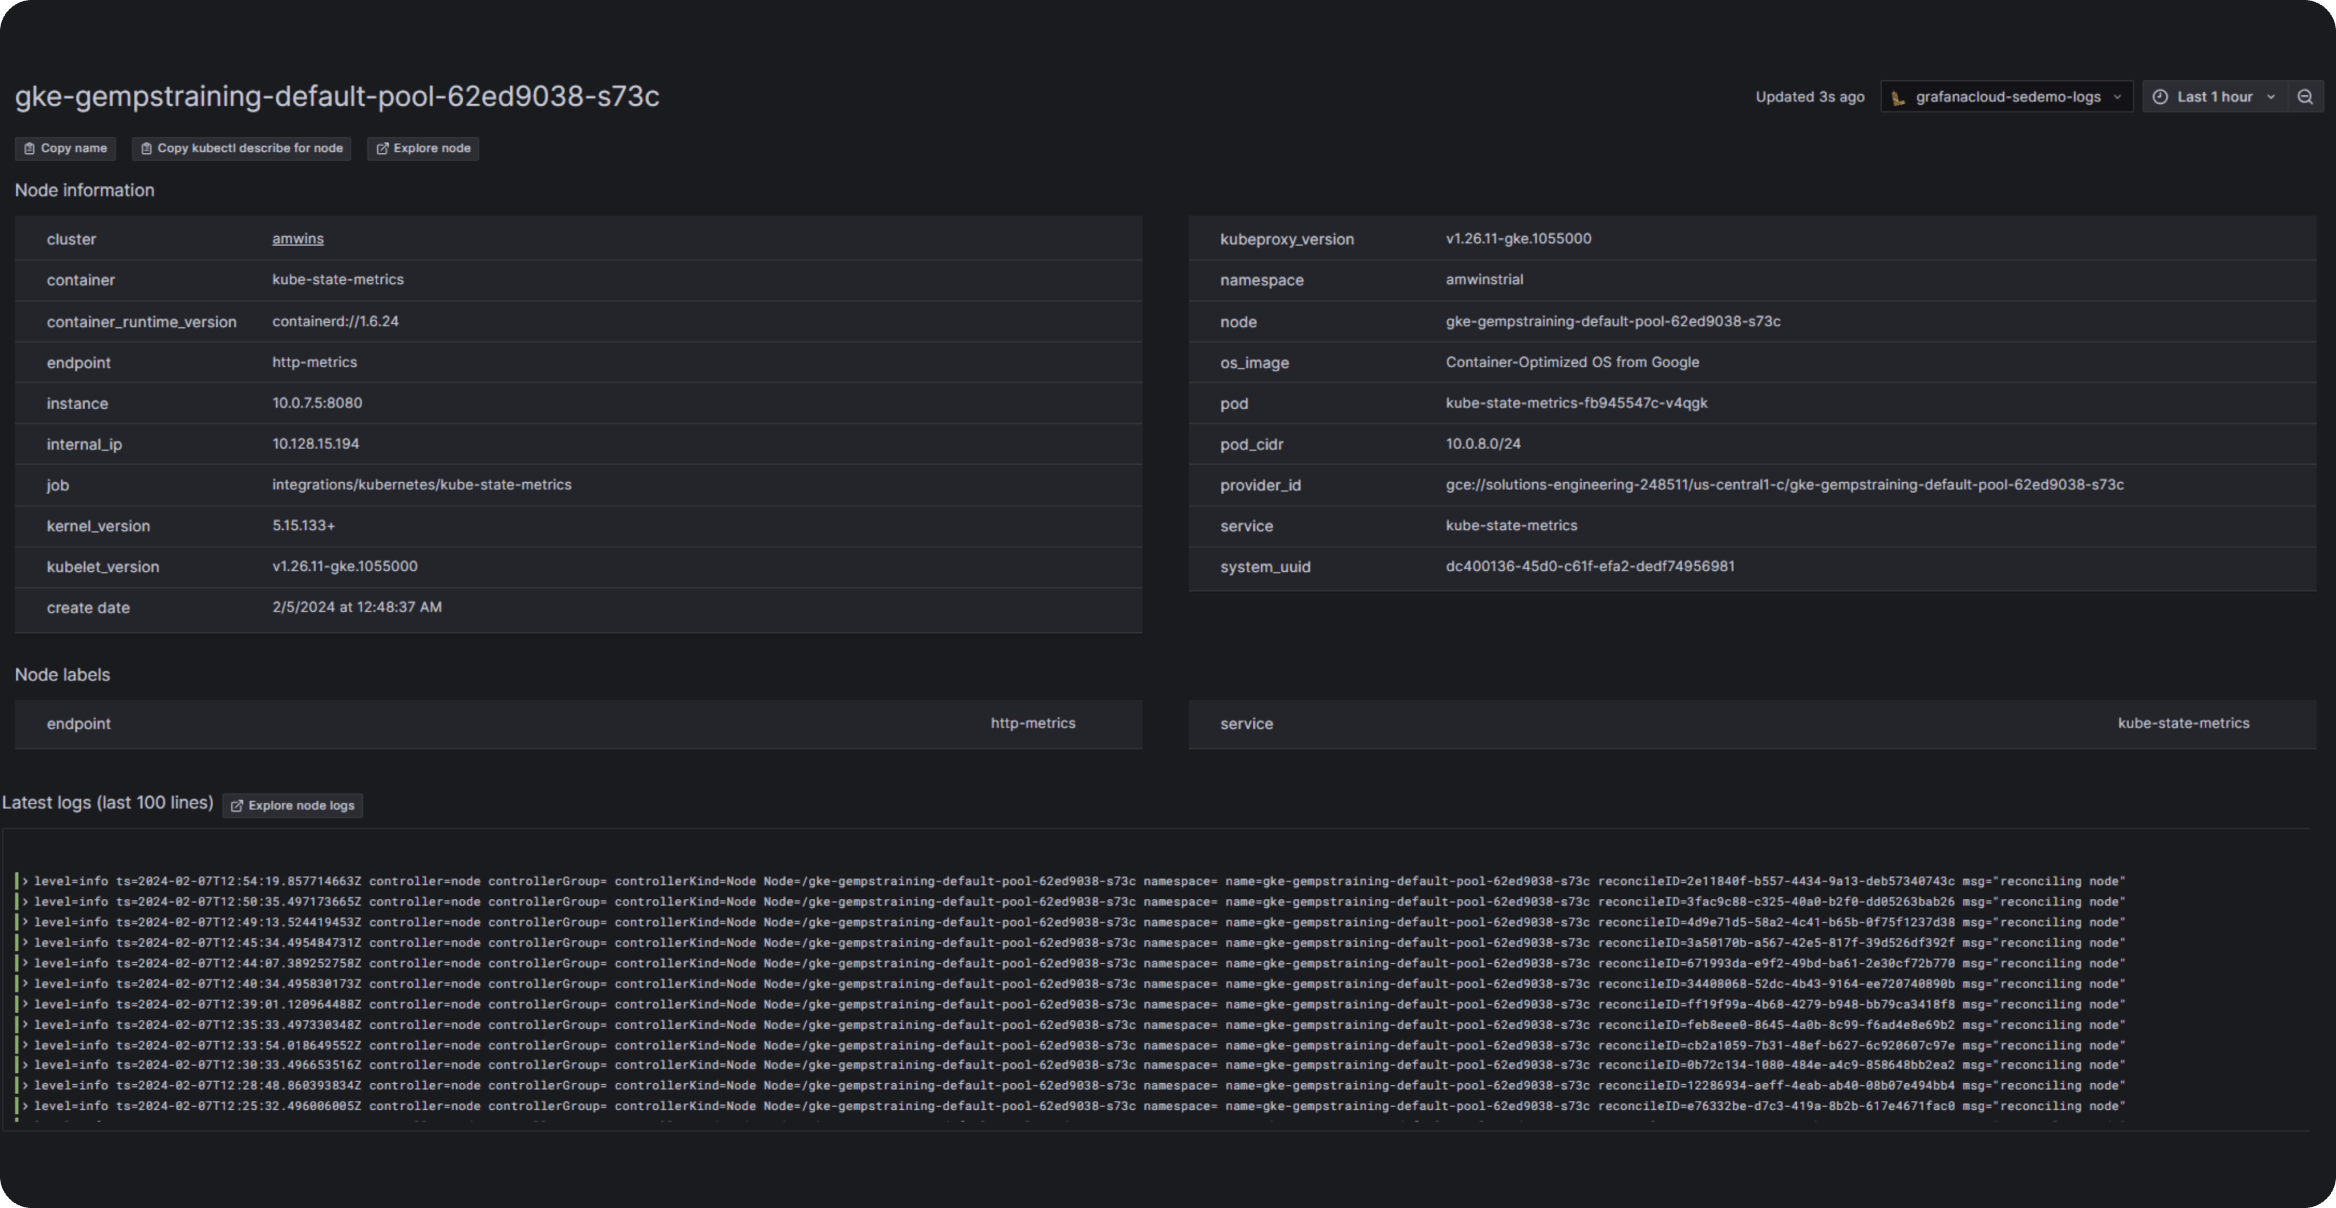
Instant Prometheus-correlated logs
Prometheus’ and Grafana Loki’s metadata keep the same labels for your Kubernetes cluster, so accessing correlated Kubernetes metrics and logs couldn’t be easier.
It’s easy to get started
For full implementation details and best practices
1
Sign up
Create your free Grafana Cloud account.
2
Connect your data
With a few clicks, set up default configurations for prebuilt dashboards and alerting rules.
3
Deploy
Data will stream from your cluster into Grafana Cloud.
Kubernetes metrics and alerting rules
The Kubernetes Monitoring solution in Grafana Cloud ingests a set of default metrics at a 60-second scrape interval. The set of alerting rules helps with setting up and running alerts for clusters and their workloads.
Read more about Kubernetes metrics and alerting rules
Key alerting rules included
Key metrics included
Helpful resources
Ready to get started with Kubernetes Monitoring?
Cloud FreePerfect for early stage and small teams. Free forever
Up to 3 active users.
10k metrics, 50GB logs, & 50GB traces.
Features include:
- 14-day retention
- Grafana OnCall
- Synthetic Monitoring
- Grafana Alerting
Cloud ProPerfect for growing teams at only $8/mo + usage.
Includes all features in Free, plus:
- Retention: 13 months for metrics; 30 days for logs & traces
- Grafana Machine Learning
- SSO/SAML/LDAP
- Data source permissions
- Cloud SLA and support
- Query caching
- Reporting and export
- Optional add-on Enterprise plugin
Cloud AdvancedPerfect for global teams. Custom pricing
Includes all features in Pro, plus:
- Customized retention
- Access to all Enterprise plugins
- Audit logging
- Enhanced LDAP
- Team sync
- Custom branding
- Dedicated technical account management