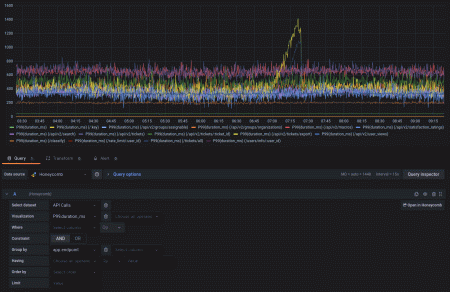
Visualize Honeycomb easily with Grafana
Quickly query and visualize metrics and link to traces from Honeycomb, an observability tool focused on debugging high-cardinality and high-dimensionality data, within Grafana dashboards with the Grafana plugin for Honeycomb.
Get started with these easy steps:
- Create a free account or contact us for a Grafana Enterprise license to run it on your own infrastructure.
- Connect the data source to Honeycomb in Grafana.
- Explore and visualize your Honeycomb data in Grafana!
Need to self-manage?
Get started with these easy steps:
- Create a free account or contact us for a Grafana Enterprise license to run it on your own infrastructure.
- Connect the data source to Honeycomb in Grafana.
- Explore and visualize your Honeycomb data in Grafana!
Need to self-manage?
Get started with these easy steps:
- Go to your Grafana Account Portal and start right now!
- Run a one-line command to install the Grafana Agent
- That’s it! You’ll immediately see pre-built Grafana dashboards and alerts tailored for monitoring Honeycomb!
Get started with these easy steps:
- Install the Honeycomb plugin to get started.
- Connect the data source to Honeycomb in Grafana.
- Explore and visualize your Honeycomb data in Grafana!
Get started with these easy steps:
- Manage this plugin with your Grafana Cloud Pro account.
Get started with these easy steps:
- Install the Honeycomb plugin to get started.
- Connect the data source to Honeycomb in Grafana.
- Explore and visualize your Honeycomb data in Grafana!
Get started with these easy steps:
- Install the Honeycomb plugin to get started.
- Connect the data source to Honeycomb in Grafana.
- Explore and visualize your Honeycomb data in Grafana!
Enterprise customers have access to all Grafana Enterprise plugins.
Install the Honeycomb plugin to get started.
Cloud free customers have access to all Grafana Enterprise Plugins for up to 3 users.
Install the Honeycomb plugin to get started.
Get started with these easy steps:
- Create a free account or contact us for a Grafana Enterprise license to run it on your own infrastructure.
- Connect the data source to Honeycomb in Grafana.
- Explore and visualize your Honeycomb data in Grafana!
Need to self-manage?

