Visualization and monitoring solutions
Visualization and monitoring solutions  /  Monitor Apache ActiveMQ
Apache ActiveMQ logo

Monitor Apache ActiveMQ easily with Grafana

Easily monitor your deployment of Apache ActiveMQ, an open source message broker software that facilitates communication between different applications or components using messaging patterns, with Grafana Cloud’s out-of-the-box monitoring solution. The Grafana Cloud forever-free tier includes 3 users and up to 10k metrics series to support your monitoring needs.

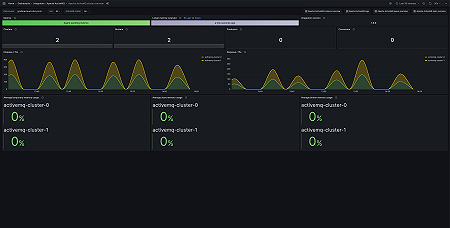
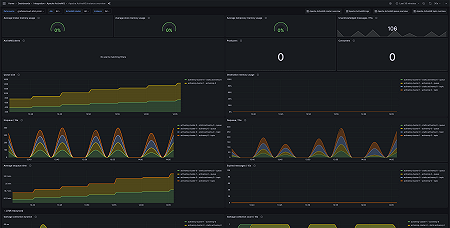
Apache ActiveMQ cluster overview
Apache ActiveMQ instance overview
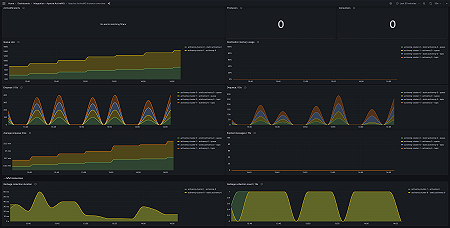
Apache ActiveMQ instance overview (jvm)
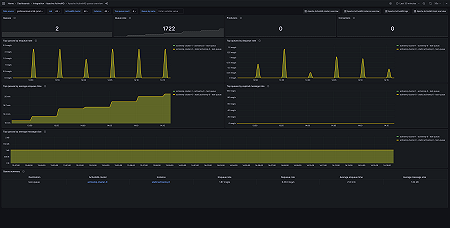
Apache ActiveMQ queue overview
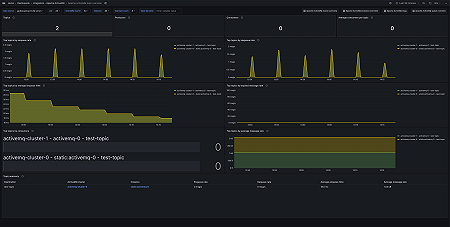
Apache ActiveMQ topic overview
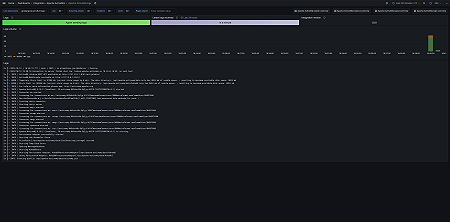
Apache ActiveMQ logs overview

Key metrics included

activemq_memory_usage_ratio
activemq_message_total
activemq_queue_average_enqueue_time
activemq_queue_average_message_size
activemq_queue_consumer_count
activemq_queue_dequeue_count
activemq_queue_enqueue_count
activemq_queue_expired_count
activemq_queue_memory_percent_usage
activemq_queue_producer_count
activemq_queue_queue_size
activemq_store_usage_ratio
activemq_temp_usage_ratio
activemq_topic_average_enqueue_time
activemq_topic_average_message_size
activemq_topic_consumer_count
activemq_topic_dequeue_count
activemq_topic_enqueue_count
activemq_topic_expired_count
activemq_topic_memory_percent_usage
activemq_topic_producer_count
activemq_topic_queue_size
jvm_gc_collection_count
jvm_gc_duration_seconds

Key alerting rules included

ApacheActiveMQHighTopicMemoryUsage
ApacheActiveMQHighQueueMemoryUsage
ApacheActiveMQHighStoreMemoryUsage
ApacheActiveMQHighTemporaryMemoryUsage