What's new from Grafana Labs
Grafana Labs products, projects, and features can go through multiple release stages before becoming generally available. These stages in the release life cycle can present varying degrees of stability and support. For more information, refer to release life cycle for Grafana Labs.
Loading...
Area of interest:
Cloud availability:
Cloud editions:
Self-managed availability:
Self-managed editions:
No results found. Please adjust your filters or search criteria.
There was an error with your request.
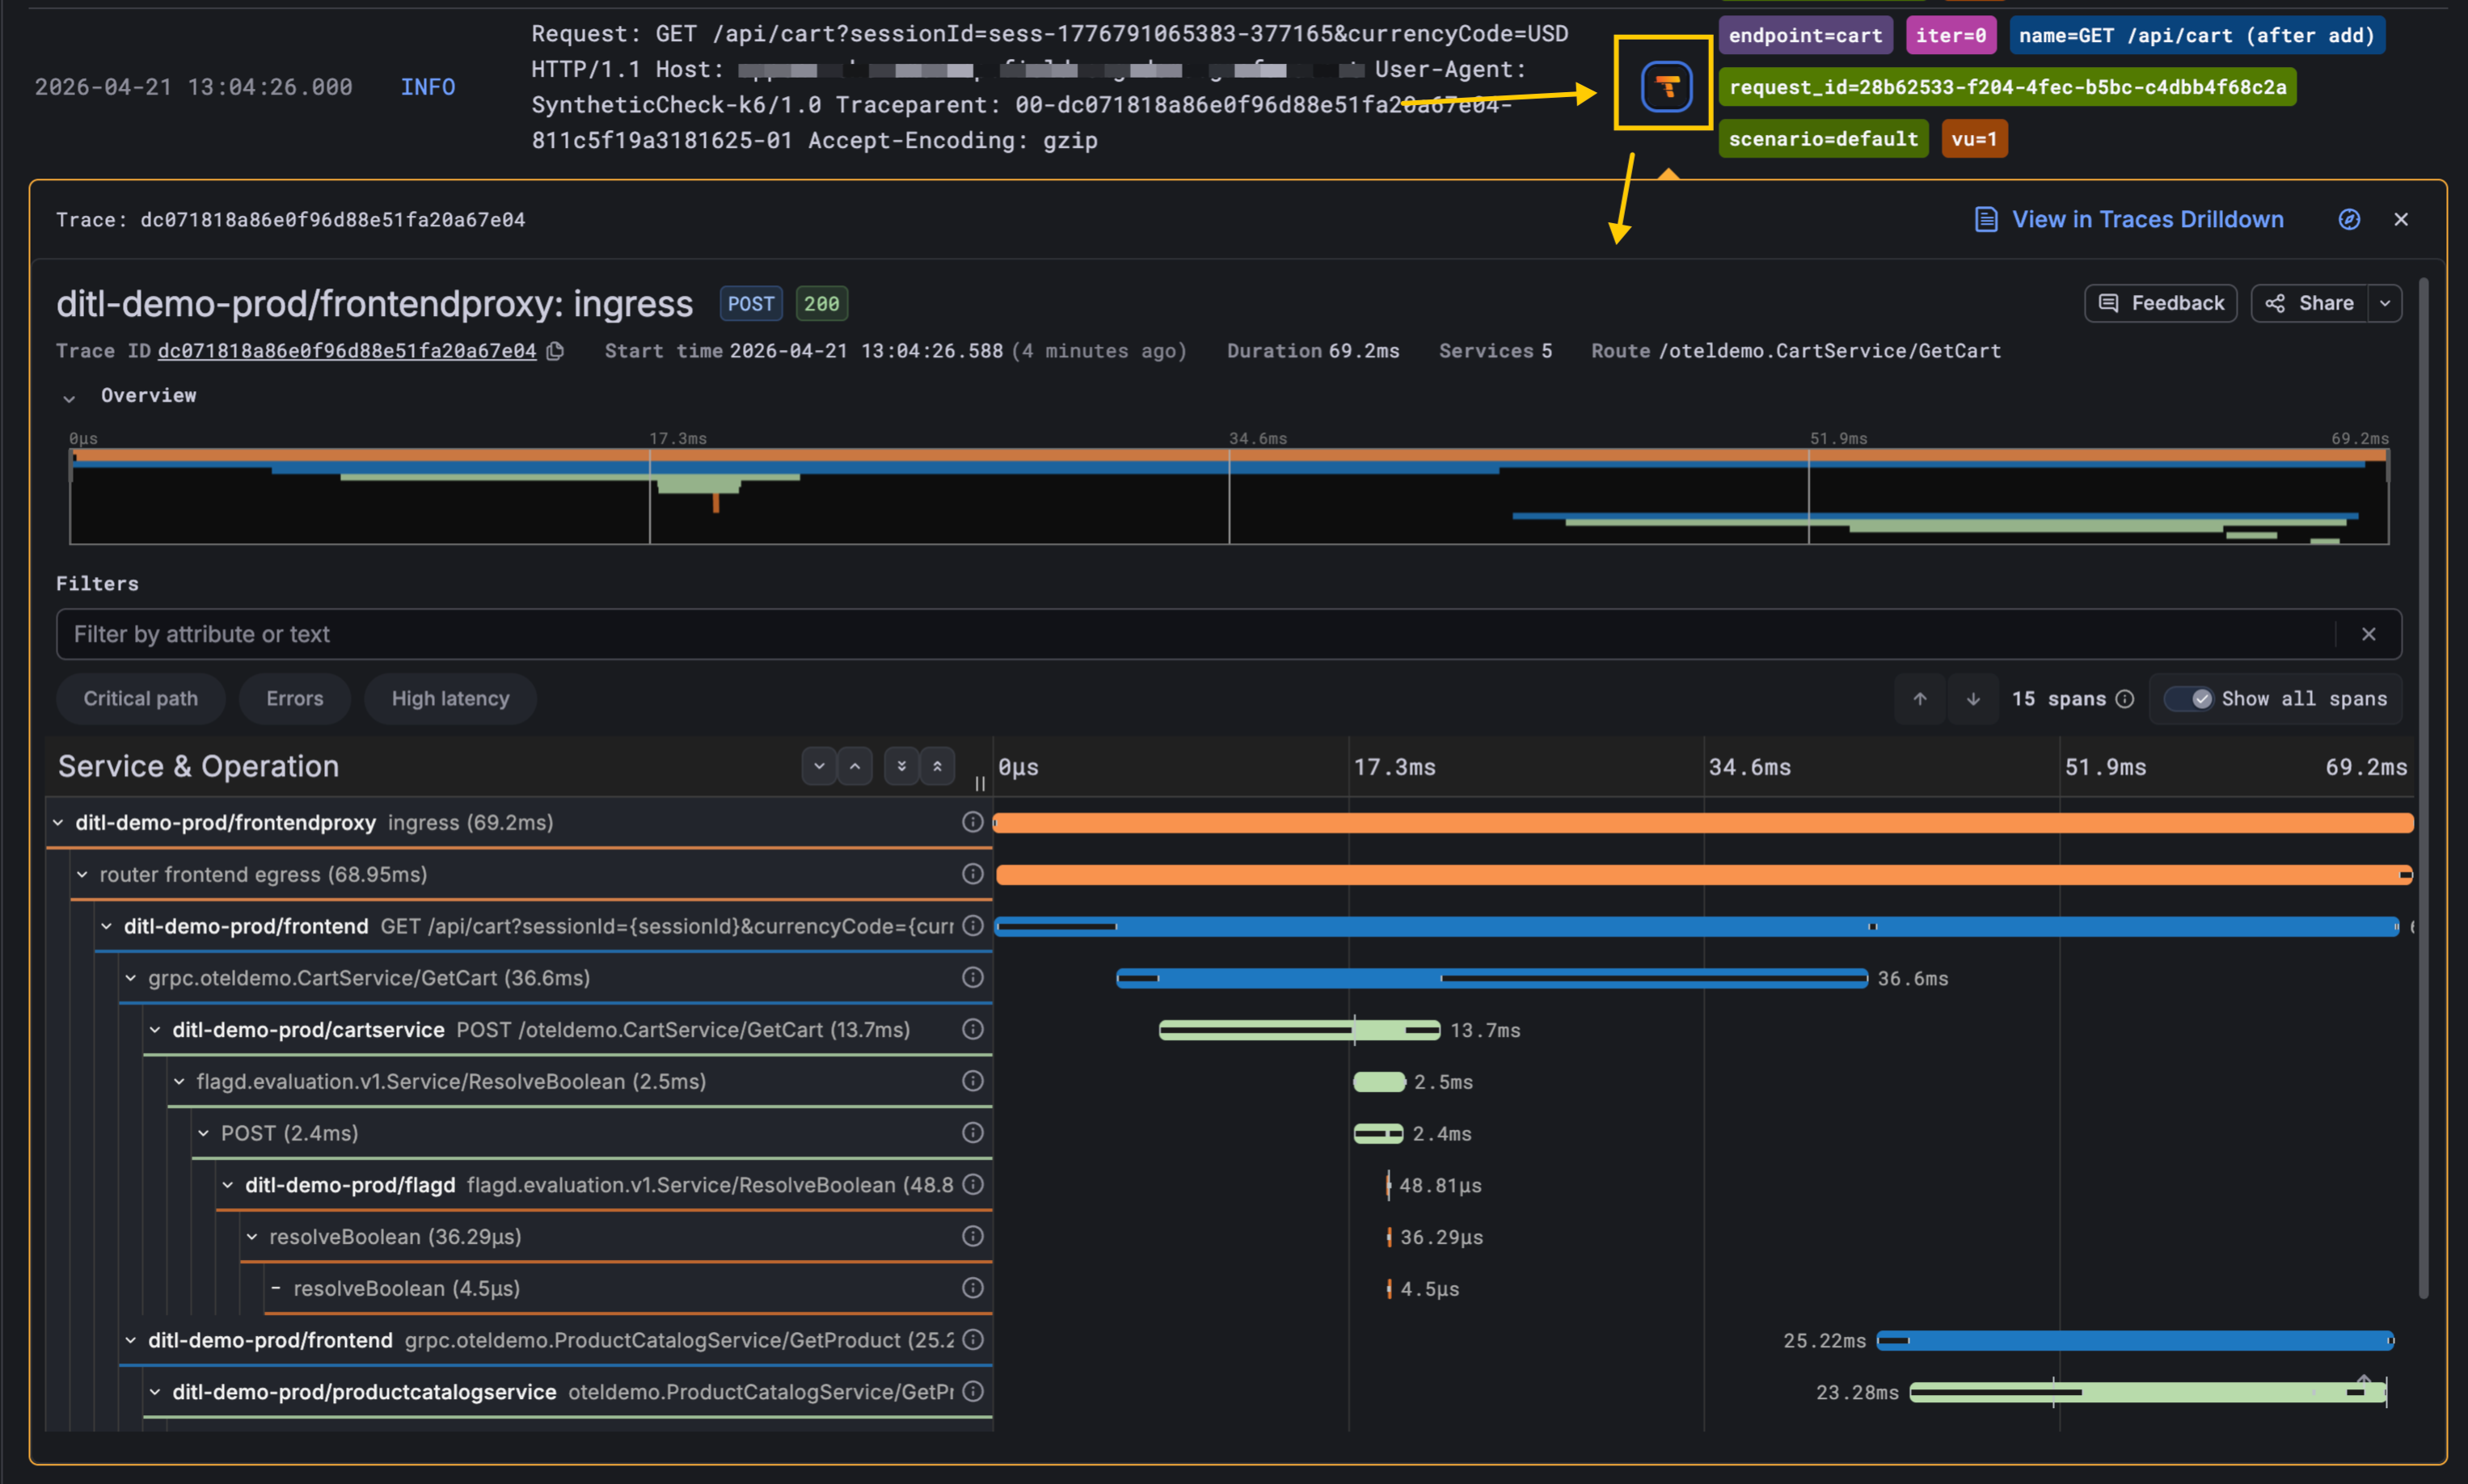
Synthetic Monitoring checks are now linked to distributed traces they generate in Grafana Cloud Traces! When a Scripted check fails or looks slow, you can open the underlying trace with a single click from the check’s logs and see exactly which service, span, and downstream call caused the problem.
This helps to shrink the gap between a poor user experience and the underlying root cause.
Keep your team’s content all in one place, making it easier to find, organize, and manage access.
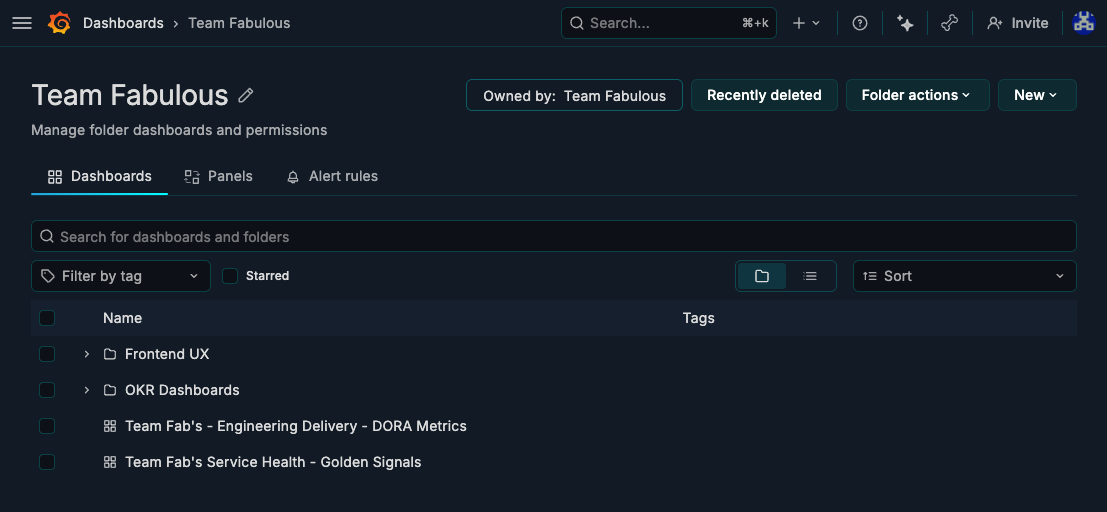
Team folders help you associate folders with teams so admins and team members can find the right dashboards, library panels, and alert rules faster. When you belong to a team that owns a folder, Grafana surfaces those folders at the top of the Dashboards page and in your team details, giving your team a clear home from day one.
Today, we announce that access to Assistant now extends to Grafana Enterprise and Grafana OSS users. This makes Grafana Assistant available in your self-managed environment to help you analyze telemetry data and code in real time, build dashboards, ask questions, and more. Self-managed Grafana users can create a Grafana Cloud account and connect it to their Grafana installation via a one-click setup.
We’re excited to announce AWS Grafana Assume Role support across Grafana’s AWS data sources, now generally available in Grafana Cloud.
Instead of configuring long-lived AWS access keys and secrets in each data source, you can now authenticate using IAM role assumption. Grafana uses the AWS Security Token Service (STS) to generate short-lived, scoped credentials at query time, following AWS security best practices for least-privilege access.
Grafana is moving to /apis, an API layer that powers the App Platform and gives us a more consistent, scalable foundation going forward. With Grafana 13, we are officially deprecating the /api path in favor of the new /apis path. Deprecating /api marks our commitment to this new model.
Git Sync is now generally available for all Grafana Cloud and self-managed Grafana users.
Connect your Grafana instance to GitHub, GitLab, Bitbucket, or any git repository to manage dashboards as code. You can edit dashboards directly in Grafana and then save, commit, and open a pull request without leaving the UI.
Adaptive Logs Drop rules allow you precisely define noisy or wasteful logs to drop, and can be used in addition to our own optimization recommendations. Use cases for drop rules include filtering out debug logs, dropping health check log lines, or downsampling in non-production environments.
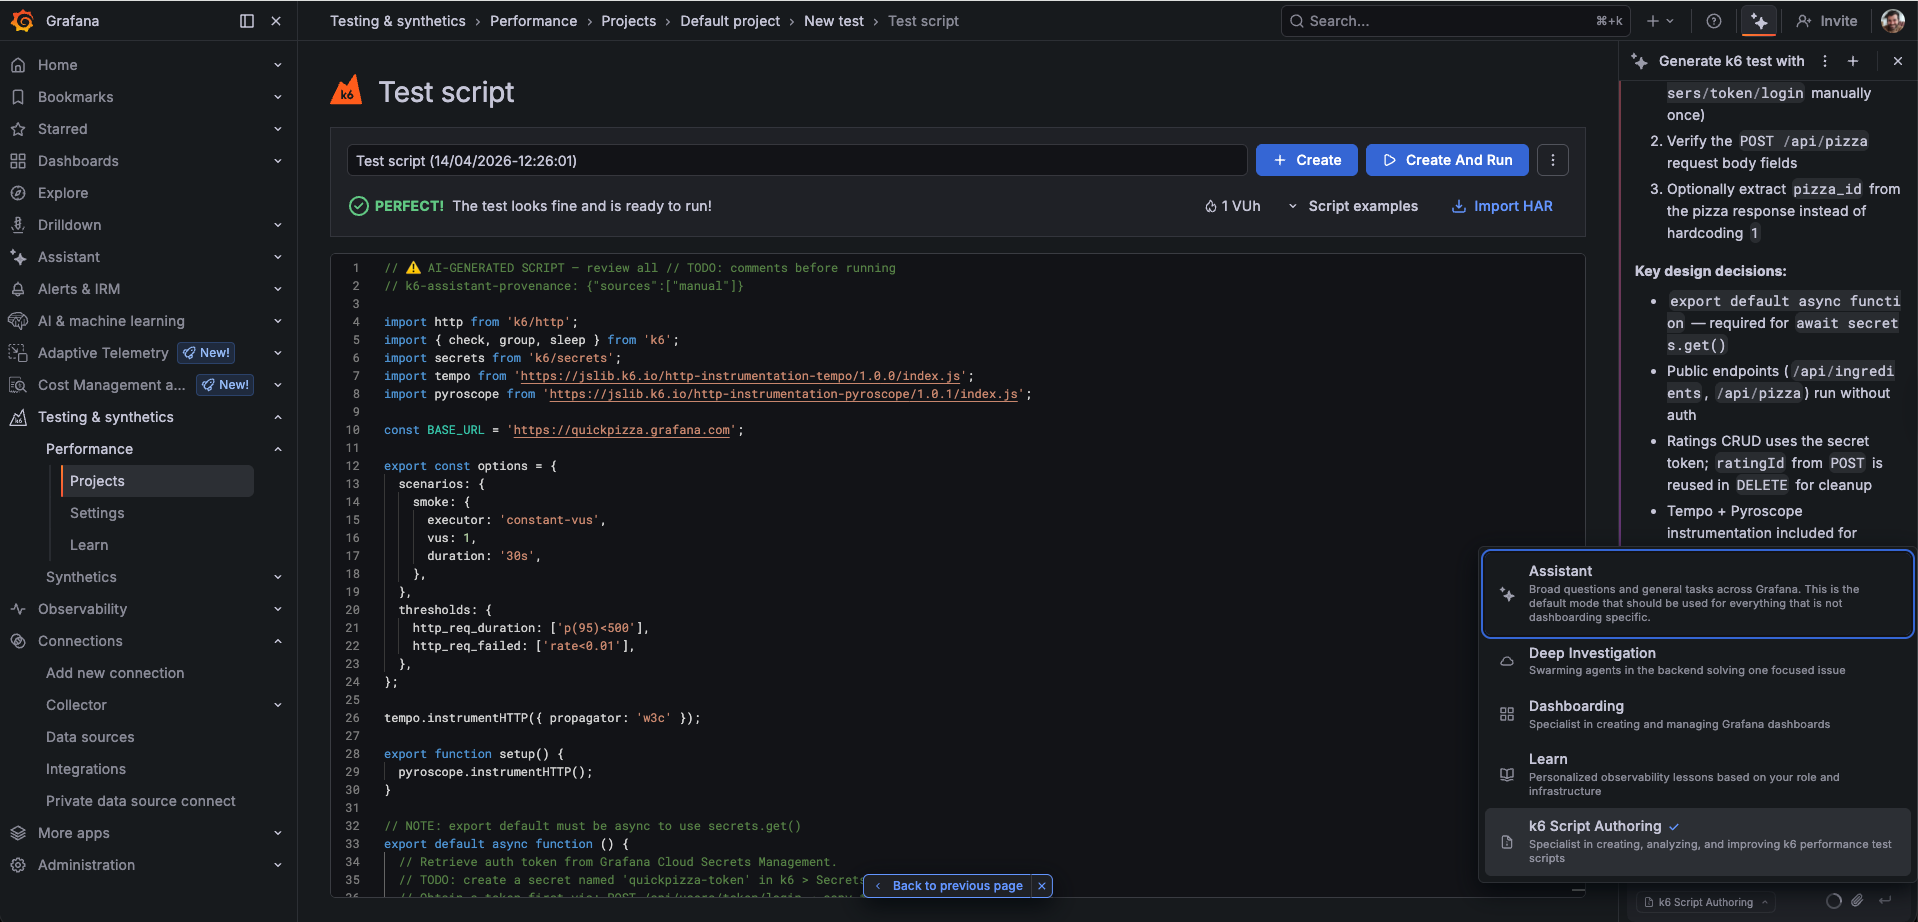
Writing a solid k6 performance test still means juggling URLs, VU counts, checks, thresholds, and how metrics will look in Grafana after the run. It is easy to get stuck on a blank script or to ship something that runs locally but does not match how your service actually behaves in production.
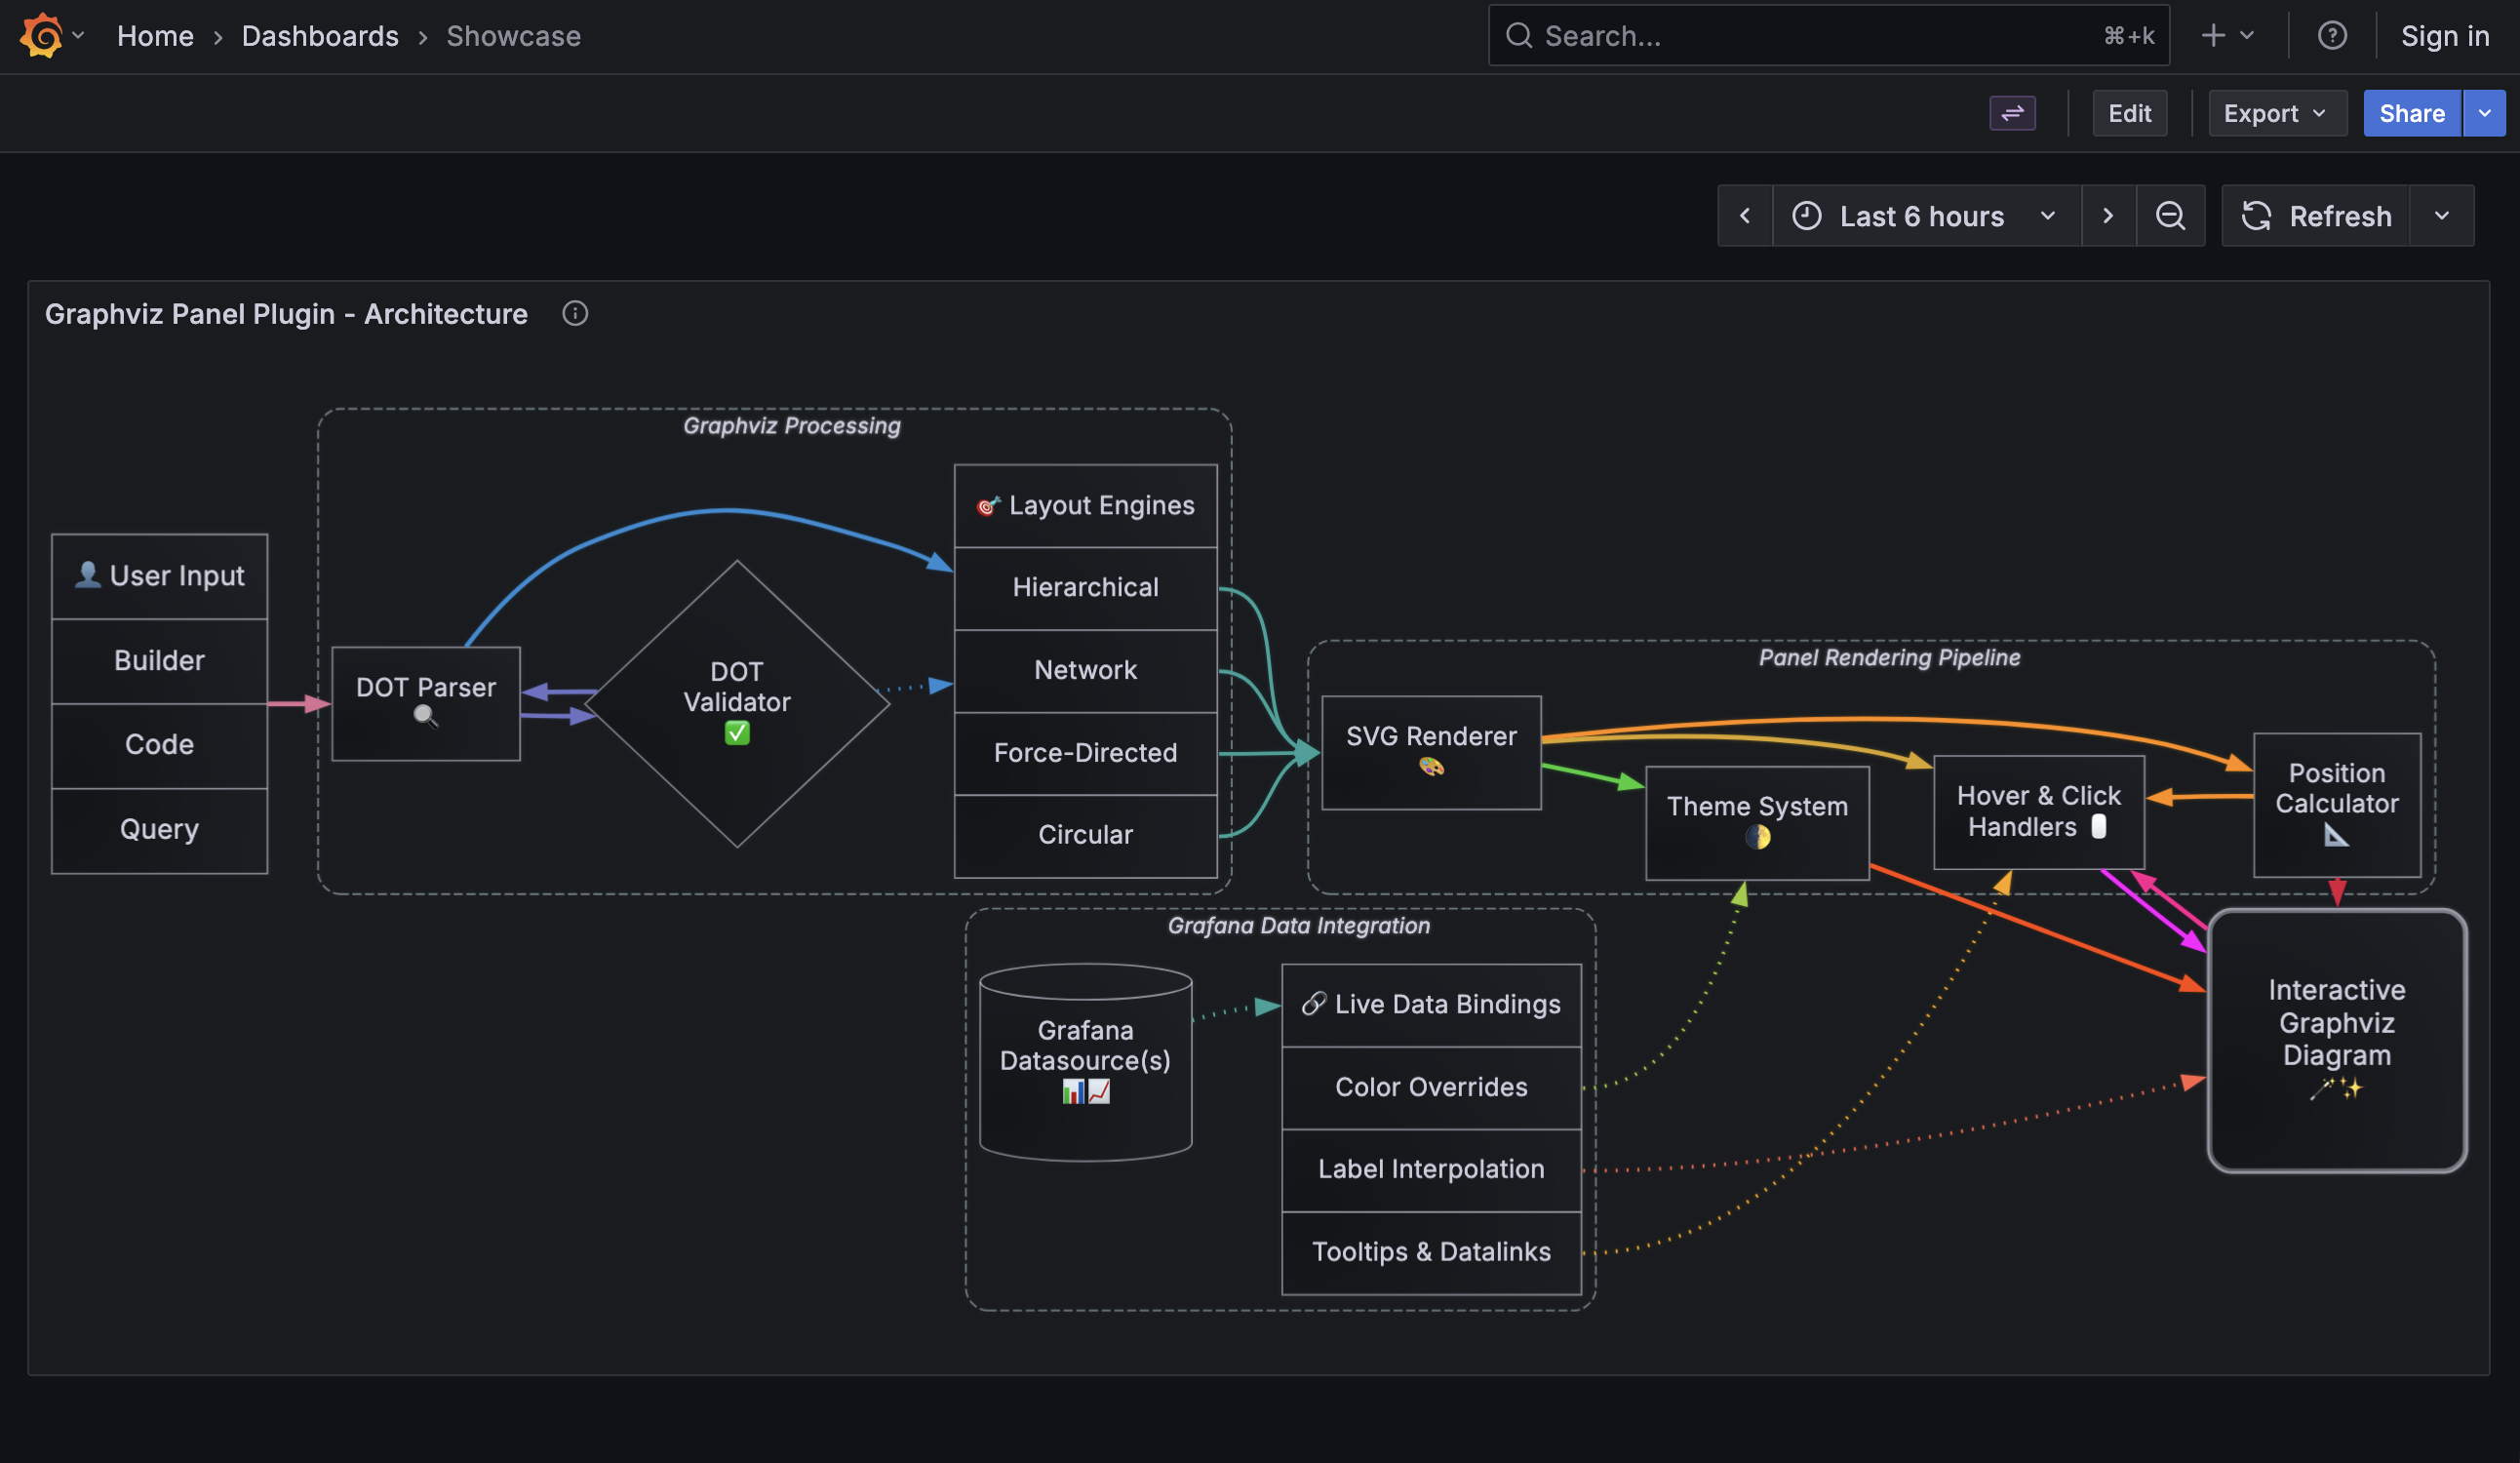
The new Graphviz panel plugin lets you define interactive diagrams in the Graphviz DOT language, and map live data to them from any data source.
Go beyond the visual query builder in Elasticsearch with a new raw query editor and support for two query languages: Elasticsearch Query DSL and ES|QL.
Grafana v13.0 upgrades the core application from React 18 to React 19. The SceneViewer panel in the IoT TwinMaker app (grafana-iot-twinmaker-app) depends on React APIs removed in React 19 and will fail to render after upgrading.
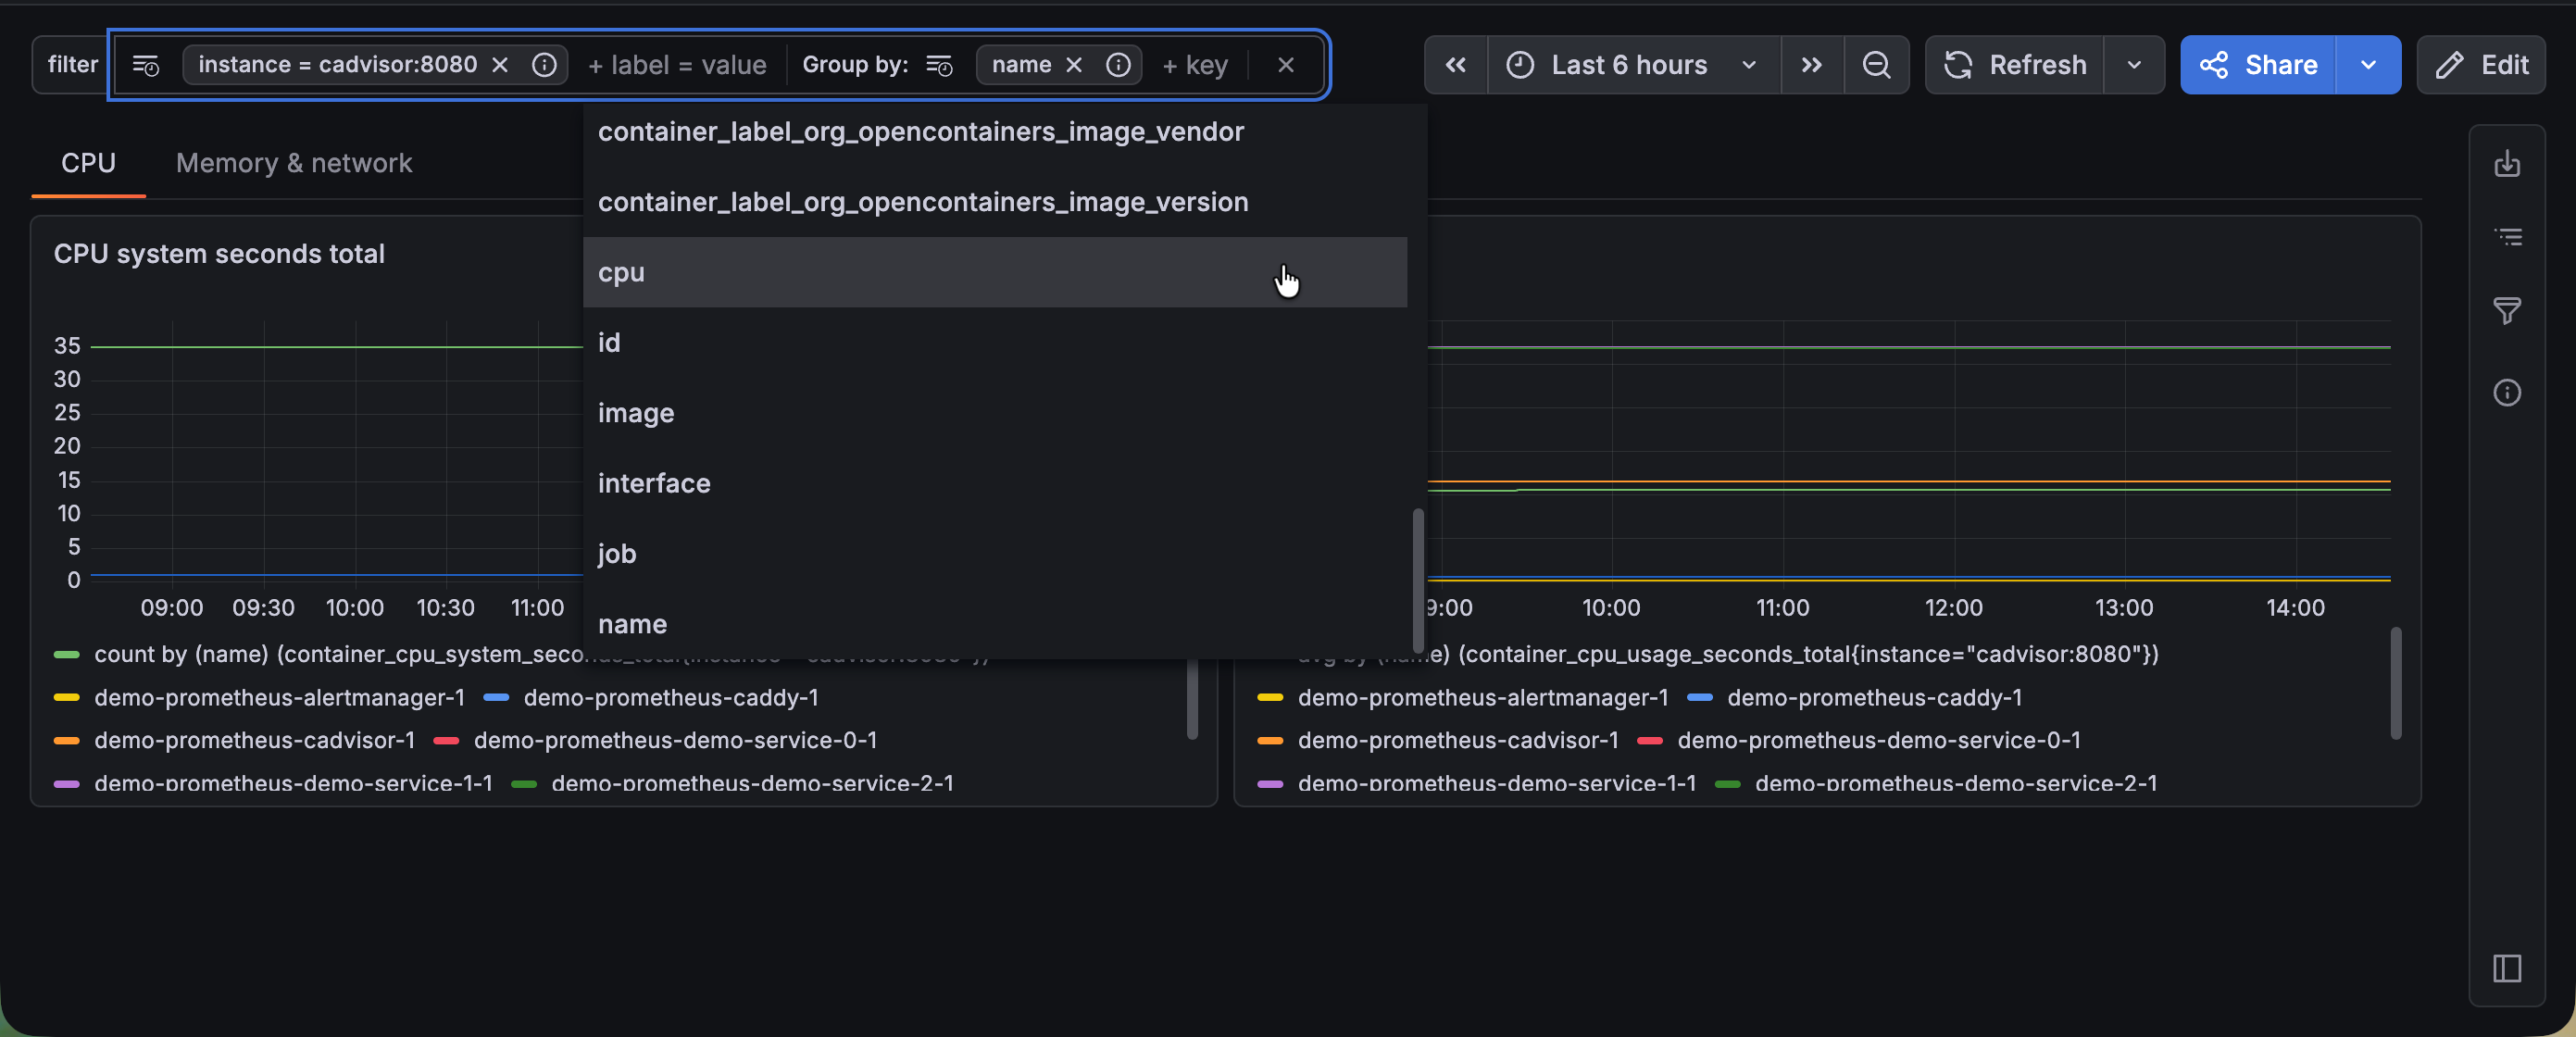
Drilling down into your data across a dashboard has traditionally meant working with basic filter controls, re-entering the same filters you used yesterday, and losing track of which filters are active when many are applied. Introducing the new Filter and Group by dashboard control to tackle all of these friction points and make dashboard exploration faster and more intuitive.
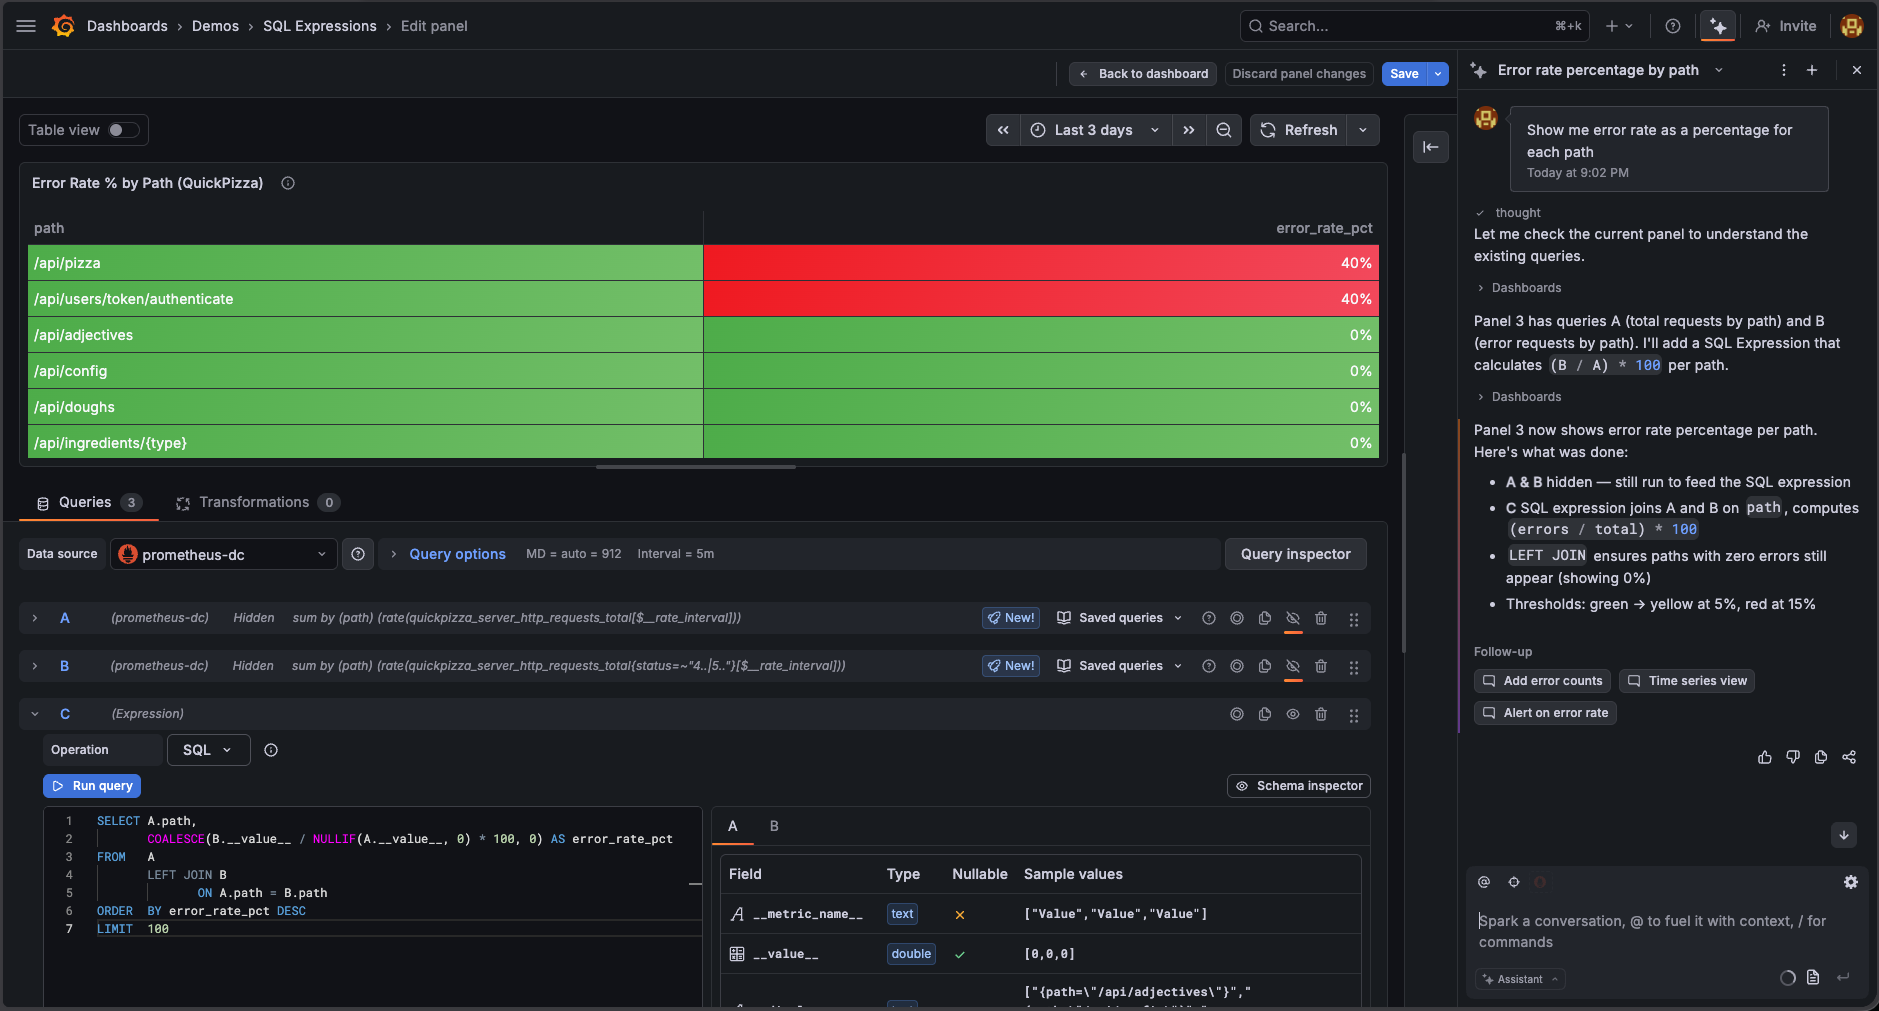
SQL Expressions let you combine and transform data across multiple queries using familiar SQL-joining results, computing ratios, and filtering before aggregating. But to use it, you had to know the feature existed, learn that your query names become table names, and get the MySQL-dialect syntax right yourself.
In Grafana 12.2.0, we introduced two new settings for controlling audit log emission for data source queries: log_datasource_query_request_body and log_datasource_query_response_body, which logs the request and response body payloads respectively.
Styling panels in Grafana used to require a lot of manual work: editing each panel individually, or duplicating one just to reuse its look and then swapping out the query. With the new copy-paste styles feature, you can copy the styling from one panel and apply it to another in just a couple of clicks.